A Cholangiocarcinoma Prediction Model Based on Random Forest and Artificial Neural Network Algorithm
By Jianhua Liao1, Chunyan Meng1, Baoqing Liu1, Mengxia Zheng1, Jun Qin2Affiliations
doi: 10.29271/jcpsp.2023.05.578ABSTRACT
Objective: To construct a prognostic model using artificial neural network (ANN) approach, providing an idea for the prediction and diagnosis of cholangiocarcinoma (CCA).
Study Design: Experimental study.
Place and Duration of the Study: Department of General Surgery, Zhenjiang Hospital, Zhenjiang Province, China, between January and March 2022.
Methodology: Available datasets were obtained from the Gene Expression Omnibus (GEO) database to construct the train cohort and the test cohort of CCA, and screened out the differentially expressed genes (DEGs) of CCA. Next, an ANN model for CCA diagnosis was constructed based on the scores of the DEGs and evaluated its accuracy and efficiency using ROC curves. Finally, the immune infiltration and the function of extracellular matrix (ECM) protein SPACRL1 were analysed to reveal the characteristic alterations in CCA.
Results: This analysis revealed 166 DEGs, mainly concentrated in the ECM organisation, neutrophil activation and other pathways. Then a set of 17 CCA disease signature genes scores were obtained to build an ANN prediction model and the ROC curve was plotted. The AUC in the train group (0.980) indicated that the accuracy of the diagnosis model is extremely high. Finally, there was a significant increase of B cells naïve (p=0.025), tregs (p=0.004), and macrophages M1 (p<0.001) in the tumour-microenvironment of CCA, while SPARCL1 was a protective factor on disease-specific survival (DSS) in CCA (p=0.009).
Conclusion: This study has developed an accurate prediction model for CCA diagnosis, and identified SPARCL1 as pivotal factor in CCA by modulating the tumour immune-microenvironment.
Key Words: Cholangiocarcinoma, Artificial neural network, Immune microenvironment, Bioinformatics, Prognosis model, SPARCL1.
INTRODUCTION
Cholangiocarcinoma (CCA) is a highly heterogeneous and aggressive malignant tumour that originates from the epithelial cells of the bile ducts and is associated with a terrible prognosis.1 Over the last decade, the global incidence of CCA has been constantly increasing.2 Based on the anatomical location, CCA can be classified into two subtypes: Intrahepatic cholangiocarcinoma (ICC) and extrahepatic cholangiocarcinoma (ECC). ECC can be further divided into perihilar cholangiocarcinoma (pCCA) and distal cholangiocarcinoma (dCCA).3 Currently, surgical resection, radiotherapy, chemotherapy, and biologically targeted therapy are the first-line treatments for CCA.
Among localised patients, and surgical procedures still remain the most preferred method for treating CCA.4 However, due to the insidious onset and rapid progression of the disease, most patients are already at an advanced stage by the time of consultation, which indicate that they have lost the best opportunity for surgery. Even though 25%-35% of patients can undergo radical resection, some of them are prone to recurrence and metastasis after surgery with a survival rate of less than 1 year.5
Since the aetiology of CCA is still unclear and its malignancy degree is hazardous, biomarkers for diagnosis, prognosis and treatment evaluation are urgently required. Therefore, new therapeutic approaches such as molecular targeted therapy and immunotherapy need to be developed and updated. In-depth investigation into the molecular mechanisms of CCA development and the search for new therapeutic targets can be dedicated to improve patients prognosis.
Artificial intelligence has been applied to all the areas of medicine, including clinical diagnosis, precision therapy, and health management, and it has also shown promising results in oncology research, drug discovery, and individualised treatment.6,7
Table I: Composition of datasets for train and test groups.
|
|
Train Group |
|
|
|
Total |
Test Group |
|
Dataset |
GSE26566 |
GSE32225 |
GSE89749 |
GSE132305 |
|
GSE76297 |
|
Normal sample |
6 |
6 |
2 |
38 |
52 |
92 |
|
Tumour sample |
104 |
149 |
118 |
182 |
553 |
91 |
|
Enrollment |
110 |
155 |
120 |
220 |
605 |
183 |
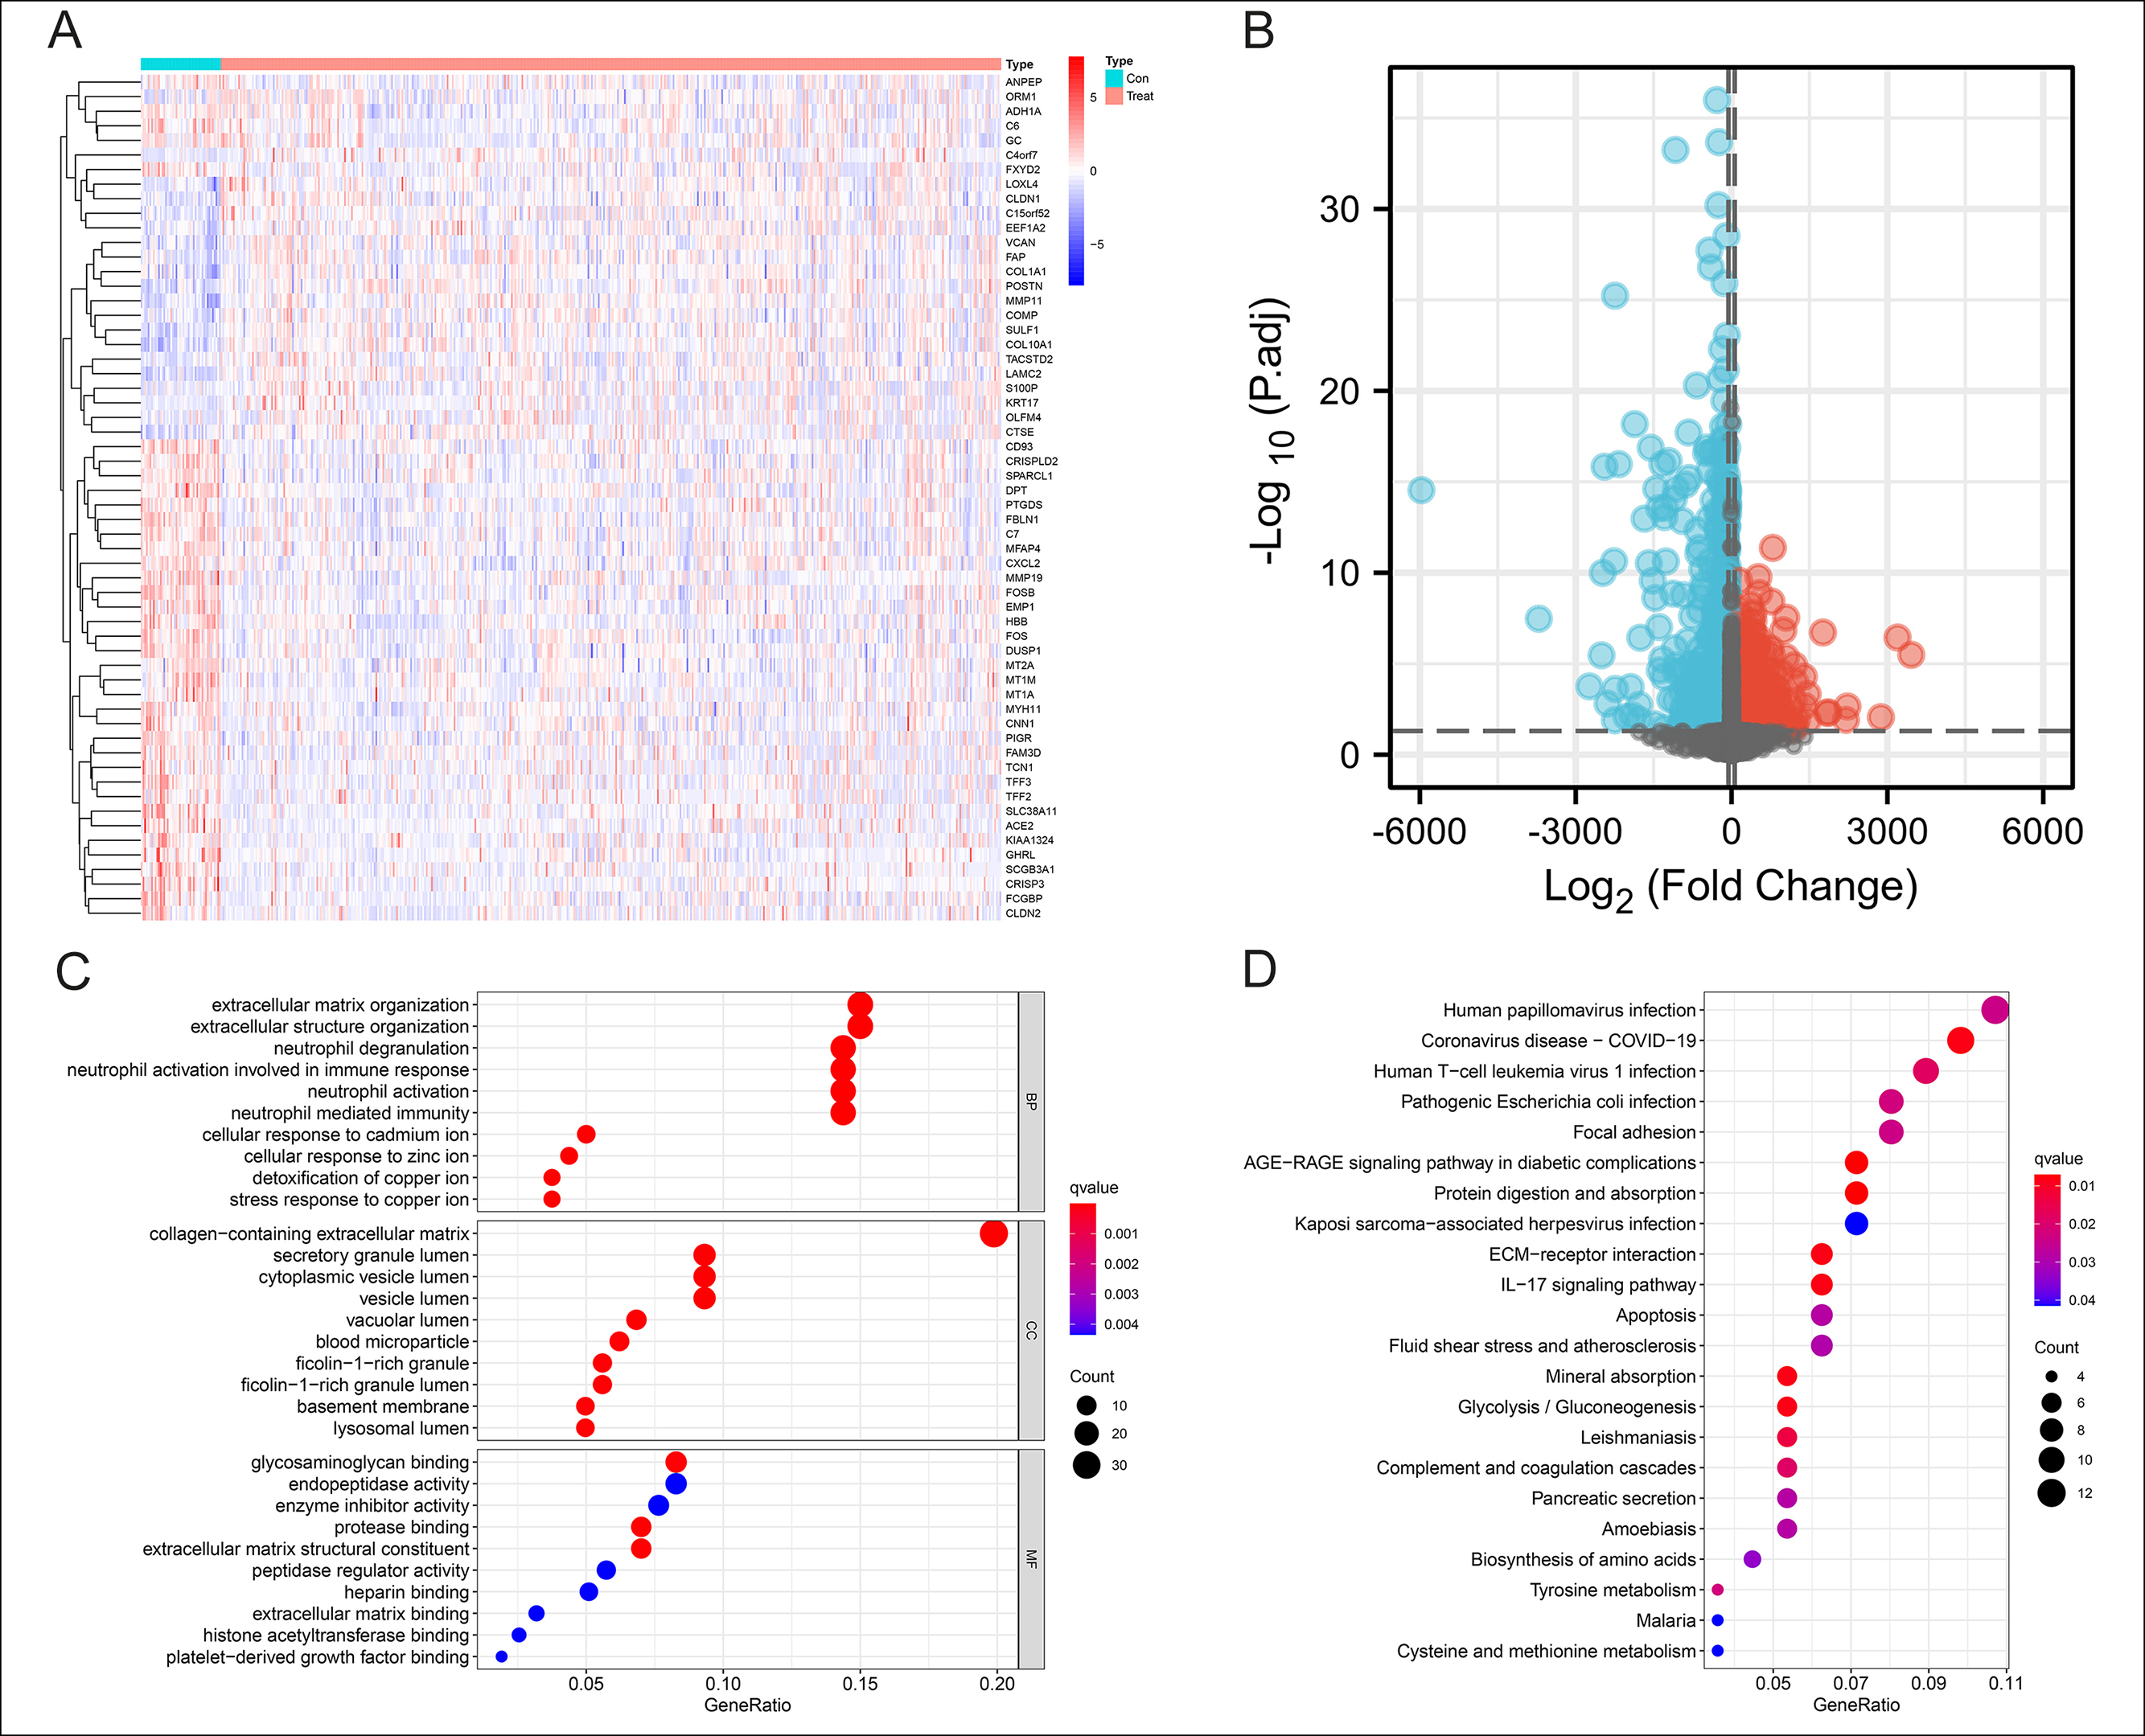 Figure 1: Identification of 166 DEGs in CCA and Functional enrichment analysis. (A-B): Heatmap and volcanic map of 166 differential genes in the Train group with 68 up-regulated and 98 down-regulated. |log2FC| >0.8, p-value <0.05.(C): Top 10 biological processes, cellular components, and molecular functions of GO enrichment analysis. (D): All KEGG enrichment analysis results.
Machine learning has clear the advantages in analysing complex medical data, and its flexibility and scalability are better suited for prognosis prediction. Auslander et al. applied short-term memory information networks to learn about tumour evolution and accurately predict tumour mutation load and mutation rates at different times,8 thus helping clinicians in their decision-making. In future, second-generation genomics will help the clinicians develop individualised treatment plans for patients in real-time by detecting the genetic changes in each patient's tumour molecular profile.9 Artificial neural network (ANN) is the most commonly used analysis method in this area. ANN is a mathematical model that simulates the processing mechanism of the human brain's nervous system for complex information based on the theoretical understanding and abstraction of the human brain's structural response mechanism. The advantages of artificial neural networks include the ability to handle complex non-linear relationships, better fault tolerance, learnability, and adaptability, etc.10-12 The objective of this study was to construct a prognostic model using artificial neural network (ANN) approach, providing an idea for the prediction and diagnosis of cholangiocarcinoma (CCA).
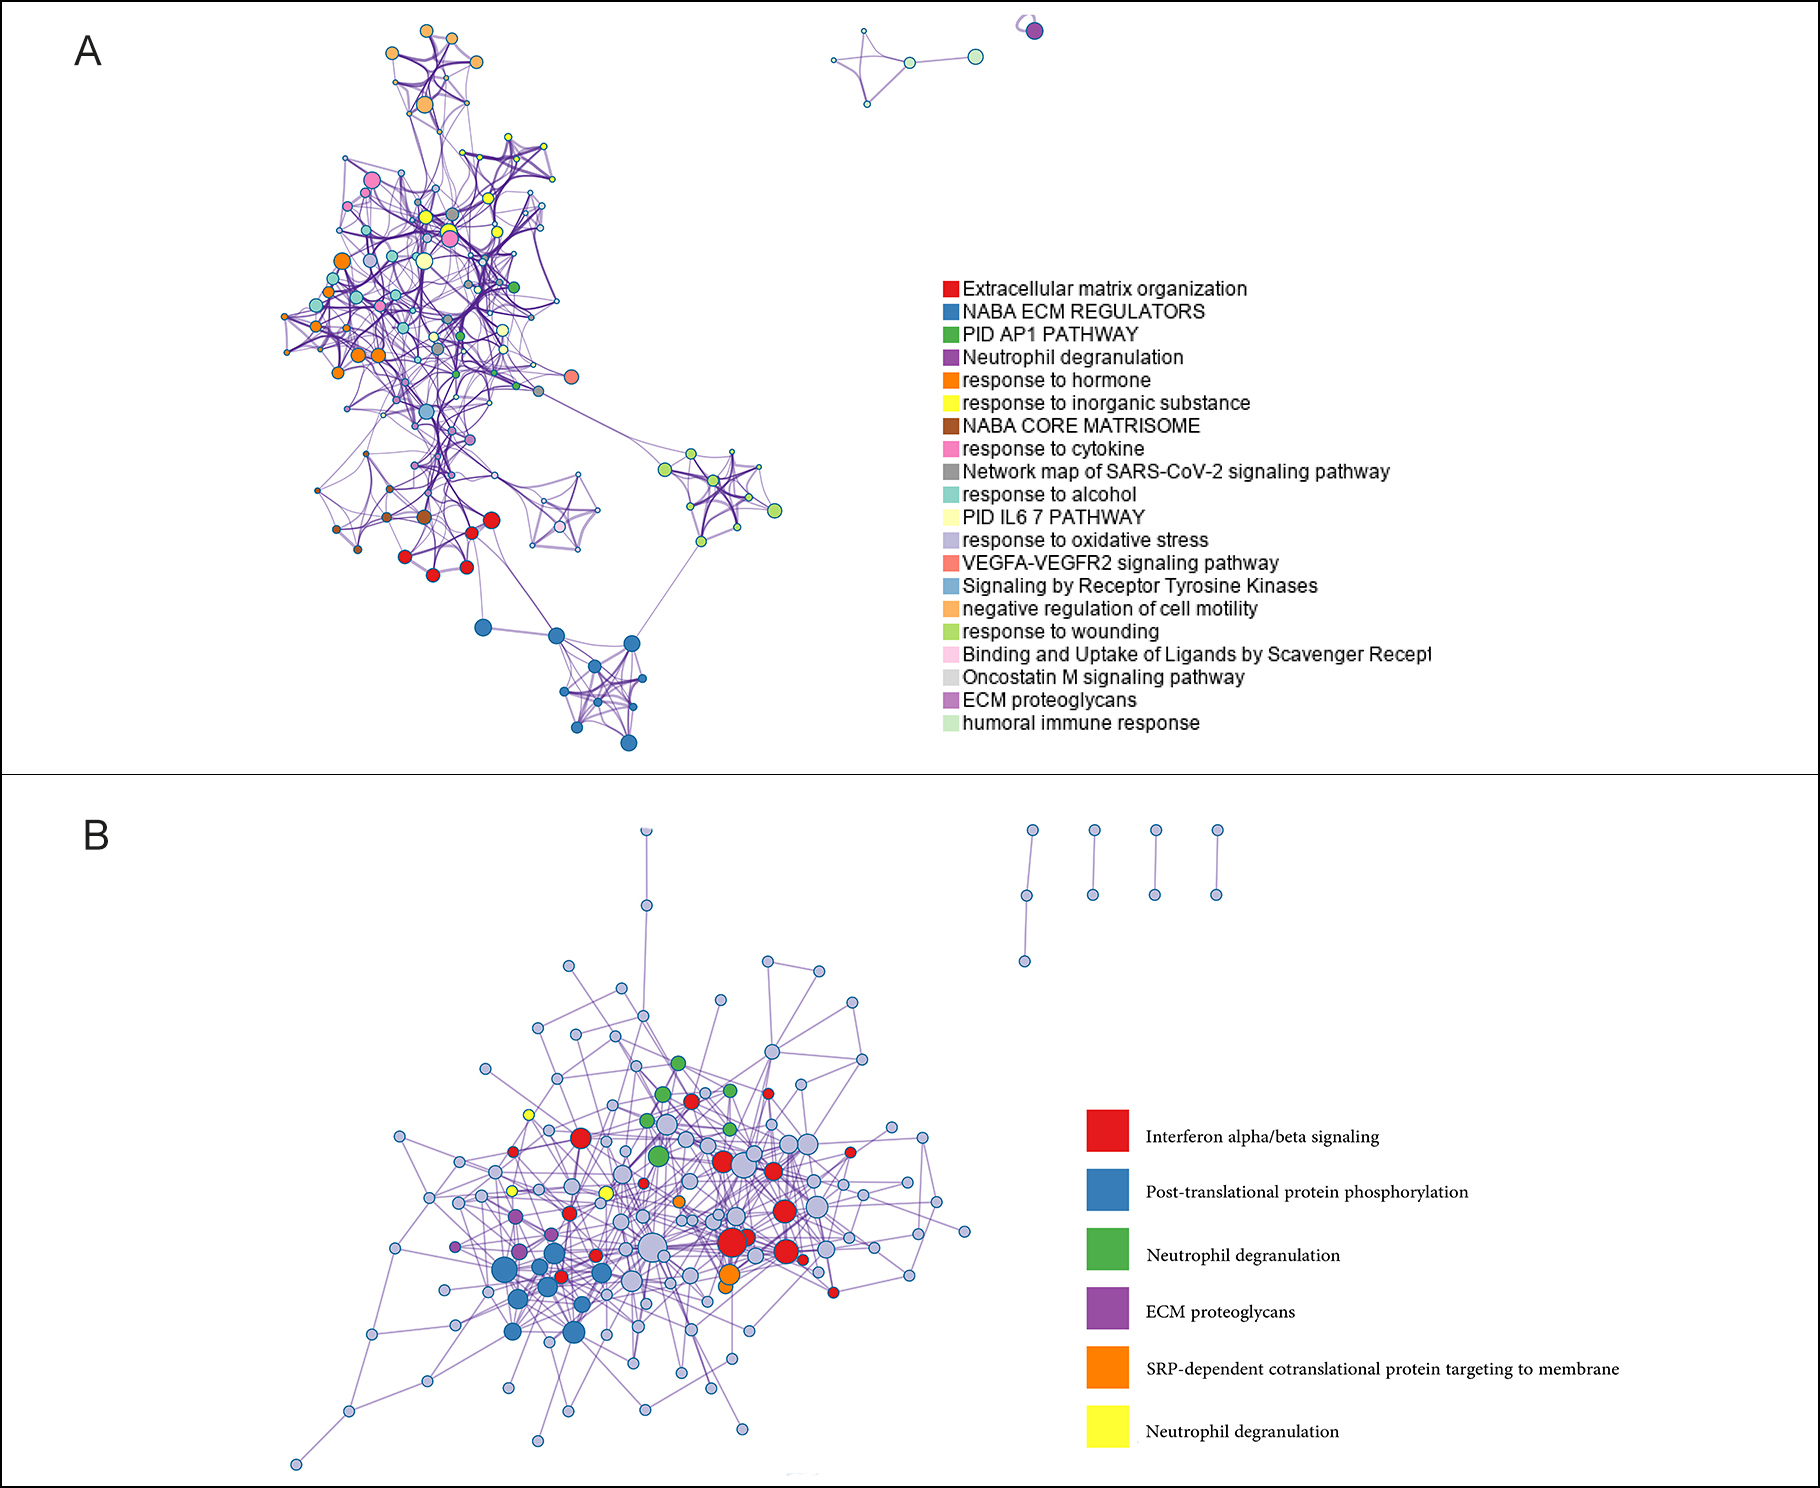 Figure 2: The Metascape analysis of DEGs. (A): The biological functions in which DEGs are enriched in CCA. (B): The pathways associated with DEGs in CCA.
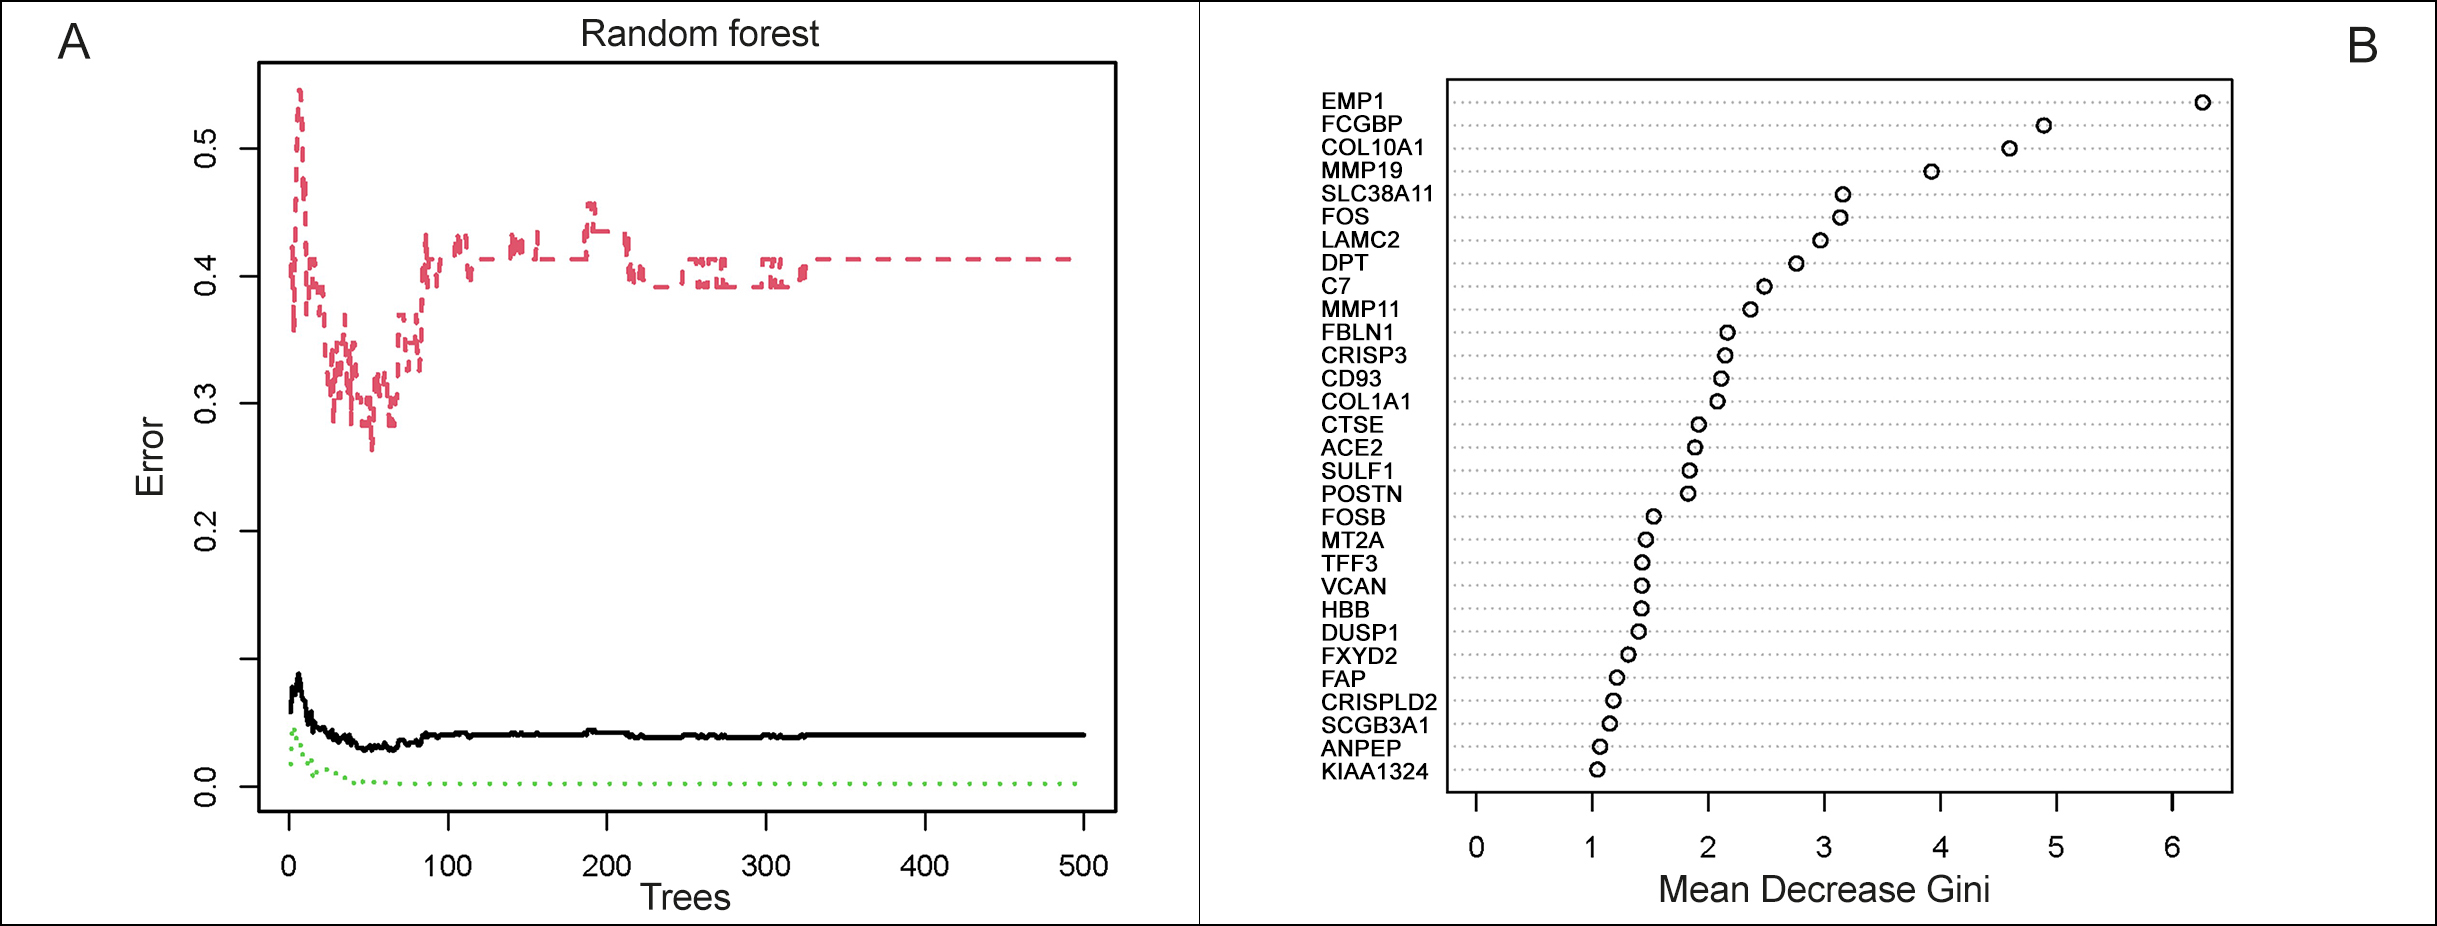 Figure 3: Selection of CCA-specific genes. (A): Construction of random forest. The x-axis represented the number of trees and the y-axis represented the cross-validation error. The three curves referred to the error of the Train cohort, Test cohort and all samples, respectively. (B): The importance score of the signature genes of CCA.
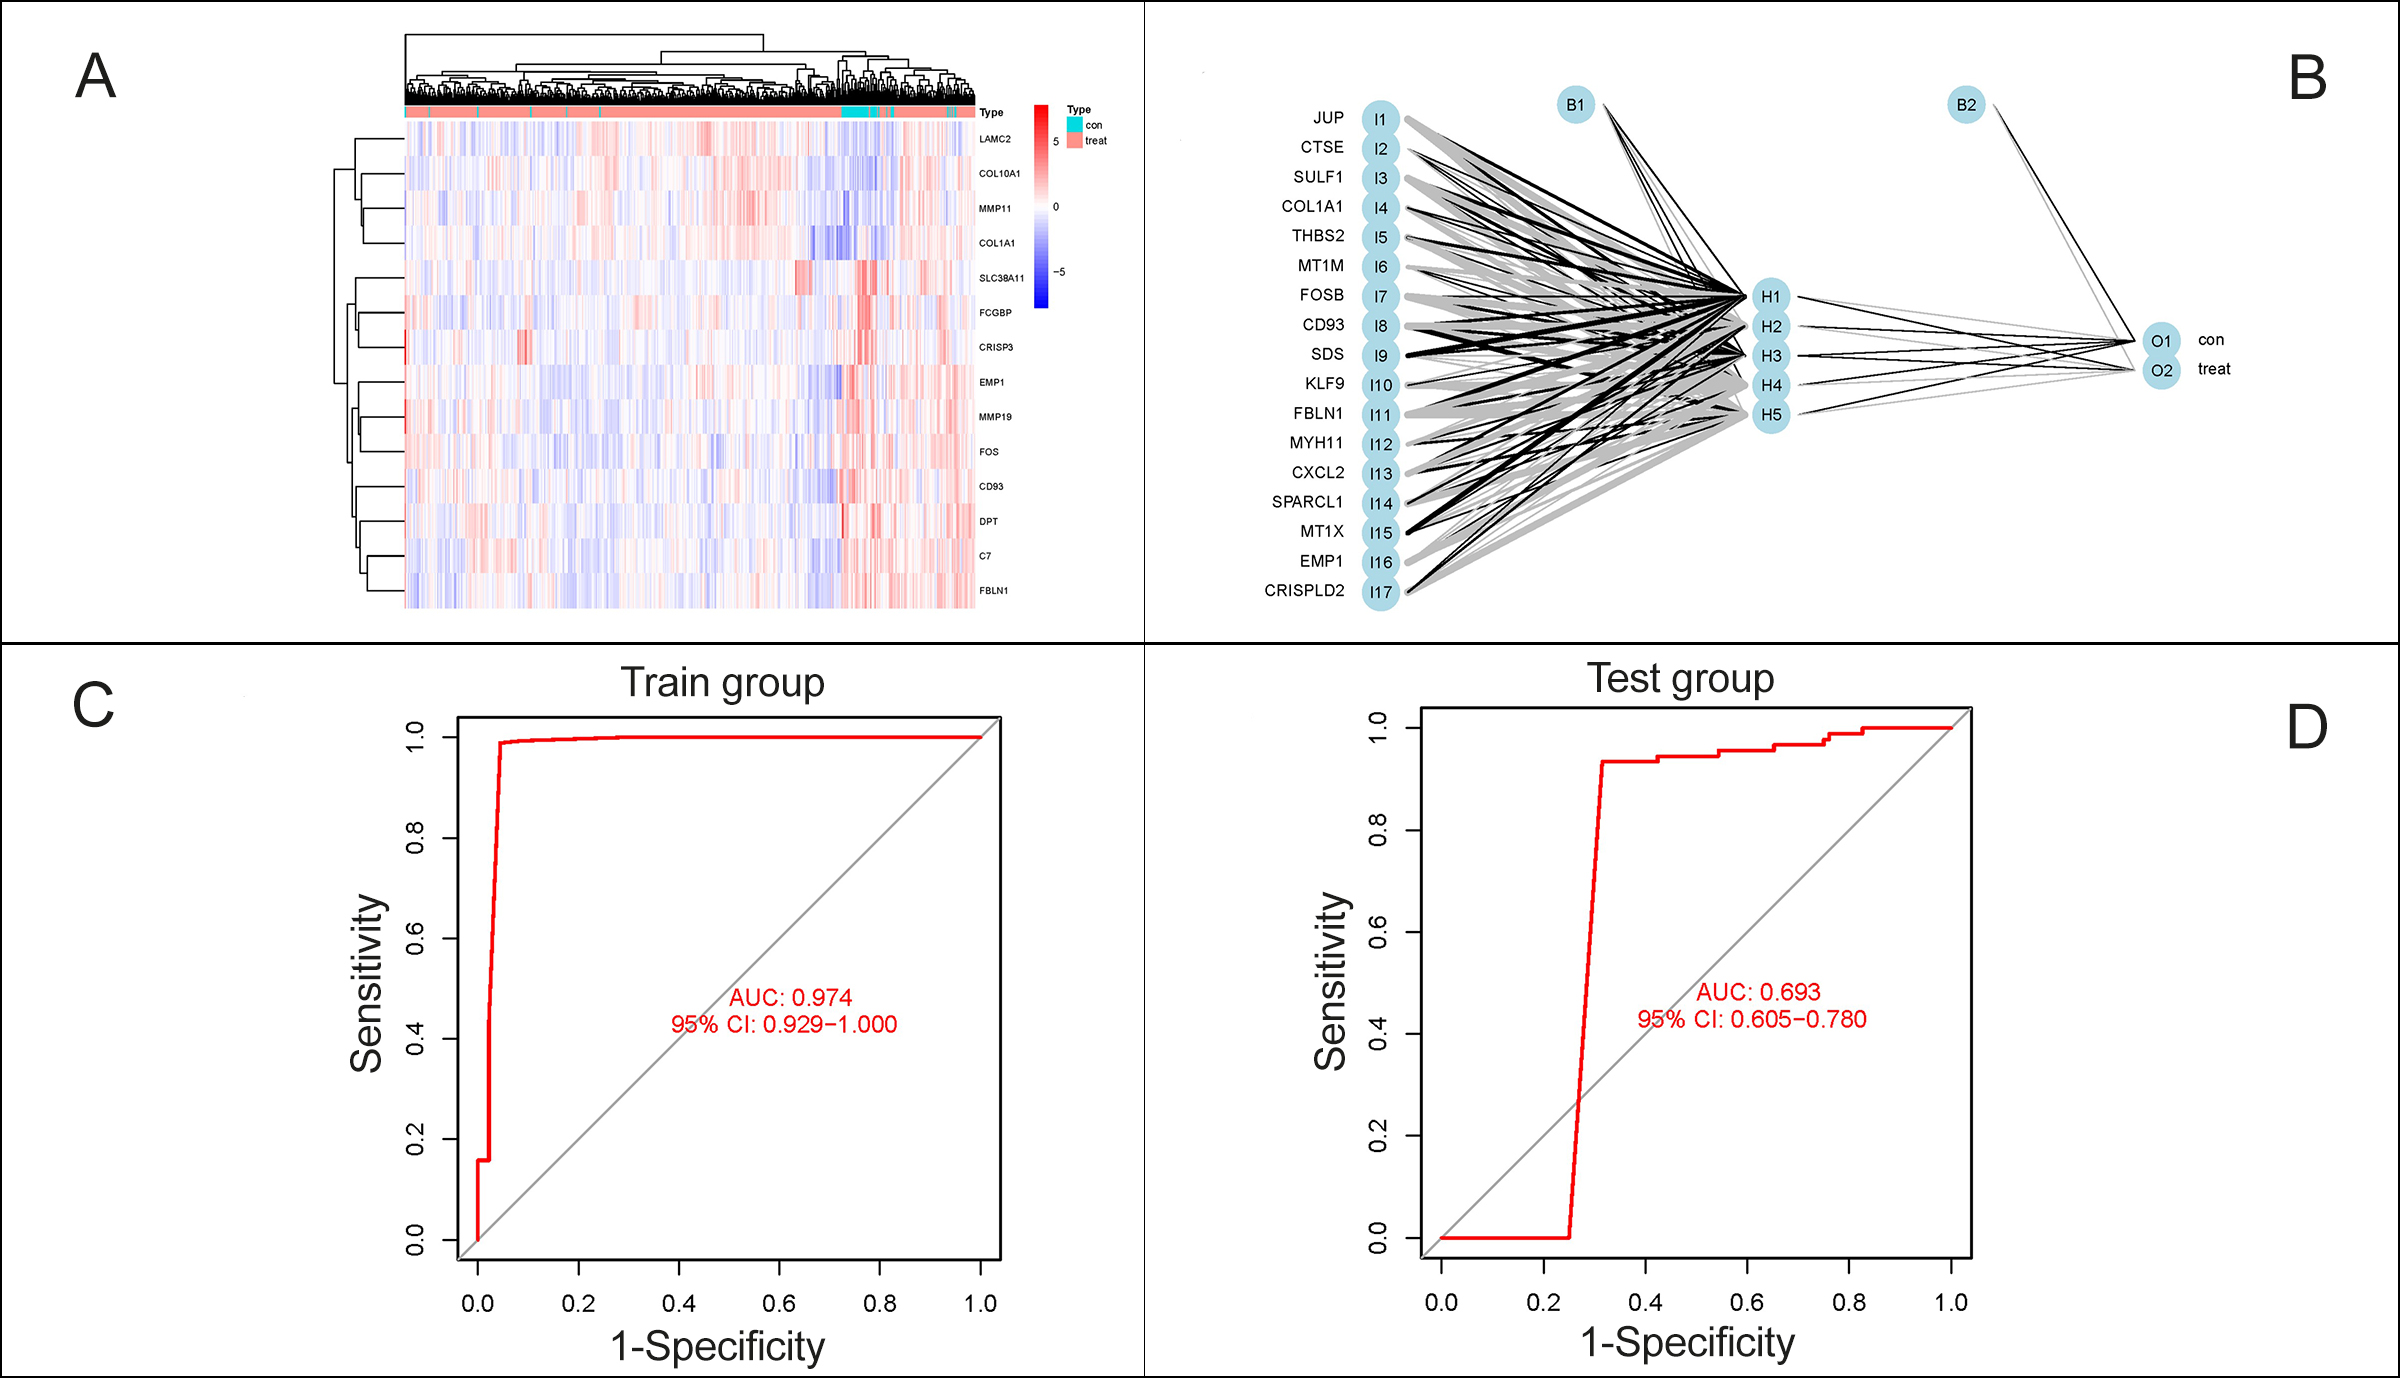 Figure 4: Construction of prediction model for CCA. (A): Heatmap of 17 characteristic DEGs. (B): A neural network prediction model based on the scores of the genes was built, including the input layer, the hidden layer and the output layer. (C-D): ROC curves were plotted and the AUCs were 0.980 in the Train group, while 0.681 in the Test group.
METHODOLOGY
This bioinformatics study was conducted from January to March 2022 at the Department of General Surgery and Anesthesiology, Zhenjiang Hospital, Zhenjiang Province, China. Initially, four available datasets (GSE26566, GSE32225, GSE89749, GSE132305) from the GEO database (https://www.ncbi.nlm.nih.gov/geo/) were obtained to construct the Train cohort. The selection criteria were diagnosed cholangiocarcinoma; Sample size >100 patients; and containing tumour samples, and normal controls. Patients with coexistent hepatocellular carcinoma were excluded. To verify the accuracy of the artificial neural network model, another dataset (GSE76297) as the Test cohort from TCGA (https://www.cancer.gov/) was also downloaded (Table I).
Table II: Prediction results of artificial neural networks.
|
|
Train Group |
Test Group |
||
|
|
Normal |
Cancer |
Normal |
Cancer |
|
Normal |
50 |
2 |
19 |
73 |
|
Cancer |
1 |
552 |
0 |
91 |
|
Normal accuracy |
0.962 |
0.207 |
||
|
Cancer accuracy |
0.998 |
1 |
||
After batch correction of the data, the R package “limma” was used to screen out the differentially expressed genes (DEGs) of CCA in the train cohort, the R package “pheatmap” to visualise heat maps and volcano maps for the differential genes. The log2 fold change ≥0.8 and adjusted p-value <0.05 were considered as statistically significant. Gene Ontology (GO) and Kyoto Encyclopedia of Genes and Genomes (KEGGs) enrichment analyses for DEGs were performed by clusterProfiler, ggplot2, and enrich plot. Bioinformatics investigations were also conducted through the Metascape website (http://metascape.org/).
Random-forest analyses were conducted to identify the disease-specific genes from DEGs. The R package randomForest was used and the parameters are set as seed=123456 and ntree=500. The identical genes achieved by the above method are recognised as characteristic genes of CCA. The limma and pheatmap packages were applied to visualise the disease signature genes with a gene importance score >1 and cluster the samples according to their expression. The purpose of genetic scoring was to remove the batch effect between the Train and Test cohort. If the gene was up-regulated and its expression was greater than the median value, it was labelled as 1, otherwise, labelled as 0. If the gene was down-regulated, the opposite pattern was used. Then an artificial neural network model could be constructed for CCA diagnosis based on the scores of the genes by NeuralNetTools packages. This neural network consisted of 3 layers: the input layer, with the scores of genes; the hidden layers, with the scores and weights of genes; and the output layer, with the results for control and experimental samples. The seed was set as 12345678.
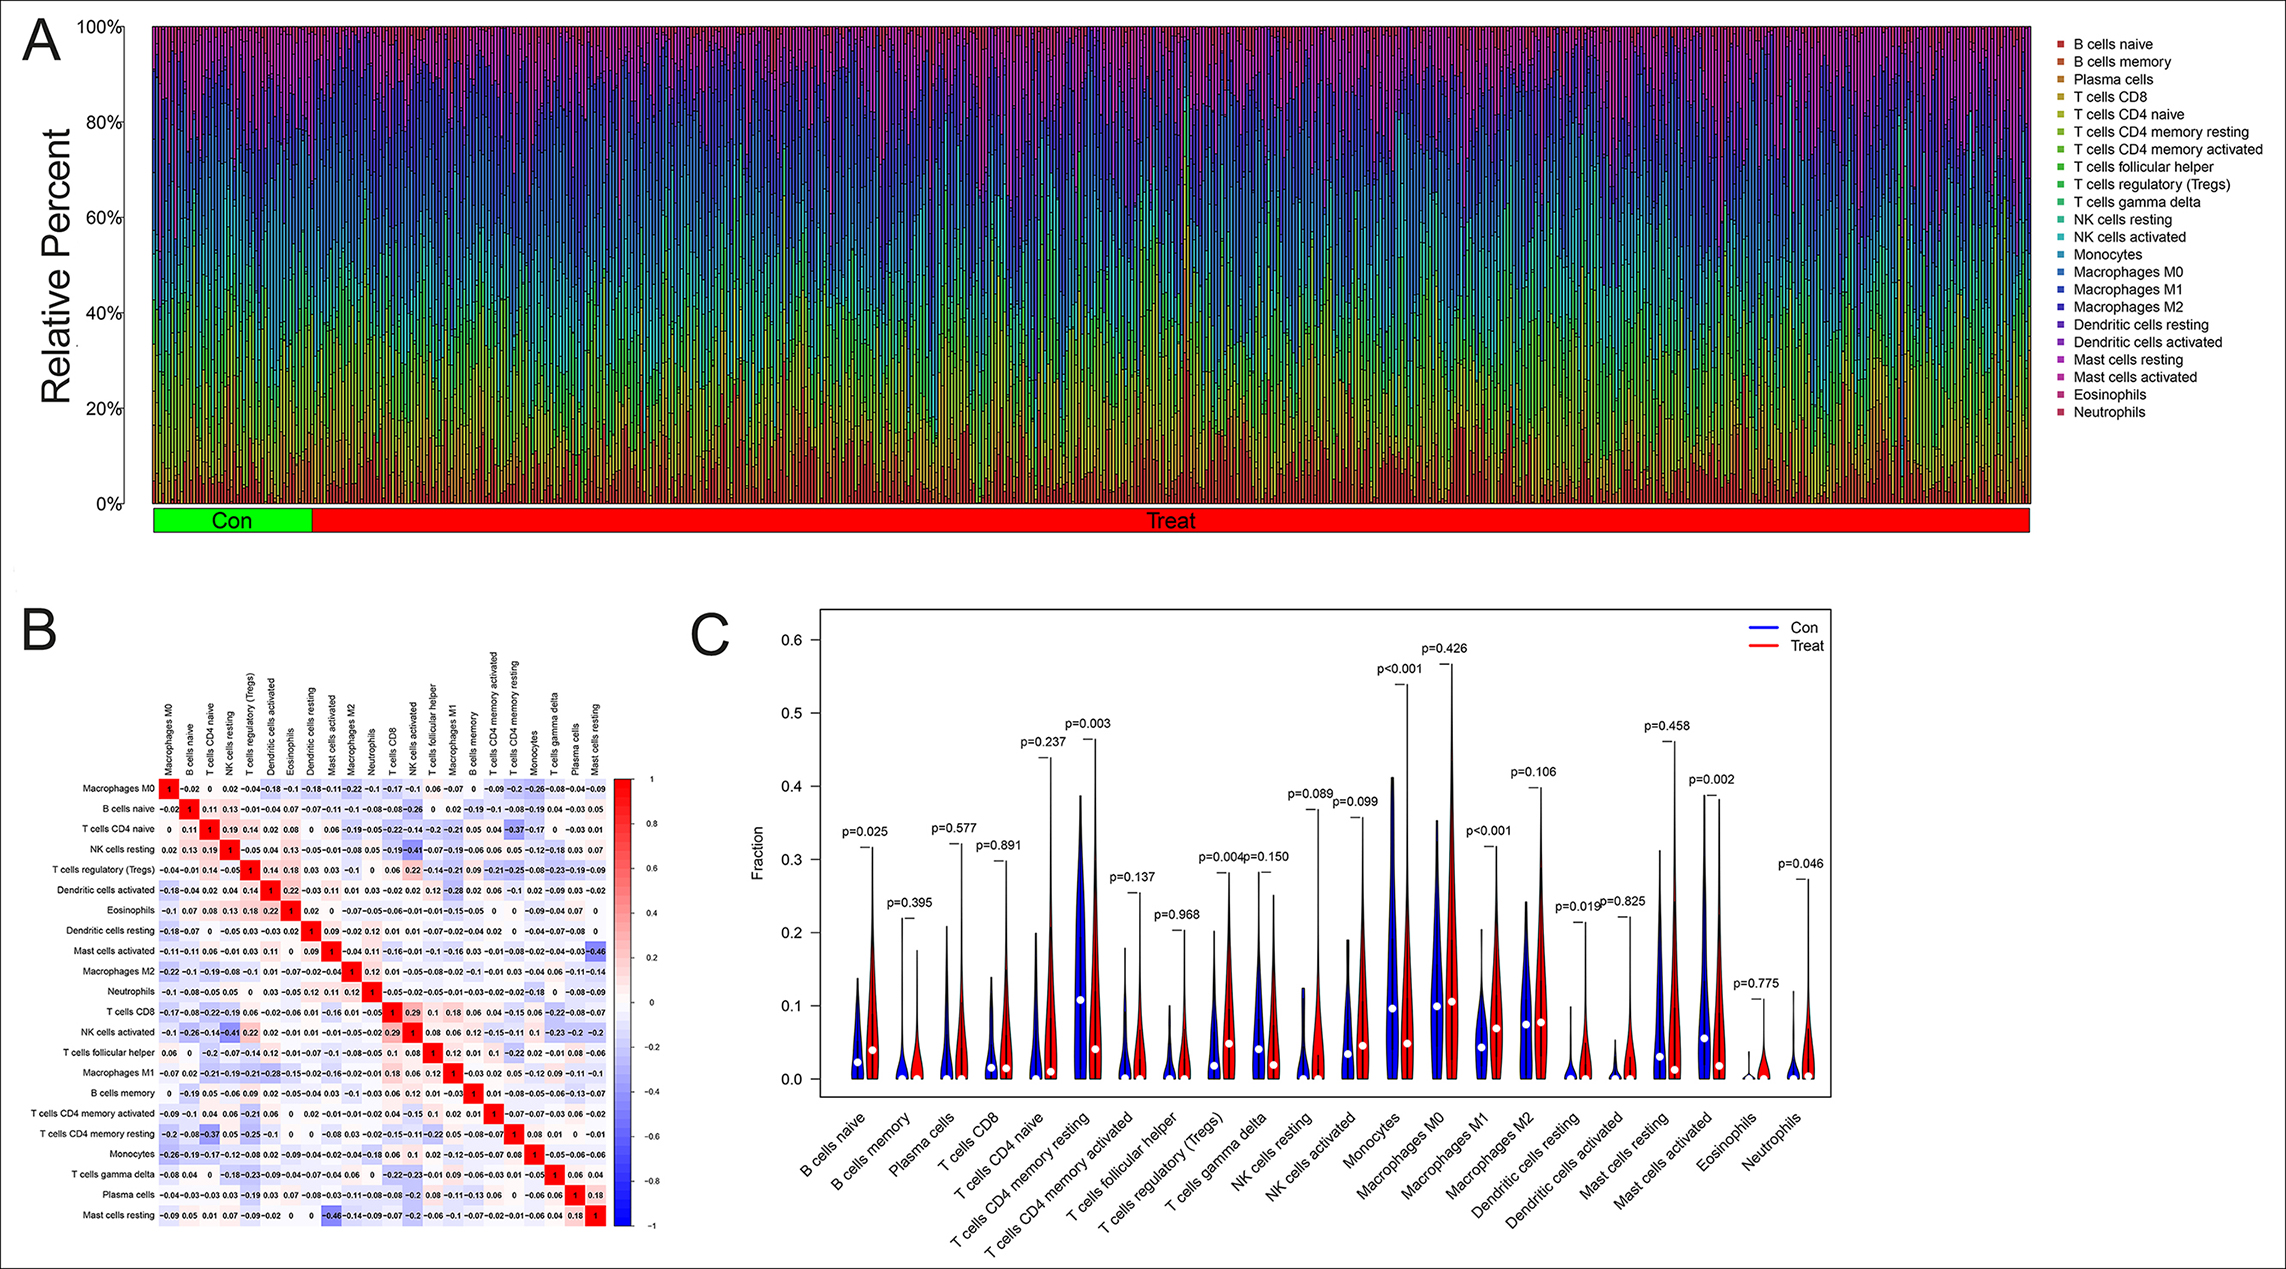 Figure 5: The analysis of immune microenvironment in CCA. (A): Histogram of 22 types of immune cells in CCA and healthy controls. The horizontal coordinate represented the sample and the vertical coordinate represented the amount of immune cells. (B): The correlation analysis between the immune cells, positive correlations were shown in red and negative correlations were shown in blue. (C): The analysis of immune cells differences in the tumour microenvironment of CCA.
The accuracy and efficiency of the artificial neural network model for CCA were evaluated by plotting receiver operating characteristic (ROC) curve using the pROC package. In this ROC curve, the horizontal coordinate represents the false positive rate, represented by 1-Specificity, and the vertical coordinate represents the true positive rate, represented by Sensitivity. The area under the ROC curve (AUC) was assessed for the diagnostic model.
Next an analysis of immune cell infiltration was performed. A total of 22 immune cells were identified by the CIBERSORT algorithm and screened using the R packages e1071, preprocess Core, and CIBERSORT.R. At last, the study also measured the distribution of the immune cells between the Train cohort and Test cohort using vioplot. All the p-values less than 0.05 were considered statistically significant.
RESULTS
As shown in Figures 1A-1B, the analysis revealed 166 differential genes between CCA and normal tissue in the Train group. The heat map and the volcano map showed a good visual indication of 68 up-regulated and 98 down-regulated. The study performed GO and KEGG analysis on these DEGs and the GO terms revealed that the DEGs were mainly concentrated in the extracellular matrix organisation and neutrophil activation (Figure 1C). KEGG enrichment analysis demonstrated that these genes were enriched in the human papillomavirus infection, coronavirus disease, and human T-cell leukaemia virus 1 infection (Figure 1D). These results indicated a strong correlation with the immune microenvironment.
By measuring the Metascape, we could visualise which functions and pathways were enriched by the differential genes in a network diagram like Figure 2A. The nodes represented functions or pathways which meant the similarity between the two nodes was relatively high, if the two nodes were connected. The NABA_CORE_MATRISOME gene set contained many genes encoding extracellular matrix organization and response to cytokine in EC, while the NABA_ECM_REGULATORS gene set contained genes encoding PID AP1 pathway, neutrophil degranulation, and response to hormone. The related pathways were interferon alpha/beta signalling, post-translational protein phosphorylation and neutrophil degranulation (Figure 2B).
The random-forest algorithm could be applied for selecting the DEGs. As shown in Figure 3A, the x-axis represented the number of trees and the y-axis represented the cross-validation error. The three curves referred to the error of the Train cohort (red), Test cohort (green), and all samples (black), respectively. Figure 3B represented the importance score of the gene, and genes with a score greater than 1 were selected. After validating by paired samples from the TCGA database, a set of 17 CCA disease signature DEGs, of which 11 were upregulated (CD93, COL1A1, CRISPLD2, CTSE, EMP1, FBLN1, JUP, MYH11, SPARCL1, SULF1 and THBS2) and 6 (CXCL2, FOSB, KLF9, MT1M, MT1X, SDS) were downregulated, obtained, and applied for subsequent analysis.
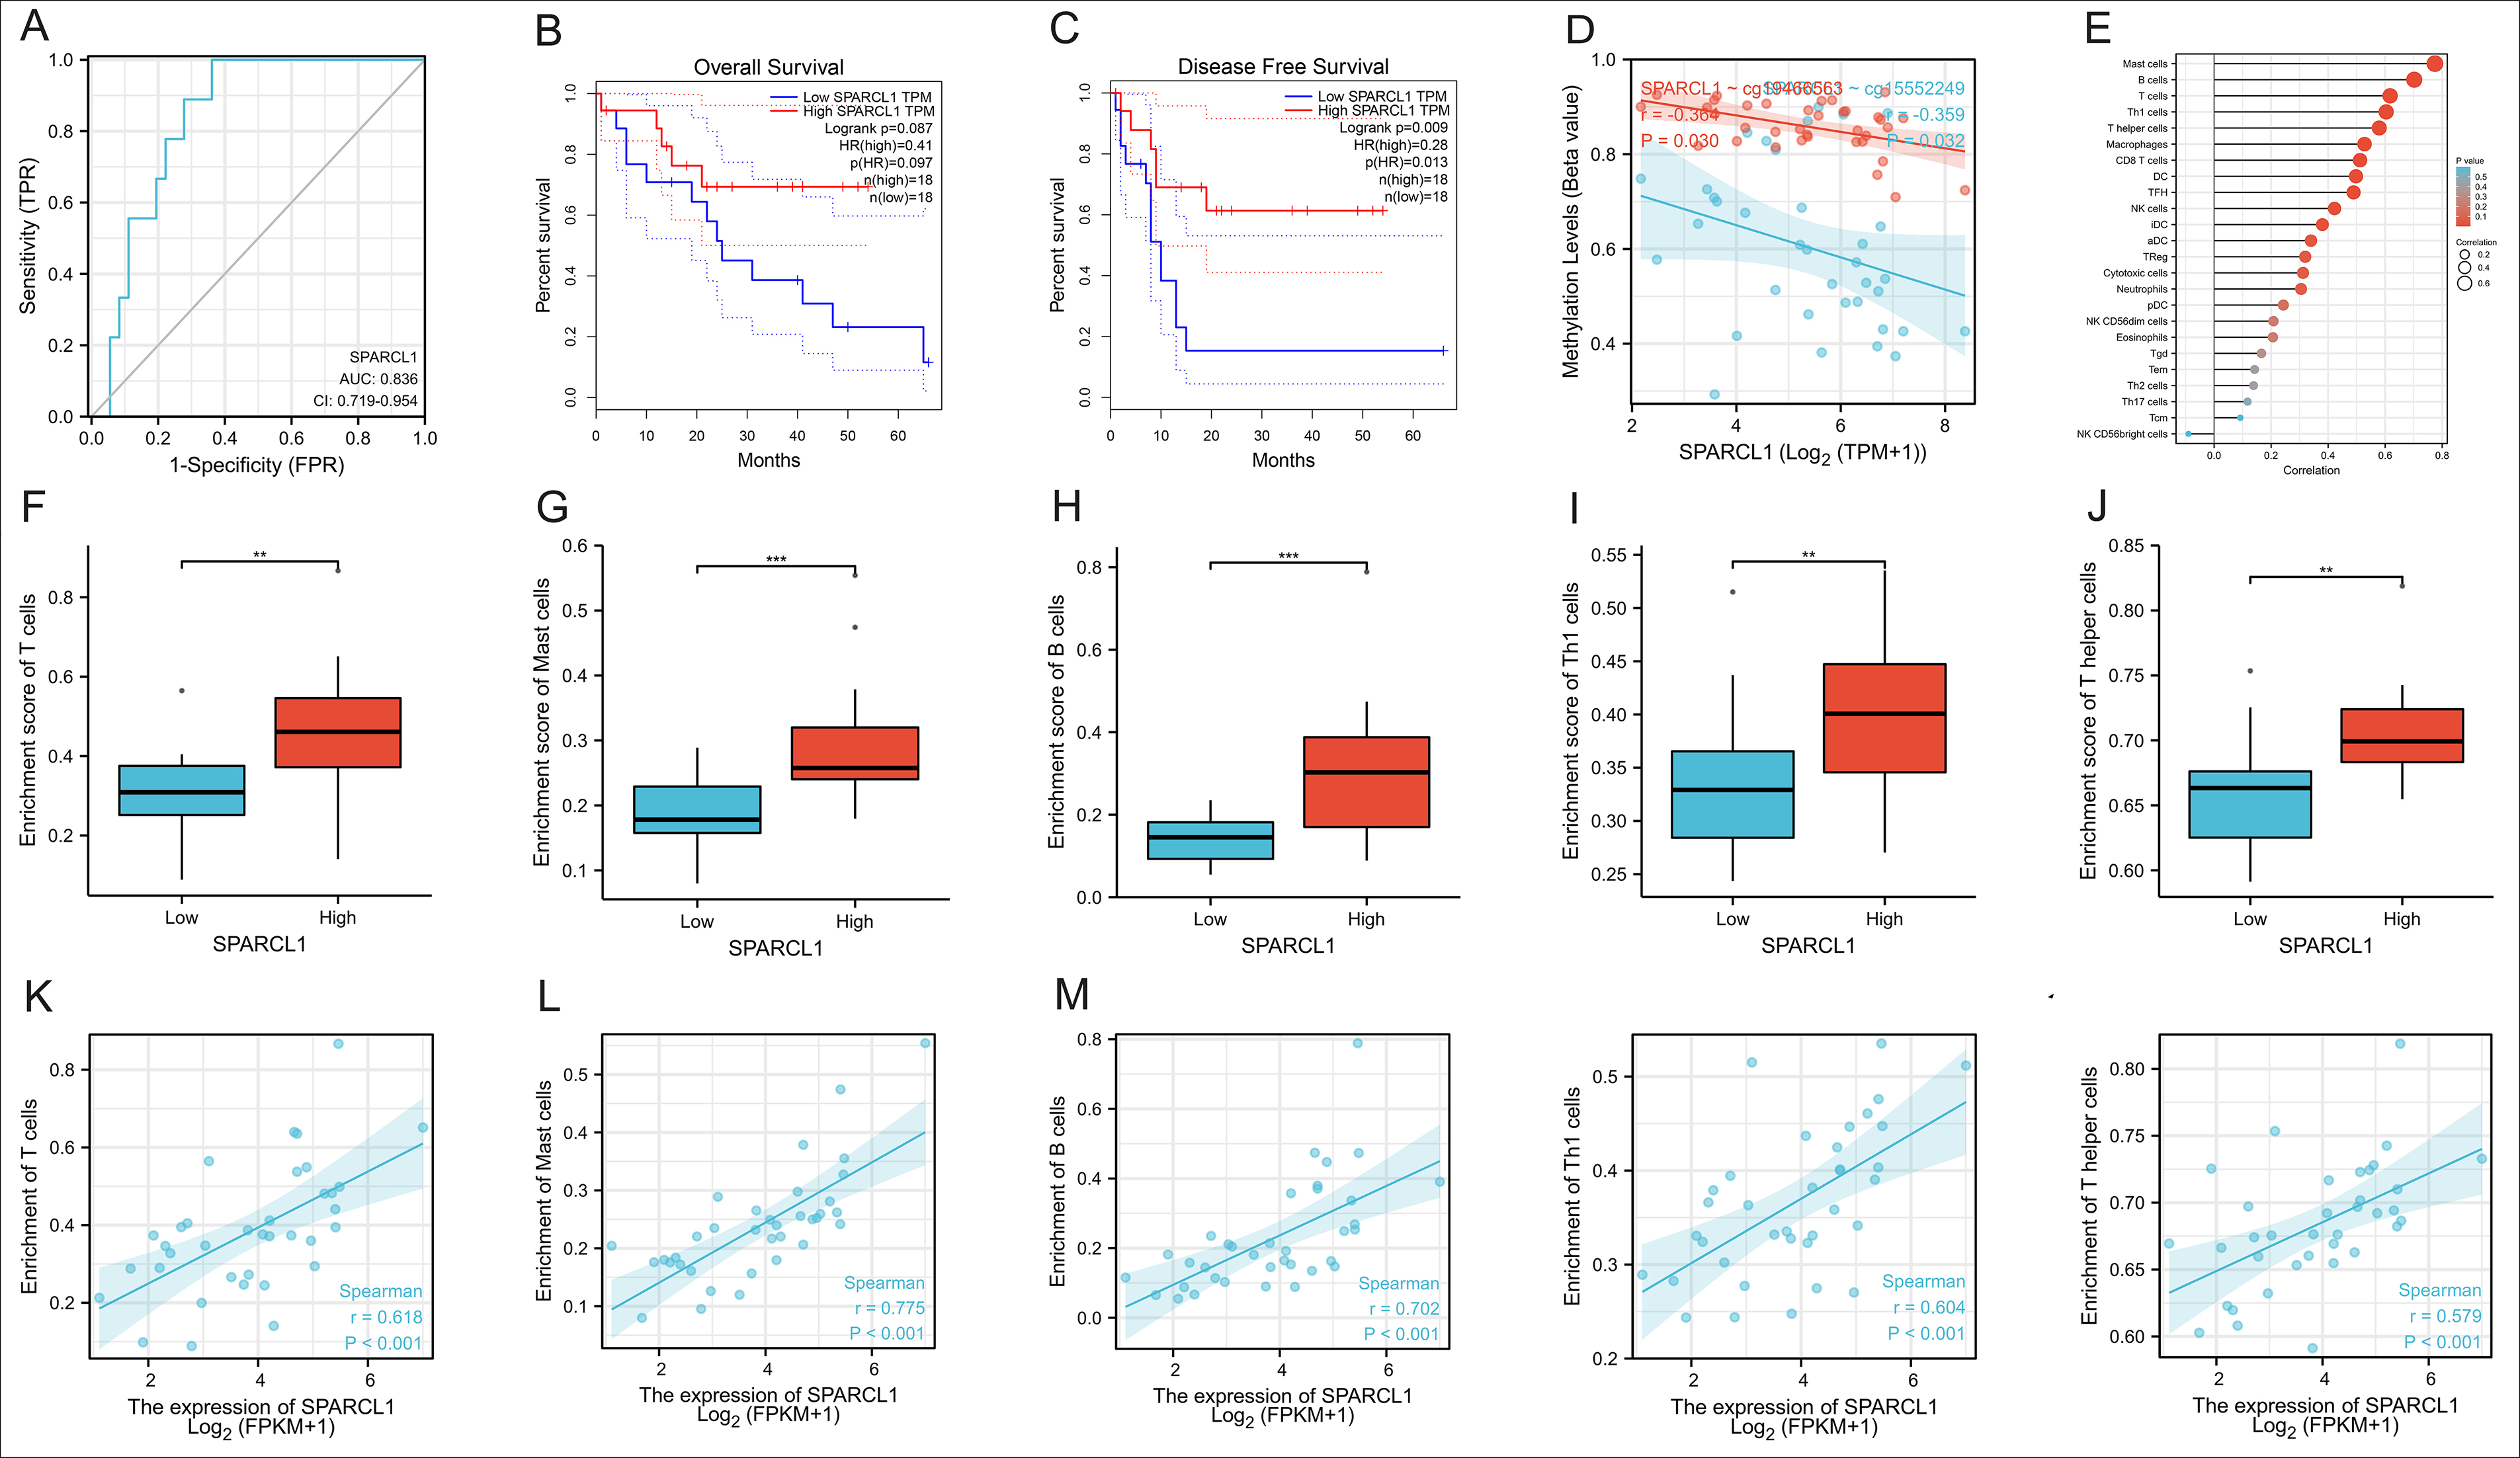 Figure 6: The analysis of function for SPARCL1 in CCA (A): The accuracy of SPARCL1 in identifying CCA by ROC curve and the AUC was 0.836. (B-C): Univariate survival analysis of SPARCL1 in CCA. (D): The correlation between the methylation level of cells and the expression of SPARCL1 (r=-0.359, p=0.032). (E): The correlation between the expression of SPARCL1 and the immune cells. (F-O): The correlation between the expression of SPARCL1 and the enrichment of the five top associated types of immune cells, and the most remarkable correlation was manifested by Mast Cells (r=0.775, p<0.001).
* Representing less than 0.05, ** Representing less than 0.01, and *** Representing less than 0.001.
The cluster diagram here in Figure 4A demonstrated that the types of samples could generally aggregate together, which meant that the expression of the pathogenic genes could distinguish between control and experimental samples. Next, a neural network prediction model was built based on the scores of the genes as Figure 4B. It could be noticed that there were 5 nodes in the hidden layer, and according to these 5 nodes and the corresponding weights, the output layer could be acquired, which was the attribute of the sample. ROC curves were plotted to predict the accuracy and specificity of neural network models in Figure 4C-4D. The larger the area under the curve, the higher the accuracy of the neural network model was. The AUCs in the Train and Test group were 0.980 and 0.681, respectively, which meant that the accuracy of the authors’ diagnosis model was extremely authentic and independent of variations of such cohort (Table II).
The histogram in Figure 5A revealed 22 categories of immunocells in each sample, the horizontal coordinate represented the sample and the vertical coordinate represented the amount of immune cells. It was noticeable that the B cells, T cells, and macrophages were relatively abundant in CCA. Figure 5B showed the results of correlation analysis after obtaining the immune cells infiltration, in which positive correlations were shown in red and negative correlations were in blue. The coefficient between T cell CD8+ and NK cells activated was the most statistically positive correlation at 0.29, while the greatest negative one appeared between Mast cells activated and Mast cells resting at -0.46. The analysis of immune cell differences in the violin plot indicates that B cells naïve (p=0.025), tregs (p=0.004) and Macrophages M1(p<0.001) were more abundant in the tumour microenvironment of CCA, while T cells CD4+ memory resting (p=0.003), Monocytes (p<0.001), Dendritic cells resting (p=0.019), Mast cells activated (p=0.002) and Neutrophils (p=0.046) were less extensive with statistically significant differences (Figure 5C).
The extracellular matrix (ECM) is known to regulate tissue development and cell morphology, movement, and differentiation. SPARCL1 is an ECM protein, hence finally the authors performed a series of functional analyses on SPARCL1, one of the 17 DEGs, to determine its role in CCA. The accuracy of SPARCL1 in identifying CCA was evaluated by ROC curve and the AUC was 0.836 (Figure 6A, CI:0.719-0.954). In Figure 6B-6C, univariate survival analysis demonstrated that SPARCL1 could affect CCA as a protective factor on disease-free survival (DFS, p=0.009), but no statistically significant differences on overall survival (OS, p=0.087). As shown in Figure 6D, the methylation level of cells and the expression of SPARCL1 were inversely correlated in CCA (r=-0.359, p=0.032), and the immune cells most closely associated with SPARCL1 were Mast cells, B cells, T cells, Th1 cells and T helper cells (Figure 6E). Then the correlation between the expression of SPARCL and the enrichment of these top five types of immune cells were analysed. It was discovered that the expression of SPARCL in CCA was positively correlated with the degree of infiltration of these five immune cells significantly, and the most remarkable correlation was manifested by Mast Cells (r=0.775, p<0.001, Figure 6F-6O). Therefore it was rational to conclude that SPARCL could provide an independent prediction of prognosis in CCA patients, and most likely through the modulation of the tumour immune-related microenvironment
DISCUSSION
A significant amount of clinical research has been conducted both in China and abroad in order to develop new treatment strategies for cholangiocarcinoma (CCA) and improve patient prognosis. Immunotherapy has recently gained attention as a potential treatment modality due to the role of the immune microenvironment in tumourigenesis and development. Studies have shown that CCA cells can create a favourable environment by secreting tumour-related regulatory mediators through the extracellular matrix and stromal cells, thus, promoting the proliferation of tumour cells and enhancing their resistance to treatment.13 Therefore, it is crucial to understand the mechanisms underlying the influence of the tumour microenvironment on the development of CCA.
In this study, machine learning identified 17 differentially expressed genes (DEGs) in CCA, of which 11 were upregulated (CD93, COL1A1, CRISPLD2, CESE, EMP1, FBLN1, JUP, MYH11, SPARCL1, SULF1 and THBS2) and 6 (CXCL2, FOSB, KLF9, MT1M, MT1X, SDS) were downregulated. An artificial neural network (ANN) was then used to construct a diagnostic model, which exhibited significantly higher accuracy and specificity (0.980) for diagnosing predicted CCA than other published computer models, such as lncRNA signature,14 and multi-mRNA signature.15 This ANN model proved to be an excellent way to classify patients with different survival outcomes in CCA. Functional enrichment analysis of the DEGs suggested SPARCL1 performed very well in predicting 5-year recurrence in CCA patients and exhibited a strong association with immune cell infiltration in CCA, which could be an independent predictor of survival prognosis, providing novel insights into the molecular mechanisms of CCA tumorigenesis and development.
The occurrence of most CCA is closely related to a chronic inflammatory state of the biliary system, resulting in the formation of a pro-cancer microenvironment. Tumour-associated macrophage (TAMs) is an important component of the tumour immune microenvironment and predominantly of the M2 type in CCA, promoting tumour growth and immunosuppression.16,17 TAMs can also inhibit the anti-tumour function of cytotoxic lymphocytes by promoting the expression of programmed cell death receptor-ligand 1 (PD-L1). In addition to this, lots of crucial cytokines are secreted by TAM, such as vascular endothelial growth factor A, angiopoietin, and Wnt protein, which promote angiogenesis and tumour cell growth.18 In the CCA microenvironment, there is also a large number of regulatory T lymphocytes (Tregs) that suppress the anti-tumour effects of the natural killer cells and cytotoxic T lymphocytes by secreting IL-10 and TGFβ1. Treg can also overexpress cytotoxic T lymphocyte-associated antigen 4 (CTLA4), and high expression of the CTLA4/CD80 pathway may promote immune escape and therapeutic resistance in CCA cells.19 This data revealed that B cells, macrophages and tregs were abundant in CCA in the sample analysed, consistent with the previous results and confirm the accuracy and reliability. Furthermore, the DEGs enrichment analysis showed that the biological functions involved include extracellular matrix (ECM) organisation. CCA cells are physically protected from immune attack by the dense extracellular matrix that surrounds them, and can physically evade immune attack by interfering with T cell migration through the dense extracellular matrix.20 Therefore, the role of ECM-related proteins in CCA is crucial and deserves attention.
SPARCL1, an ECM protein, is one of the DEGs identified in this study and has recently been found to be closely associated with tumorigenesis as a potential oncogene. SPARC-like protein 1 (SPARCL1) is a member of the family of acidic and cysteine-rich secreted proteins (SPARC, osteointegrin or BM40) and has been proven to regulate biological processes such as cell proliferation, anti-cell adhesion and tissue repair.21 Recent studies have shown that SPARC influences the differentiation of human muscle cells by regulating cytoskeletal remodelling.22 In tumour-related area, SPARCL1 can regulate tumour microenvironment-dependent endothelial cell heterogeneity in colorectal cancer.23 Additionally, it has been shown that SPARCL1 highly correlates with stromal score, immune score, and ESTIMATE score,24 and in gastrointestinal mesenchymal tumours, the KDM6A-SPARCL1 axis can block metastasis and regulate the tumour, microenvironment of gastrointestinal mesenchymal tumours by inhibiting nuclear translocation of p65.25 However, the role of SPARCL1 in CCA is still unclear. In this study, bioinformatics analysis revealed that SPARCL1 expression in CCA was closely and positively correlated with the infiltration of various immune cells, mainly B cells, T cells, MAST cells, and so on. It is suggested that SPARCL1 may influence the prognosis of patients by affecting the CCA tumour microenvironment. Although further basic experiments and clinical patient information are needed for validation, SPARCL1 is also expected to be a novel prognostic biomarker in CCA related to the tumour immune microenvironment.
There are several limitations in this study that ought to be considered. For example, the risk assessment model was constructed entirely based on the original dataset of GEO, but it was not validated with clinical samples and lacked clinical evidence. In addition, this risk model can only be used as a biomarker for predicting survival outcomes and tumour microenvironment in CCA, while failing to discover the specific biological functions of the individual genes involved in the model, which still needs further validation and exploration by bioinformatics, basic experiments and clinical data.
CONCLUSION
In summary, this study has constructed an accurate prediction model for CCA using artificial neural networks, random forests, and other such methods in the field of bioinformatics analysis. Moreover, the findings suggest that targeting ECM-related proteins such as SPARCL1 could be a promising strategy for improving the efficacy of immunotherapy in CCA patients. The results are of great significance for the precise diagnosis and individualised microenvironment of CCA in future.
ETHICAL APPROVAL
This study has been approved by Ethical Committee in Zhejiang Hospital (No. 2022-CA-16).
COMPETING INTEREST:
The authors declared no competing interest.
AUTHORS’ CONTRIBUTION:
JQ: Conception and design.
JL: Collection and assembling of data.
JL, JQ: Data analysis and interpretation.
CM, BL, MZ: Manuscript writing.
All authors have approved the final version of the manuscript to be published.
REFERENCES
- Banales JM, Marin JJG, Lamarca A, Rodrigues PM, Khan SA, Roberts LR, et al. Cholangiocarcinoma 2020: The next horizon in mechanisms and management. Nat Rev Gastroenterol Hepatol 2020; 17(9):557-88. doi: 10.1038/ s41575- 020-0310-z.
- Bertuccio P, Malvezzi M, Carioli G, Hashim D, Boffetta P, El-Serag HB, et al. Global trends in mortality from intrahepatic and extrahepatic cholangiocarcinoma. J Hepatol 2019; 71(1):104-14. doi: 10.1016/j.jhep.2019.03.013.
- Rizvi S, Khan SA, Hallemeier CL, Kelley RK, Gores GJ. Cholangiocarcinoma - evolving concepts and therapeutic strategies. Nat Rev Clin Oncol 2018; 15(2):95-111. doi: 10.1038/nrclinonc.2017.157.
- Cillo U, Fondevila C, Donadon M, Gringeri E, Mocchegiani F, Schlitt HJ, et al. Surgery for cholangiocarcinoma. Liver Int 2019; 39 Suppl 1:143-55. doi: 10.1111/liv.14089.
- Blechacz B. Cholangiocarcinoma: Current knowledge and new developments. Gut Liver 2017; 11(1):13-26. doi: 10. 5009/gnl15568.
- Goecks J, Jalili V, Heiser LM, Gray JW. How machine learning will transform biomedicine. Cell 2020; 181(1):92-101. doi: 10.1016/j.cell.2020.03.022.
- Shimizu H, Nakayama KI. Artificial intelligence in oncology. Cancer Sci 2020; 111(5):1452-60. doi: 10.1111/cas.14377.
- Auslander N, Wolf YI, Koonin EV. In silico learning of tumor evolution through mutational time series. Proc Natl Acad Sci U S A 2019; 116(19):9501-10. doi: 10.1073/pnas.190 1695116.
- Murciano-Goroff YR, Taylor BS, Hyman DM, Schram AM. Toward a more precise future for oncology. Cancer Cell 2020; 37(4):431-42. doi: 10.1016/j.ccell.2020.03.014.
- Hirasawa T, Aoyama K, Tanimoto T, Ishihara S, Shichijo S, Ozawa T, et al. Application of artificial intelligence using a convolutional neural network for detecting gastric cancer in endoscopic images. Gastric Cancer 2018; 21(4):653-60. doi: 10.1007/s10120-018-0793-2.
- Choudhury A, Perumalla S. Detecting breast cancer using artificial intelligence: Convolutional neural network. Technol Health Care 2021; 29(1):33-43. doi: 10.3233/THC- 202226.
- Piva F, Tartari F, Giulietti M, Aiello MM, Cheng L, Lopez-Beltran A, et al. Predicting future cancer burden in the United States by artificial neural networks. Future Oncol 2021; 17(2):159-68. doi: 10.2217/fon-2020-0359.
- Salvatore V, Teti G, Focaroli S, Mazzotti MC, Mazzotti A, Falconi M. The tumor microenvironment promotes cancer progression and cell migration. Oncotarget 2017; 8(6): 9608-16. doi: 10.18632/oncotarget.14155.
- Xie X, Wang Y, Zhang S, Li J, Yu Z, Ding X, et al. A novel five-lncRNA signature panel improves high-risk survival prediction in patients with cholangiocarcinoma. Aging (Albany NY) 2021; 13(2):2959-81. doi: 10.18632/aging. 202446.
- Guo H, Cai J, Wang X, Wang B, Wang F, Li X, et al. Prognostic values of a novel multi-mRNA signature for predicting relapse of cholangiocarcinoma. Int J Biol Sci 2020; 16(5):869-81. doi: 10.7150/ijbs.38846.
- van Dalen FJ, van Stevendaal M, Fennemann FL, Verdoes M, Ilina O. Molecular repolarisation of tumour-associated macrophages. Molecules 2018; 24(1). doi: 10.3390/ molecules24010009.
- Najafi M, Hashemi Goradel N, Farhood B, Salehi E, Nashtaei MS, Khanlarkhani N, et al. Macrophage polarity in cancer: A review. J Cell Biochem 2019; 120(3):2756-65. doi: 10. 1002/jcb.27646.
- Boulter L, Guest RV, Kendall TJ, Wilson DH, Wojtacha D, Robson AJ, et al. WNT signaling drives cholangiocarcinoma growth and can be pharmacologically inhibited. J Clin Invest 2015; 125(3):1269-85. doi: 10.1172/JCI76452.
- Vivier E, Ugolini S, Blaise D, Chabannon C, Brossay L. Targeting natural killer cells and natural killer T cells in cancer. Nat Rev Immunol 2012; 12(4):239-52. doi: 10. 1038/nri3174.
- Joyce JA, Fearon DT. T cell exclusion, immune privilege, and the tumor microenvironment. Science 2015; 348 (6230): 74-80. doi: 10.1126/science.aaa6204.
- Chetty C, Dontula R, Ganji PN, Gujrati M, Lakka SS. SPARC expression induces cell cycle arrest via STAT3 signaling pathway in medulloblastoma cells. Biochem Biophys Res Commun 2012; 417(2):874-9. doi: 10.1016/j.bbrc.2011. 12.065.
- Jorgensen LH, Jepsen PL, Boysen A, Dalgaard LB, Hvid LG, Ortenblad N, et al. SPARC interacts with actin in skeletal muscle in vitro and in vivo. Am J Pathol 2017; 187(2): 457-74. doi: 10.1016/j.ajpath.2016.10.013.
- Naschberger E, Liebl A, Schellerer VS, Schutz M, Britzen-Laurent N, Kolbel P, et al. Matricellular protein SPARCL1 regulates tumour microenvironment-dependent endothelial cell heterogeneity in colorectal carcinoma. J Clin Invest 2016; 126(11):4187-204. doi: 10.1172/JCI78260.
- Zhang HP, Wu J, Liu ZF, Gao JW, Li SY. SPARCL1 is a novel prognostic biomarker and correlates with tumor microenvironment in colorectal cancer. Biomed Res Int 2022; 2022:1398268. doi: 10.1155/2022/1398268.
- Shen C, Han L, Liu B, Zhang G, Cai Z, Yin X, et al. The KDM6A-SPARCL1 axis blocks metastasis and regulates the tumour microenvironment of gastrointestinal stromal tumours by inhibiting the nuclear translocation of p65. Br J Cancer 2022; 126(10):1457-69. doi: 10.1038/s41416-022- 01728-3.