Relationship between Pleth Variability Index and the Occurrence of Hypotension during Epidural Anesthesia for Cesarean Section
By Honggang Zang, Lei Zhu, Wenjun YanAffiliations
doi: 10.29271/jcpsp.2021.06.619ABSTRACT
Objective: To determine the predictive effect of pleth variability index(PVI)before anesthesia on hypotension after epidural anesthesia in cesarean section parturient women.
Study Design: Observational study.
Place and Duration of Study: Gansu Province People's Hospital, China, from March 2019 to May 2020.
Methodology: One hundred and seven singleton parturient women, who underwent elective cesarean section, were selected. They were divided into no hypotension group (Group A) and hypotension group (Group B). Hypotension was defined as systolic blood pressure lower than 90 mmHg or >30% decrease in the mean arterial pressure. Receiver operating characteristic (ROC) curve was used to evaluate the predictive value of PVI before anesthesia and heart rate (HR) for hypotension after epidural anesthesia.
Results: After epidural anesthesia, 41 (38.32%) parturient women had hypotension. Basic values of HR and PVI before anesthesia in Group B were significantly higher than Group A (both p <0.001). The area under the ROC curve (AUC) of PVI basic value predicting hypotension was 0.824 (95% CI: 0.746-0.903, p <0.001), was greater than the AUC of HR basic value predicting hypotension, and the sensitivity and specificity of predicting hypotension were 92.7% and 66.7%, respectively.
Conclusion: The PVI and HR values before anesthesia have certain value in predicting hypotension after epidural anesthesia in cesarean section. PVI value before epidural anesthesia has more clinical significance than the HR.
Key Words: Pleth variability index (PVI, Heart rate (HR), Epidural anesthesia, Cesarean, Hypotension.
INTRODUCTION
Epidural anesthesia is an important anesthesia technique for cesarean section.1 Hypotension is a common complication of epidural anesthesia. After epidural anesthesia administration, the sensorimotor and sympathetic nerves below the waist are blocked, the abdominal and inferior vena cava is dilated, the blood volume increases, and the blood retains in the abdomen and lower limbs, resulting in relatively insufficient blood volume, which is prone to blood pressure drop and hypotension.2 Severe hypotension can cause nausea, vomiting, and even fetal distress, acidosis and other adverse reactions.3 If the occurrence of hypotension after epidural anesthesia can be predicted early, and individualised preventive measures can be used to reduce the incidence of hypotension, it is of great clinical significance.
However, currently there is no good method to predict hypotension after anesthesia, which can only be treated empirically. Therefore, it is particularly important to find an index that can accurately predict the occurrence of hypotension after epidural anesthesia in cesarean section parturient women.
Pleth variability index (PVI) is a dynamic hemodynamic index based on the variation of pulse perfusion pressure with respiratory cycle, non-invasive continuous monitoring of arterial pulse pressure, and continuous recording of pulse oxygen waveform, reflecting the relationship between intrathoracic pressure and ileocentric blood volume, and evaluating the volume status of the body.4 Research has shown that PⅥ can be useful for early prediction of hypotension following spinal anesthesia in cesarean section.5 There are few reports about the use of PVI for the prediction of hypotension in epidural anesthesia cesarean section. The purpose of this study was to explore the predictive effect of PVI before anesthesia on hypotension after epidural anesthesia in cesarean section parturient women.
METHODOLOGY
This study was approved by the Ethics Committee of Gansu Province People's Hospital, China. One hundred and seven singleton parturient women, who underwent elective cesarean section from March 2019 to May 2020, were selected. The inclusion criteria were parturient women receiving epidural anesthesia, with the American Society of Anesthesiologists (ASA) classification I or II, and the gestational weeks 37-42. The exclusion criteria were parturient women with abnormal hemoglobin before operation (hemoglobin value <100 g/L), hypertension during pregnancy, arrhythmia, body mass index (BMI) >35 Kg/m2, twin or multiple pregnancy, previous or new heart disease, preeclampsia, neurological dysfunction, diabetes, cardio-cerebrovascular or kidney diseases, known fetal abnormalities or unclear ultrasound images, systolic blood pressure (SBP) <90 mmHg. Stressed or uncooperative parturient women were also excluded. The diagnostic criteria of hypotension were "SBP < 90 mmHg"6 or "SBP or mean arterial pressure (MAP) decrease > 30% of the base value" before the fetus was taken out after local anesthetic injection into the epidural cavity, accompanied by nausea, vomiting, chest tightness, dizziness and other conscious symptoms. The parturient women with cesarean section were divided into two groups: no hypotension group (Group A) and hypotension group (Group B).
Parturient women fasted for eight hours and stopped to drink for four hours before the operation. After entering the operating room, an intravenous channel was established to infuse sodium lactate ringer's solution from the upper extremities, and oxygen was inhaled continuously with a mask at a flow rate of 2-3 L/min. Blood pressure (BP) , heart rate (HR) and blood oxygen saturation (SpO2) were routinely monitored. The right index finger was connected to the pulse oximeter, the probe was wrapped and fixed in dark, and the pulse perfusion index (PI) and PVI were continuously monitored. After entering the operating room, parturient women lay quietly on the operating table, and were asked to relieve and keep their breathing calm. Five minutes later, HR, SBP, diastolic blood pressure (DBP), MAP and PVI values were recorded as the basic values before anesthesia. After the epidural puncture was successfully performed in the intervertebral space of L1-2 or L2-3, the oblique plane of the puncture needle was rotated to the cephalic direction. After there were no blood and no fluid in the withdrawal of anesthesia puncture, cathetering for 4 cm in the direction of the head and 4 mL lidocaine 1.5% adding 1:200000 epinephrine was given as a test dose. After no adverse event was observed for 6 minutes in horizontal position, 8-10 mL of 0.5% ropivacaine hydrochloride was administrated.
After anesthesia, the parturient women were assisted by an assistant to measure BP, SBP, DBP, MAP and HR, and measure PVI in supine position immediately. The difference between each index and the basic value before anesthesia was calculated, and the maximum difference was divided by the basic value as the maximum change rate of each variable after anesthesia. The operation started 6 min later. After the fetus was taken out, oxytocin 20 U was injected into uterine muscle and 20 U was added into 100 mL saline intravenously. No sedative or analgesic was administrated before the fetus was delivered. Left oblique position was not routinely used. When supine hypotension syndrome occurred, left oblique position was taken, infusion speed was accelerated and ephedrine and atropine were used.
SPSS 25.0 statistical software was used to analyse the data. The Kolmogorov-Smirnov test or Shapiro-Wilk test was used for normality test for all measurement data. Normally distributed measurement data were expressed as mean ± standard deviation, and independent sample t test was used for comparison between the groups. Count data were expressed as n (%), and the Chi-square test was used for comparison between groups. The receiver operating characteristic (ROC) curve was used to evaluate the predictive value of PVI before anesthesia, and HR for hypotension after epidural anesthesia. The p <0.05 indicated that the difference was statistically significant.
Table I: Comparison of maternal demographic data between the two groups.
|
Parameter |
Group A (n=66) |
Group B (n=41) |
p-value |
|
Maternal age (years) |
27.73±4.43 |
26.73±4.77 |
0.275 |
|
BMI (kg/m2) |
29.16±4.66 |
29.44±5.25 |
0.770 |
|
ASA Ⅰ grade [n(%)] |
37 (56.06) |
23 (56.10) |
0.997 |
|
ASA Ⅱ grade [n(%)] |
29 (43.94) |
18 (43.90) |
0.997 |
|
Gestational age (weeks) |
39.82±1.39 |
39.45±1.08 |
0.130 |
|
Preoperative hemoglobin (g/L) |
116.31±4.06 |
115.83±3.18 |
0.503 |
|
Scarred uterus [n(%)] |
37 (56.06) |
24 (58.54) |
0.801 |
Table II: Comparison of the basic values of related indicators between the two groups.
|
Parameter |
Group A (n=66) |
Group B (n=41) |
p-value |
|
Basic values of SBP (mmHg) |
118.56±4.14 |
119.34±3.28 |
0.310 |
|
Basic values of DBP (mmHg) |
75.74±2.65 |
75.61±2.05 |
0.773 |
|
Basic values of MAP (mmHg) |
89.92±3.14 |
88.85±2.41 |
0.049 |
|
Basic values of HR (times/min) |
78.14±3.07 |
89.36±2.42 |
<0.001 |
|
Basic values of PVI (%) |
15.67±0.49 |
19.15±0.52 |
<0.001 |
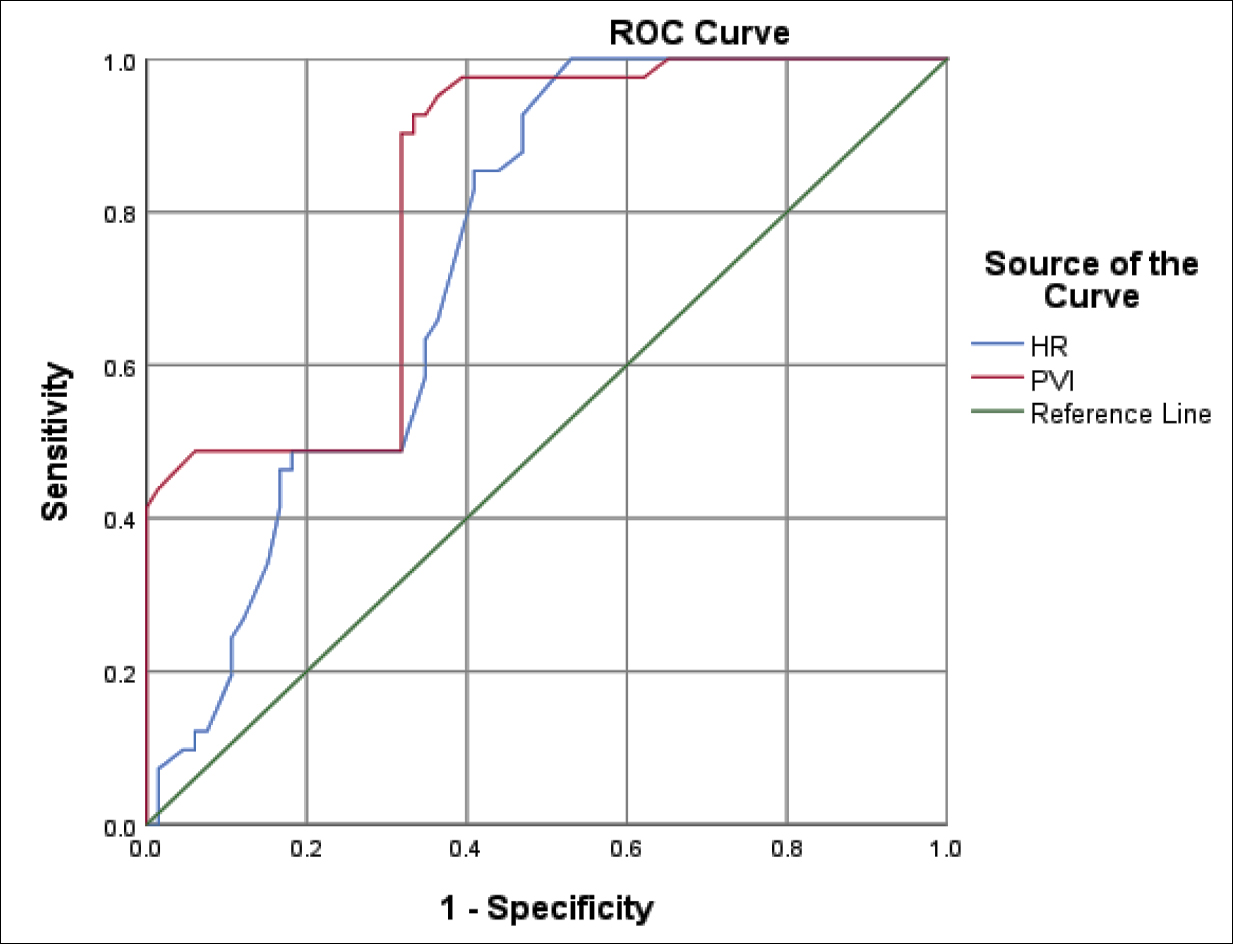 Figure 1: ROC curve of HR and PVI basic values predict hypotension before anesthesia.
RESULTS
The age of 107 singleton parturient women was 19-38 (27.32±4.59) years; 60 cases (56.07%) were of ASA I grade, and 47 (43.93%) was of ASA II grade; and gestational age was 37-42 (39.68±1.29) weeks. After epidural anesthesia, 41 parturient women (38.32%) had hypotension.
There was no significant difference between Group A and Group B in maternal age, BMI, ASA classification, gestational age, preoperative hemoglobin and scarred uterus (p=0.275, 0.770, 0.997, 0.997, 0.130, 0.503, and 0.801, respectively, Table I).
There was no statistically significant difference in the basic values of SBP and DBP before anesthesia between the two groups (p=0.310, and 0.773 respectively, Table II); the basic values of MAP,
HR and PVI before anesthesia in Group B were significantly higher than Group A (p=0.049,p<0.001, and p<0.001 respectively, Table II).
The area under the ROC curve (AUC) of HR basic value predicting hypotension was 0.743 (95% CI: 0.652-0.834, p<0.001). The optimal threshold of HR basic value for predicting hypotension was ≥79.78 beats/min, and the sensitivity and specificity of predicting hypotension were 85.4% and 59.1%, respectively, as shown in Figure 1.
The AUC of PVI basic value predicting hypotension was 0.824 (95% CI: 0.746-0.903, p<0.001). The optimal threshold of PVI basic value for predicting hypotension was ≥15.98%, and the sensitivity and specificity of predicting hypotension were 92.7% and 66.7%, respectively, as shown in Figure 1.
The AUC of PVI basic value predicting hypotension was greater than the AUC of HR basic value predicting hypotension, as shown in Figure 1.
DISCUSSION
Previous research has shown that pre‐anaesthetic heart rate may be a prognostic factor for hypotension associated with spinal anaesthesia.7 Research has also found that baseline HR might be a useful parameter to predict obstetric spinal hypotension.8 Baseline low-to-high frequency ratio of heart rate variability can predict subarachnoid hypotension of cesarean section parturient women.9
Recently, studies found that preoperative baseline HR could predict post-spinal hypotension in caesarean section patients.10 But another study found that heart rate variability was not able to reliably predict the hypotension in caesarean section preeclamptic patients receiving spinal anaesthesia.11 This study confirmed that the basic value of HR in the parturient women with hypotension after cesarean section epidural anesthesia was higher than that of the parturient women without hypotension. Analysis of the ROC curve showed that the AUC for predicting hypotension using HR basic values was 0.743. The optimal threshold of HR basic value for predicting hypotension was ≥79.78 times/min, and the sensitivity and specificity of predicting hypotension were 85.4% and 59.1%, respectively. It is, therefore, inferable that HR before anesthesia may be a prediction index in hypotension after epidural anesthesia in cesarean section.
PVI, which can more accurately predict fluid responsiveness, provides a new method for predicting hypotension after induction of anesthesia.12
PVI could serve as a non-invasive indicator to monitor the changes of intravascular volume status.13 Anesthesia-induced hypotension may be partly related to the patients' volume status. Pre-anesthesia PVI could identify high-risk patients for developing severe hypotension during anesthesia induction.14,15 Greater baseline PVI was bound up with hypotension after spinal anesthesia in cesarean section, but might not be a useful predictor for hypotension.16 The results of this study showed that the pre-anaesthesia PVI value of parturient women with hypotension was higher than that of parturient women without hypotension, which indicated that the maternal PVI value before anesthesia was related to the occurrence of hypotension after epidural anesthesia. In this study, 15.98% of PVI was the threshold for predicting the occurrence of hypotension, and its sensitivity and specificity reached 92.7% and 66.7%, respectively. The AUC of the basic value of PVI predicting hypotension after epidural anesthesia in cesarean section was 0.824, which was greater than the AUC of the basic HR value. It suggests that PVI is valuable in judging and predicting the state and change of maternal volume.
At the same time, the results of this study showed that, there was no statistically significant difference in the basic values of SBP and DBP before anesthesia between the two groups, the basic values of MAP before anesthesia in Group B were significantly higher than Group A. Above results were different from research results of Tian et al.17 Tian et al. confirmed that there was no statistically significant difference in the basic values of SBP,DBP and MAP before anesthesia between with and without hypotension in parturient women undergoing elective cesarean section under spinal anaesthesia.
However, it should be noted that factors such as the patients' anxiety before anesthesia and the operating room environment can affect the accuracy of the PI and PVI values.18,19 Therefore, reducing noise in the operating room, relieving the patients' nervousness, and maintaining a suitable temperature in the operating room to avoid cold stimulation can help keep the accuracy. In addition, this study is only a single-centre study, with a limited number of samples, thus cannot fully reflect the situation in a large population. In future, further multi-centre large-sample studies are needed to deeply explore the clinical value of PVI in predicting hypotension during epidural anesthesia in cesarean section.
CONCLUSION
HR and PVI monitorings have the advantages of low cost and non-invasiveness. The PVI value and HR, before anesthesia, have certain value in predicting hypotension after epidural anesthesia in cesarean section; and the PVI value, before epidural anesthesia, has more clinical significance than HR.
ETHICAL APPROVAL:
This study was conducted with the approval from the Ethics Committee of the Gansu Province People's Hospital.
PATIENTS’ CONSENT:
All patients signed a document of informed consent.
CONFLICT OF INTEREST:
The authors declared no conflict of interest.
AUTHORS’ CONTRIBUTION:
LZ: Interpretation of data for the work; drafting the work.
WY: Revising it critically for important intellectual content.
HZ: Revising it critically for important intellectual content; final approval of the version to be published.
REFERENCES
- Divakar SR, Singh C, Verma CM, Kulkarni CD. Cesarean section under epidural anesthesia in a documented case of ruptured aneurysm of the sinus of valsalva. J Anaesthesiol Clin Pharmacol 2015; 31(1):119-122. doi: 10.4103/ 0970-9185.150565.
- Casalino S, Mangia F, Stelian E, Novelli E, Diena M, Tesler UF. High thoracic epidural anesthesia in cardiac surgery: Risk factors for arterial hypotension. Tex Heart Inst J 2006; 33(2):148-53.
- Jendoubi A, Khalloufi A, Nasri O, Abbes A , Ghedira S, Houissa M. Analgesia nociception index as a tool to predict hypotension after spinal anaesthesia for elective caesarean section. J Obstet Gynaecol 2021; 41(2):193-99. doi:10.1080/01443615.2020.1718624.
- Kim DH, Shin S, Kim JY, Kim SH, Jo M, Choi YS. Pulse pressure variation and pleth variability index as predictors of fluid responsiveness in patients undergoing spinal surgery in the prone position. Ther Clin Risk Mana 2018; 14:1175-83. doi: 10.2147/TCRM.S170395.
- Mallawaarachchi RP, Pinto V, De Silva PH. Perfusion index as an early predictor of hypotension following spinal anesthesia for cesarean section. J Obstet Anaesth Crit Care 2020; 10:38-41.
- Fuller G, Hasler RM, Mealing N, Lawrence T, Wood ford M, Juni P, et al. The association between admission systolic blood pressure and mortality in significant traumatic brain injury: A multi-centre cohort study. Injury 2013; 45(3): 612-7. doi: 10.1016/j.injury.2013.09.008
- Yokose M, Mihara T, Sugawara Y, Goto T. The predictive ability of non-invasive haemodynamic parameters for hypotension during caesarean section: A prospective observational study. Anaesthesia 2015; 70(5):555-62. doi: 10.1111/anae.12992.
- Frölich MA, Caton D. Baseline heart rate may predict hypotension after spinal anesthesia in prehydrated obstetrical patients. Can J Anesth 2002; 49(2): 185-9. doi: 10.1007/BF03020493.
- Hanss R, Bein B, Francksen H, Scherkl W, Bauer M, Doerges V, et al. Heart rate variability-guided prophylactic treatment of severe hypotension after subarachnoid block for elective cesarean delivery. Anesthesiology 2006; 104(4):635-43. doi: 10.1097/00000542-200604000-00005.
- Joshi MC, Raghu K, Rajaram G, Nikhil N, Kumar S, Singh A. Baseline heart rate as a predictor of post-spinal hypotension in patients undergoing a caesarean section: An observational study. J Obstet Anaesth Crit Care 2018; 8(1):20-3. doi: 10.4103/joacc.JOACC_56_17.
- Shehata JH, Sakka AIE, Omran A, Mahmoud Gbre AMA , Mohamed AA, Fetouh AM, et al. Heart rate variability as a predictor of hypotension following spinal anesthesia for elective caesarian section in preeclamptic parturients: A descriptive observational study. Open Access Maced J Med Sci 2019; 7(23): 4043-7. doi: 10.3889/oamjms.2019.703.
- Küpeli İ, Subaşı F, Eren N, Arslan YK. Evaluating the relationship between the pleth variability index and hypotension and assessing the fluid response in geriatric hip fracture under spinal anaesthesia: An observational study. Turk J Anaesthesiol Reanim 2020; 48(3):208-14. doi: 10.5152/TJAR.2019.59251.
- Lu W, Dong J, Xu Z, Shen H, Zheng J. The pleth variability index as an indicator of the central extracellular fluid volume in mechanically ventilated patients after anesthesia induction: comparison with initial distribution volume of glucose. Med Sci Monit 2014; 20:386-92. doi: 10.12659/ MSM.890073.
- Yuksek A. Utility of the pleth variability index in predicting anesthesia-induced hypotension in geriatric patients. Turk J Med Sci 2021; 51(1):134-9. doi: 10.3906/sag-1912-132.
- Kuwata S, Suehiro K, Juri T, Tsujimoto S, Mukai A, Tanaka K, et al. Pleth variability index can predict spinal anaesthesia-induced hypotension in patients undergoing caesarean delivery. Acta Anaesthesiol Scand 2018; 62(1):75-84. doi: 10.1111/aas.13012.
- Sun S, Huang SQ. Role of pleth variability index for predicting hypotension after spinal anesthesia for cesarean section. Int J Obstet Anesth 2014; 23(4):324-9. doi: 10.1016/j.ijoa.2014.05.011.
- Tian F, He Z, Sun S, Wang T, Li N, Huang S. Role of HR and PVI in predicting hypotension after spinal anaesthesia for cesarean section. J Clin Anesth 2018;34(9):869-72.
- Wu Y, Zhang F Sun K Yu L Zhang H, Yan M. Evaluation of pleth variability index for predicting hypotension during induction of anesthesia in surgical patients. Natl Med J China 2014; 94(40):3167-70.
- Yeh PH, Chang YJ, Tsai SE. Observation of hemodynamic parameters using a non-invasive cardiac output monitor system to identify predictive indicators for post-spinal anesthesia hypotension in parturients undergoing cesarean section. Exp Ther Med 2020; 20(6):168-76. doi: 10.3892/ etm.2020.9298.