Total Lesion Glycolysis Obtained by FDG PET/CT in Diagnosing Solitary Pulmonary Nodules
By Serkan Gungor1, Ulug Mutlu Gunaydin2, Halil Ibrahim Yakar3, Eda Tanrikulu Simsek4, Ayten Guner Akbiyik5, Havva Keskin6Affiliations
doi: 10.29271/jcpsp.2023.01.31ABSTRACT
Objective: To evaluate the diagnostic performance of total lesion glycolysis (TLG) obtained by 18F-FDG PET/ CT to differentiate malignant solitary pulmonary nodules (SPNs) from benign ones.
Study Design: Observational study.
Place and Duration of Study: Department of Nuclear Medicine, Istanbul Medeniyet University School of Medicine, Istanbul, Turkey, from January 2018 to April 2022.
Methodology: Eighty patients, who were found to have SPNs and underwent PET/CT imaging, were enrolled in this retrospective study. Parameters of PET-CT such as metabolic, volumetric, and metabolovolumetric were assessed concerning diagnostic value. Moreover, maximum standard uptake value (SUVmax) and TLG were combined and compared to improve diagnostic accuracy.
Results: The number of the detected benign and malignant SPNs was 38 and 42, respectively. Compared to the benign lesions, the malignant nodules presented significantly higher values in terms of SUVmax, TLG, and the volumes of metabolic tumour (MTV) and CT. Considering all parameters, the highest area under the curve (AUC) was occupied by TLG and SUVmax. The values for the sensitivity, specificity, and accuracy of SUVmax, TLG, and SUVmax combined with TLG were as follows respectively: 97.6%, 63.2%, and 81.2%; 85.7%, 92.1%, and 88.7%; and 85.7%, 94.7%, and 90%.
Conclusion: The conventional value of SUVmax does not yield satisfactory results in order to separate the malignant nodules from the benign ones. The SUVmax value could be more valuable if it is used with TLG measurement in diagnosing SPNs.
Key Words: 18F-FDG PET/CT, SUVmax, TLG, Pulmonary nodule.
INTRODUCTION
A solitary pulmonary nodule (SPN) is a lesion <3 cm in diameter completely surrounded by pulmonary parenchyma and without other abnormalities.1 SPN is seen in 24-31% of all chest radiographs.2,3 A review evaluating the cancer screening study with computed tomography (CT) reported that the prevalence of SPN ranges from 8% to 51% in heavy or long-term smoker.4 The aetiology of SPN includes a broad range of diseases from benign pathologies to lung cancer. Therefore, the aetiology of SPN must be determined for an accurate diagnosis on time. Chest radiography, CT, and 18 FDG PET/CT are generally performed to evaluate SPNs.1,5
Many studies reported that PET plays a primary role in the diagnosis of SPNs. Early published studies revealed that the 18F-FDG PET scan is a precise noninvasive technique to diagnose SPN, providing overall sensitivity (100%) and high specificity (96%).6 However, considering the following studies, the results obtained were not very similar (62% and 25%, respectively).7 These conflicting results reflect a substantial change in the prevalence of malignancy and infectious/inflammatory diseases in different study populations. Infectious and inflammatory conditions can lead to a high false-positive rate and a low specificity.8,9 FDG PET studies previously conducted with SPN patients were restricted by visual and semiquantitative analyses utilising only maximum standardised uptake value (SUVmax). In addition, metabolic tumour volume (MTV), as well as total lesion glycolysis (TLG) were used to separate benign lesions from malignant ones.10,11 The achievement of the TLG and MTV was proved for not only diagnostic but also prognostic evaluation of pulmonary tumours. 12
The primary objective of this study was to determine if SUVmax value alone can provide a satisfactory and reliable result and if metabolo-volumetric parameters mentioned above can have an additional diagnostic role for SPN.
METHODOLOGY
This current study was designed as a retrospective observational study and carried out at the Department of Nuclear Medicine, Istanbul Medeniyet University School of Medicine. The Local Ethics Committee approved this retrospective study (Decision Number: 2018/0044), and exempt status from the informed consent requirement was granted. Eighty patients, 56 males and 24 females, who underwent an FDG-PET/CT scan between January 2018 and April 2022 for characterisation of SPNs were included. Clinical and demographic data were obtained from the electronic medical records, and imaging data were acquired from the hospital picture archiving and communications system. This information was entered into a prospective database and analysed. Exclusion criteria were multiple nodules, atelectasis, positive adenopathy in the mediastinum, and a history of both malignancy and lung cancer. Malignant or benign pulmonary lesions were diagnosed on the pathologic examination three months after the PET/CT scan. When biopsy or surgery was not considered, the participants were scheduled for periodic follow-ups for two to five years after the initial CT scan. When retrospectively assessing SPNs from historical CT, If no change was observed in the condition of nodules or there was an observable decrease in the size of the nodules, the nodule was diagnosed as benign. Then the patients were observed with a pulmonary nodule without specific treatment or any certain diagnosis.
For performing PET/CT scan, patients had fasted at least for 4 hours before the radioactivity injection. Philips Gemini TF model PET/CT scanner system was used for almost 60 min for each patient’s imaging. Before PET imaging, low-dose CT was performed from the skull base to the proximal thighs. After completion of the CT imaging, PET scan of the same area was performed.
A workstation with a professional software program (Syngo. via; Siemens AG, healthcare sector, Erlangen, Germany) was utilised to evaluate the outcomes of PET/CT data, providing maximum intensity projection and 3D displays. Volume-of-interest (VOI) of SPN for metabolic and metabolovolumetric parameters was drawn twice per patient and the results were average. As the volumetric parameters, size (longest diameter, mm), and 3D ratio (transverse dimension: vertical dimension) of SPN were measured on transaxial and coronal unenhanced CT images. In addition, the volume of SPN was calculated via this formula on the images of unenhanced CT: Volume (cm3) = 1/6π (0.523) × long-axis diameter (cm) × short-axis diameter (cm) × craniocaudal diameter (cm). On the other hand, the mean Hounsfield unit (HU) value of the SPN was measured by drawing a 1-cm-sized region of interest (ROI) at the SPN.
The formula, maximum pixel value with the return on investment activity (MBq/kg) / (injected dose (MBq)/body weight (kg)), was used to calculate SUVmax for metabolic parameters. SUVmax was the highest pixel uptake of SPN. MTV was estimated for more than 40% of SUVmax by VOI, and TLG was measured as the SUVmean multiplied by MTV.
To evaluate whether the distribution was normal, Kolmogorov-Smirnov normality test, Shapiro-Wilk test, and histogram plot were used. Mann–Whitney U-test and the Independent Sample t-test were used to compare the non-categorical variables, whereas Chi-square tests were for the categorical ones. The non-categorical variables were expressed as mean ± standard deviation or median (interquartile ranges) and categorical variables were expressed as numbers and percentages. Apart from these, Receiver Operating Characteristic (ROC) analysis was used to detect cut-off values, the presence of malignancy, as well as the sensitivity and specificity of variables. Besides, to detect the positive and negative predictive values (PPV and NPV, respectively) and accuracy as well, descriptive statistics were also used. The outcomes were assessed within a 95% confidence interval. The p-value under 0.05 indicated statistically significant results. The statistical analyses in the current study were carried out via SPSS 20.0 software program (SPSS Inc., Chicago, Illinois, USA).
RESULTS
Eighty patients, 56 males (70%), and 24 females (30%), mean age = 61±13 years), were enrolled in the present study. There were no significant differences between genders (p=0.80) and diagnoses (malignant/non- malignant). The number of patients whose SPNs were in the right and left lungs was 47 (59%) and 33 (41%), respectively. The mean diameter of the nodules was 18 mm (range: 10–30 mm). Of all these patients, 62 (77%) of them had a solid nodule, 7 (9%) of them had a ground-glass opacity, and 11 (14%) of them had partial solid nodules. Concerning density, there was no statistically significant difference between them (p=0.107). The malignant nodules had more irregular margins than the benign nodules (p=0.009).
Twenty-three out of 38 (61%) patients with benign SPN underwent nodule resection, performed within 1 to 3 months following the PET/CT scan. A significant decrease in nodule size or even a complete resolution in 4 patients was observed via follow-up CT scans. Whether the SPNs were benign in the remaining eleven patients manifested with the stable nodule dimension in a CT scan performed at least two consecutive years following the initial diagnosis. Forty-two patients (52.5%) were diagnosed with malignant pulmonary nodules. The median time for tumour resection was 6 weeks after FDG-PET/CT scan. From malignant SPN, the most prevalent histologies were: adenocarcinoma (n=28(67%)), squamous (n=8(19%)), small (n=4(9%)), and large cell (n=2(5%)) carcinomas. Among the benign SPN, the most prevalent histologies were: granulomas (n=13 (16%)) and hamartomas (n=2 (3%)). Considering the size of the SPNs (17.9±6.0 vs. 20.5±5.9, p=0.058), there was no statistically significant difference. However, the volume of SPNs (2.8±2.4 vs. 4.8±3.8, p=0.004) for both benign and malignant lesions provided a statistically significant difference.
Table I: Comparison of PET/CT parameters between the benign and malign groups.|
Parameter |
Benign Group (n=38) X ±SD or Med (IQR)* |
Malign Group (n=42) X ±SD or Med (IQR)* |
p-value** |
|
SUVmax |
2.4 ± 1.4 |
9.1 ± 3.6 |
<0.001 |
|
MTV |
2.0 ± 1.3 |
5.0 ± 3.6 |
<0.001 |
|
TLG |
3.4 ± 2.9 |
28.7 ± 24.9 |
<0.001 |
|
Size (mm) |
17.9± 6.0 |
20.5 ± 5.9 |
0.058 |
|
CT volume cm3 |
2.8 ± 2.4 |
4.8 ± 3.8 |
0.004 |
|
3D ratio |
1.5 ± 0.4 |
1.2 ± 0.3 |
0.002 |
|
HU |
-20 (-73.0 – 9.2) |
3.5 (-8.0 – 12.0) |
0.007 |
|
SUV, standardised uptake value; MTV, metabolic tumour volume; TLG, total lesion glycolysis; HU, Hounsfield unit. *X ±SD, Mean ± standard deviation; Med (IQR), Median (interquartile ranges). **Independent t-test was applied. Significant results (p <0.05). |
|||
Table II: The ROC curve analysis of PET/CT parameters for determining solitary pulmonary nodules (n=80).
|
Parameter |
Sensitivity (%) |
Specificity (%) |
PPV (%) |
NPV (%) |
Accuracy (%) |
AUC (%) |
Cut-off value |
|
SUVmax |
97.6 |
63.2 |
74.5 |
96.0 |
81.2 |
0.97 |
2.5 |
|
MTV |
76.2 |
78.9 |
80.0 |
75.0 |
77.5 |
0.84 |
2.65 |
|
TLG |
85.7 |
92.1 |
92.3 |
85.4 |
88.7 |
0.96 |
8.10 |
|
Size (mm) |
73.8 |
55.3 |
64.6 |
65.6 |
65.0 |
0.63 |
17.5 |
|
CT volume (cm3) |
76.2 |
63.2 |
69.6 |
70.6 |
70.0 |
0.72 |
2.75 |
|
3D ratio |
71.4 |
13.2 |
47.6 |
29.4 |
43.7 |
0.32 |
1.05 |
|
HU |
81.0 |
63.2 |
70.8 |
75.0 |
72.5 |
0.67 |
-11.5 |
|
SUVmax and TLG* |
85.7 |
94.7 |
94.7 |
85.7 |
90.0 |
0.90 |
2.5 and 8.10 |
|
ROC, receiver operating characteristic; PPV, positive predictive value; NPV, negative predictive value; AUC, area under the curve; SUV, standardised uptake value; MTV, metabolic tumour volume; TLG, total lesion glycolysis; HU, Hounsfield unit. *The combination of SUVmax and TLG, simultaneously, SUVmax≥2.50 and TLG≥ 8.1. |
|||||||
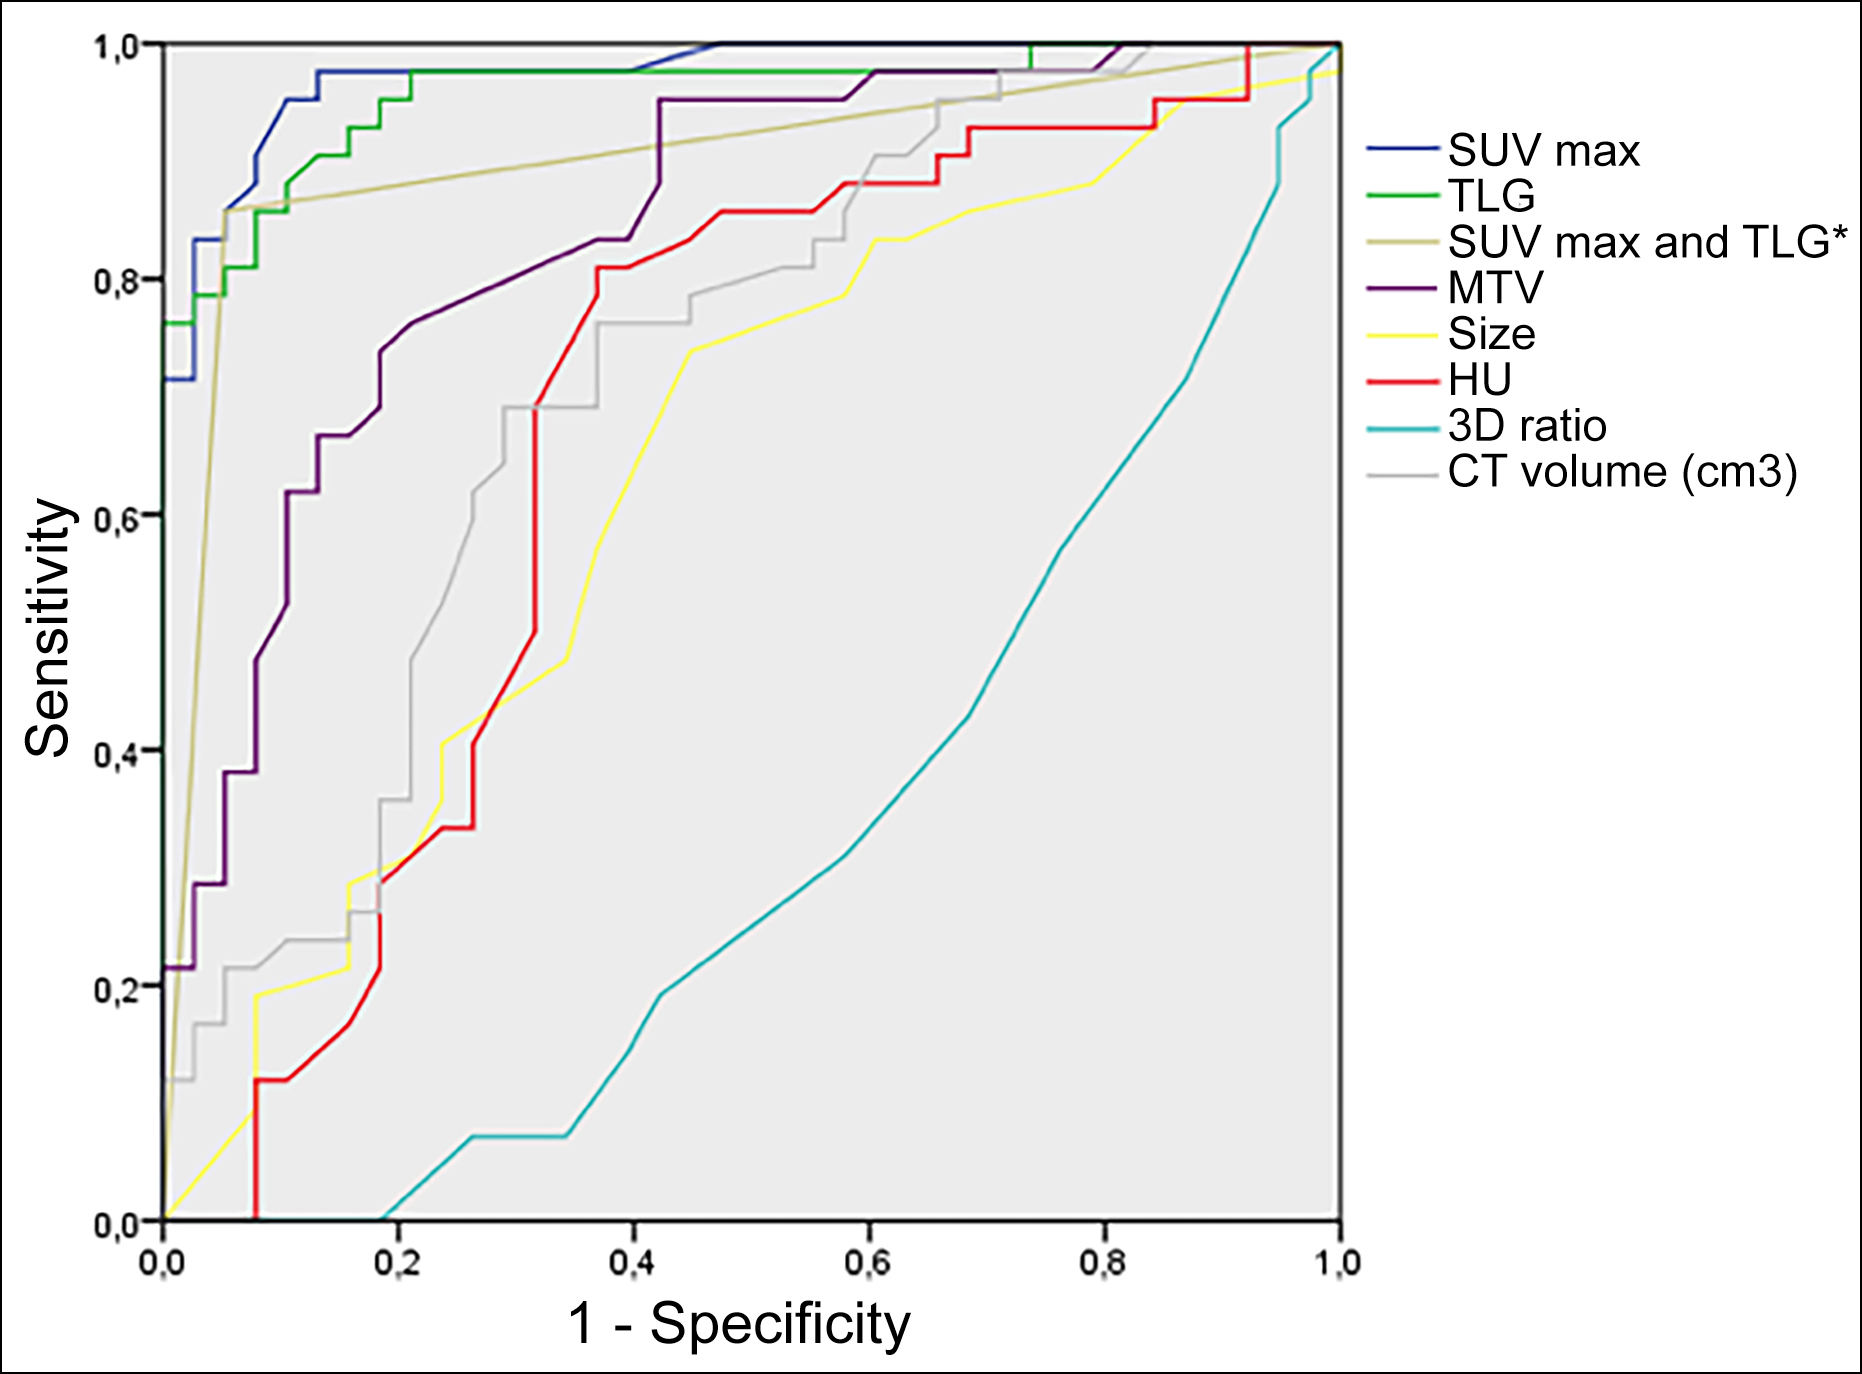 Figure 1: ROC curves of the parameters with the diagonal reference line. AUC values were 0.97 for SUVmax, 0.96 for TLG, 0.90 for SUVmax and TLG*, 0.84 for MTV, 0.72 for CT volume, 0.63 for size, and 0.32 for 3D ratio. The diagonal segments are produced by ties.
*Simultaneously, SUVmax≥2.50 and TLG ≥8.1.
All PET/CT parameters, metabolic and metabolovolumetric ones, were significantly higher in case of the malignant lesions: the SUVmax (2.4±1.4 vs. 9.1±3.6, p<0.001), MTV (2.0±1.3 vs. 5.0±3.6, p<0.001), and TLG (3.4±2.9 vs. 28.7±24.9, p<0.001). On the other hand, the 3D ratio (1.5±0.4 vs. 1.2±0.3, p=0.001) was found to be significantly lower in the malign lesions (Table I); however, HU [-20 (-73-9.2) vs.3.5 (-8.0-12.0), p =0.007] was not.
The ROC curve analysis of all PET/CT parameters characterising SPN is shown in Table II, and Figure 1. This analysis showed the highest area under the curve (AUC) for SUV max (0.97), TLG (0.96), and the combination of the SUV max and TLG (0.90). TLG and SUVmax had a sensitivity of 85.7% and 97.6%, specificity of 92.1% and 63.2%, PPV of 92.3% and 74.5%, NPV of 85.4% and 96%, and accuracy of 88.7% and 81.2% at cut-off value 8.10 and 2.5, respectively. The CT volume of SPN showed the highest AUC among all volumetric parameters (0.72) with a sensitivity of 76.2%, specificity of 63.2%, PPV of 69.6%, NPV of 70.6%, and accuracy of 70.0% at cut-off value 2.75 cm3 (Table II). In addition, the performance of the SUVmax with the combination of TLG was also calculated when the SUVmax and TLG cut-off values were taken as 2.5 and 8.10, respectively. If SUVmax and TLG values were simultaneously equal to or more than the determined thresholds, SPNs were considered malignant. The combination of the SUVmax and TLG had a sensitivity of 85.7%, specificity of 94.7%, PPV of 94.7%, NPV of 85.7%, and accuracy of 90.0% (Table II).
The box plot of PET/CT parameters between the benign and malignant lesions is shown in Figure 2. Compared to the benign lesions, a significant increase was seen in the malignant ones in terms of the SUVmax, CT volume, and TLG. However, considering TLG, the SUVmax and CT volume presented a higher range of overlap.
DISCUSSION
This analysis suggests that the combination of SUVmax and TLG can be essential in increasing specificity and accuracy in SPN diagnosis and determining whether the pulmonary nodule is benign or malignant, particularly in countries with higher tuberculosis incidences, such as Turkey and India.9
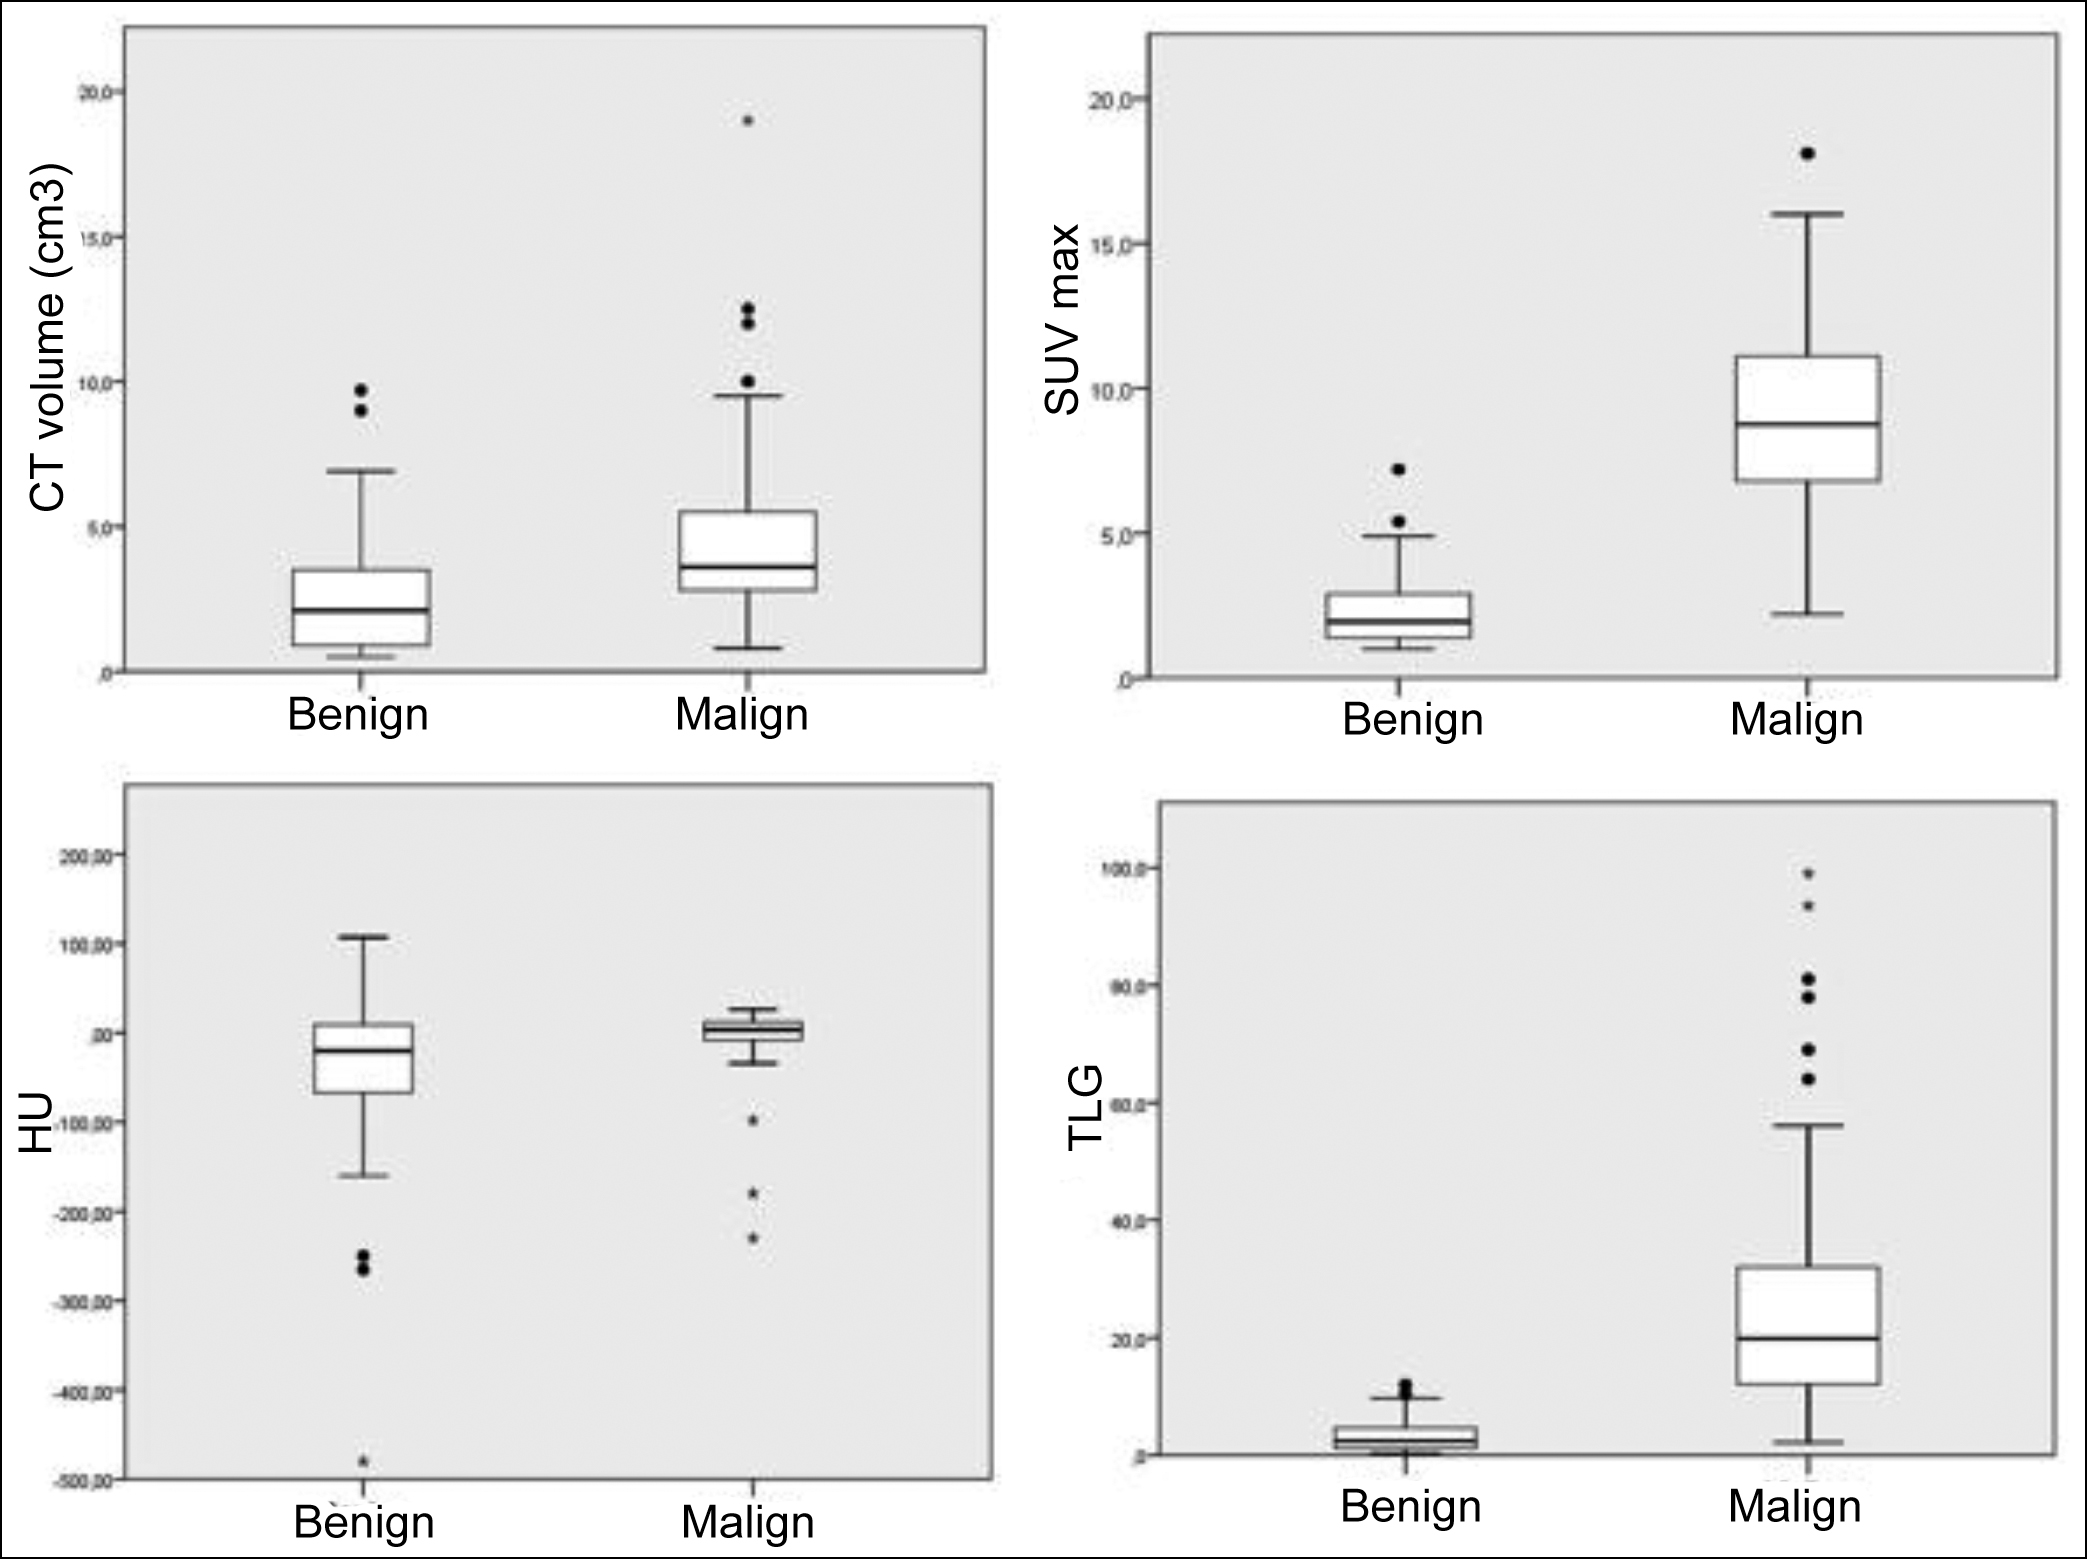 Figure 2: Box plots of PET/CT parameters between the benign and malignant lesions. The Median (interquartile ranges) values for the benign vs. malign nodules, respectively. a) For SUVmax; 1.9 (1.4-2.9) vs. 8.7 (6.6-11.1), b) For HU; -20 ((-73)-9.25) vs. 3.5 ((-8.0)-12.0), c) For CT volume (cm3); 2.1 (0.9-3.5) vs. 3.6 (2.7-5.7), and d) For TLG; 2.4 (1.2-4.6) vs. 19.8 (11.9-33.5). The SUVmax, CT volume, and TLG values increased in the malignant lesions. However, the SUVmax and size of benign and malignant lesions revealed a high overlap range compared with the TLG.
SUV, standardised uptake value; TLG, total lesion glycolysis; SPN, solitary pulmonary nodule.
Both morphologic and anatomic information for SPNs is provided with the help of CT. The diagnostic yield of CT may be enhanced by computer-aided diagnosis.13 Central, laminar, diffuse, popcorn, and concentric calcifications, as well as the absence of any nodule growth over CT after 2-year observation, are essential indicators of benign lesions.14 An eccentric appearance, nondemarcated borders, spiculated pattern, and a doubling time of <10 months are the characteristic features of malignant nodules. In general, CT follow-up includes comparative measurements for the diameter of nodules; however, some nodules are growing up asymmetrically, which cannot be observed through conventional two-dimensional (2D) measurements. Because nodule growth is a three-dimensional (3D) phenomenon, it is proposed that 3D volumetric evaluation is an accurate and replicable technique for detecting SPN's size and growth than the diameter.15 Nevertheless, the challenges in 3D volumetric determination, such as motion artefacts and scanning speed, make the method controversial.
PET with 18F-FDG is considered one of the basic techniques to evaluate glucose metabolism in tumours. Compared to benign lesions, malignant tissues present higher 18F-FDG uptake. In clinical practice, SUVmax is a conventional PET/CT parameter for making quantitative analyses in patients with SPN. Gould et al. found 94% sensitivity and 86% specificity in diagnosing of SPNs and mass lesions (<4 cm in size) using SUVave of ≥2.5 as a cut-off point for detecting malignancy.16 A comparatively new meta-analysis reviewing FDG-PET accuracy on SPN presented a sensitivity of 89% and a specificity of 70%.17 In a study conducted by Purandare et al. with 191 patients, the sensitivity, specificity, and accuracy of FDG-PET to differentiate malignant SPNs from benign ones were found as 94.4%, 34.7%, and 79.5%, respectively, when the threshold value for SUVmax was 2.5.9 The results for this study were as follows respectively: 97.6%, 63.2%, and 81.2% for 18F-FDG PET/CT using a SUVmax cut-off of 2.5. The sensitivity was higher in this study, like other studies, whereas, the specificity was lower, which refers to the high prevalence of granulomas and inflammation. Taken into consideration the studies in the field and the present study as well, the low specificity and accuracy rates of the standard SUVmax cut-off value seem to be an important problem in the diagnosis of SPN. To solve this problem, several studies have suggested that the conventional criteria of using a SUVmax cut-off of 2.5 are unsuitable, and the modified SUVmax cut-off value is recommended to differentiate the malignant lesions from the benign ones.17 Nevertheless, the SUVmax cut-off of 2.5 is generally accepted as the common threshold to measure diagnostic accuracy in clinical practice due to the absence of a reliable SUVmax value within the different values.
In recent years, PET/CT metabolic and volumetric parameters have been studied to evaluate different combinations in SPN to improve the diagnostic value. Besides the value of SUVmax, TLG has also been used for characterising lesions as a novel PET/CT metabolovolumetric parameter.10,11 In this study, the SUVmax and TLG were evaluated individually, and both combined to find the best diagnostic value among volumetric, metabolic, and metabolovolumetric parameters. Considering them, TLG had the highest diagnostic value. Compared to SUVmax, TLG demonstrated the highest specificity, a positive predictive value, and accuracy whereas the lowest sensitivity and a negative predictive value. On the other hand, SUVmax combined with TLG demonstrated higher specificity, a positive predictive value, and accuracy than TLG alone (94.7 vs. 92.1, 94.7 vs. 92.3, and 90.0 vs. 88.7, respectively).
The small sample size and the lack of pathological confirmation of some benign nodules are the limitations of this study. However, according to guidelines, these patients did not need any resection or pathological confirmation.18
CONCLUSION
The present study outcomes reveal that the combination method of TLG and SUVmax may have a fundamental role in SPN diagnosis, particularly in an endemic population with acute or chronic infectious diseases owing to its additional diagnostic value than the SUVmax and TLG alone. Nevertheless, more extensive studies are required in daily practice due to the rewarding value of this combination.
ETHICAL APPROVAL:
This study was approved by the local Ethics Committee (approval No: 2018/0044).
PATIENTS’ CONSENT:
Because this study was retrospective, the patients’ consent were waived.
COMPETING INTEREST:
The authors declared no competing interest.
AUTHORS’ CONTRIBUTION:
SG: Data collection, statistical analysis, data curation, writing original draft, writing reviews, and editing.
HIY, UMG: Data collection, data curation, and writing reviews.
ETS, AGA, HK: Statistical analysis, and data collection.
All the authors critically reviewed the final version of the manuscript and approved it for publication.
REFERENCES
- Mazzone PJ, Lam L. Evaluating the patient with a pulmonary nodule: A review. JAMA 2022; 327:264-73. doi:10.1001/jama.2021.24287.
- Ko JP, Bagga B, Gozansky E, Moore WH. Solitary pulmonary nodule evaluation: Pearls and pitfalls. Semin ultrasound CT MR 2022; 43:230-45. doi:10.1053/j.sult.2022.01.006.
- Ogan N, Baha A, Ozan SE, Alhan A, Gulhan M. Incidental pulmonary nodule frequency in Turkey. Turkey’de insidental pulmoner nodül görülme sıklığı. Tuberkuloz ve Toraks 2019; 67: 190-6. doi:10.5578/tt.68532.
- Patel VK, Naik SK, Naidich DP, Travis WD, Weingarten JA, Lazzaro R, et al. A practical algorithmic approach to the diagnosis and management of solitary pulmonary nodules: Part 1: Radiologic characteristics and imaging modalities. Chest 2013; 143:825-39. doi:10.1378/chest.12-0960.
- Tezcan MA, Ozsoy IE, Karacavus S, Karaman H. Accuracy of metabolic imaging-guided transthoracic biopsy in lung cancer. J College Physicians Surgeons Pakistan 2022; 32:152-6. doi:10.29271/jcpsp.2022.02.152.
- Tsushima Y, Tateishi U, Uno H, Takeuchi M, Terauchi T, Goya T, et al. Diagnostic performance of PET/CT in the differentiation of malignant and benign non-solid solitary pulmonary nodules. Annals Nuclear Medicine 2008; 22:571-7. doi:10.1007/s12149-008-0160-1.
- Degirmenci B, Wilson D, Laymon CM, Becker C, Mason NS, Bencherif B, et al. Standardised uptake value based evaluations of solitary pulmonary nodules using F-18 fluorodeoxyglucose-PET/computed tomography. Nuclear Medicine Communications 2008; 29:614–22. doi:10.1097/MNM.0b013e3282f9b5a0.
- Sathekge MM, Maes A, Pottel H, Stoltz A, van de Wiele C. Dual time-point FDG PET-CT for differentiating benign from malignant solitary pulmonary nodules in a TB endemic area. South African Medical J 2010; 100:598-601. doi:10.7196/ samj.4082.
- Purandare NC, Pramesh CS, Agarwal JP, Agrawal A, Shah S, Prabhash K, et al. Solitary pulmonary nodule evaluation in regions endemic for infectious diseases: Do regional variations impact the effectiveness of fluorodeoxyglucose positron emission tomography/computed tomography. Indian J Cancer 2017; 54:271-5. doi:10.4103/0019- 509X.219563.
- Kim YI, Cheon GJ, Paeng JC, Cho JY, Kang KW, Chung JK, et al. Total lesion glycolysis as the best 18F-FDG PET/CT parameter in differentiating intermediate-high risk adrenal incidentaloma. Nuclear Medicine Communications 2014; 35: 606–12. doi:10.1097/MNM.0000000000000101.
- Erdogan M, Evrimler S, Aydın H, Karaibrahimoglu A, Sengul SS. Solitary pulmonary nodule: Morphological effects on metabolic activity assessment. Mol Imaging Radionucl Ther 2019; 28:112-9. doi:10.4274/mirt.galenos.2019.65707.
- Wang XY, Zhao YF, Liu Y, Yang YK, Wu N. Prognostic value of metabolic variables of [18F]FDG PET/CT in surgically resected stage I lung adenocarcinoma. Medicine (Baltimore) 2017; 96:e7941. doi:10.1097/MD.0000000000007941.
- Khan T, Usman Y, Abdo T, Chaudry F, Keddissi JI, Youness HA. Diagnosis and management of peripheral lung nodule. Annals Translational Medicine 2019; 7:348. doi:10.21037/atm.2019.03.59.
- Stephens MJ, Rho BH, Curran-Everett D, Carr L, Bowler R, Lynch D. Identification of nonaggressive pulmonary nodules using an optimised scoring system. J Thoracic Imaging 2019; 34:170-8. doi:10.1097/RTI.0000000000000405.
- Revel MP, Lefort C, Bissery A, Bienvenu M, Aycard L, Chatellier G, et al. Pulmonary nodules: Preliminary experience with three-dimensional evaluation. Radiology 2004; 231:459-66. doi:10.1148/radiol.2312030241.
- Gould MK, Maclean CC, Kuschner WG, Rydzak CE, Owens DK. Accuracy of positron emission tomography for diagnosis of pulmonary nodules and mass lesions: A meta-analysis. JAMA 2001; 285:914–24. doi:10.1001/jama.285.7.914.
- Li ZZ, Huang YL, Song HJ, Wang YJ, Huang Y. The value of 18F-FDG-PET/CT in the diagnosis of solitary pulmonary nodules: A meta-analysis. Medicine 2018; 97:e0130. doi:10.1097/MD.0000000000010130.
- MacMahon H, Naidich DP, Goo JM, Lee KS, Leung ANC, Mayo JR, et al. Guidelines for management of incidental pulmonary nodules detected on CT images: From the fleischner society. Radiology 2017; 284:228-43. doi:10.1148/radiol. 2017161659.