The Relationship Between Lipid Profile and Non-alcoholic Fatty Liver Disease in Children and Adolescents with Obesity
By Emrah Cigri1, Funda Catan Inan2, Eren Er3, Eren Yildiz1Affiliations
doi: 10.29271/jcpsp.2022.05.591ABSTRACT
Objective: To determine the relationship between lipid profile and non-alcoholic fatty liver disease in obese children and adolescents.
Study Design: A comparative cross-sectional study.
Place and Duration of Study: Department of Pediatrics, Kastamonu Training and Research Hospital, Turkey, from March 2018 to April 2021.
Methodology: Clinical, laboratory and ultrasound findings of 290 children and adolescents diagnosed with obesity were analysed. Children and adolescents were divided into two groups as those who were diagnosed with NAFLD by ultrasonography (USG) and those who did not were diagnosed. Two groups were compared in terms of clinical and biochemical findings.
Results: The body mass index (BMI), bodyweight for height (BWH), insulin, alanine aminotransferase (ALT), aspartate aminotransferase (AST), free T4, total cholesterol (TC), low-density lipoprotein cholesterol (LDL-C), triglyceride (TG), hemoglobin A1c (HbA1c) and HOMA-IR (Homeostatic Model Assessment for Insulin Resistance) levels were found to be significantly higher (p<0.05) in the children and adolescents with NAFLD In obese children and adolescents; there was a significant correlation between the increase in TC, LDL-C and TG levels in the blood and the development of NAFLD (p<0.05). Blood ALT level ≥37 U/L in obese boys and ≥23.5 U/L in obese girls was found to be a strong diagnostic biomarker in determining the presence of NAFLD.
Conclusion: In obese children and adolescents, there was a significant relationship between the increase in BWH and blood lipid levels, insulin resistance and the development of NAFLD. ALT had high specificity and sensitivity to predict non-alcoholic fatty liver disease.
Key Words: Obesity, Children, Hepatosteatoz.
INTRODUCTION
Non-alcoholic fatty liver disease (NAFLD) is an abnormal fat accumulation and characterised by more than 5% of hepatocytes without alcohol consumption, drug use, viral infections, metabolic and autoimmune diseases or genetic disease.1,2 It is the most common chronic liver disease in children and the most common indication for liver transplantation in young adults in the USA.3 The prevalence of NAFLD has more than doubled in the United States over the past 20 years.4
Although the liver biopsy is the gold standard method in the diagnosis of NAFLD, it is not generally preferred due to the fact that it is invasive and costly.5 In addition to serum biomarkers such as ALT and AST in overweight or obese children and liver USG is currently the most widely used tool for diagnosis.6 Besides insulin resistance, obesity and related dyslipidemias, which are featured by an increase in TG and LDL-C and a decrease in high-density lipoprotein cholesterol (HDL-C) are thought to be the most important risk factors for NAFLD.7
As can be seen, weight gain and obesity are primary risk factors for the development of NAFLD. Further evidence suggests that diet composition, particularly carbohydrates, has an important role in the progression of the disease to NASH and fibrosis.8 In other words, nutrition habits are an important starting point for NAFLD. It is predicted that the frequency of obesity and NAFLD will increase due to the increasing malnutrition habits in children and young adults. For this reason, this study aimed to investigate the relationship between lipid profile and non-alcoholic fatty liver disease in obese children and adolescents, by comparing the clinical and biochemical findings of the children and adolescents with and without NAFLD.
METHODOLOGY
Two hundred and ninety obese children and adolescents who presented to the Pediatrics Clinic between March 2018 and April 2021 and were diagnosed with obesity and a BMI ≥95p for ≥2 years, ≥97.7p of weight-for-height percentile for <2 years of age, fasting blood lipid profile (TC, LDL-C, HDL-C, TG), and who had NAFLD evaluation with abdominal USG.
The patients were evaluated retrospectively and the age (month) closest to the date of USG, gender, body weight (BW), height, BWH, BMI (BW/height 2 = Kg/m 2), blood glucose, insulin, ALT, AST, free T4 ( fT4), thyroid-stimulating hormone (TSH), TC, LDL-C, HDL-C, non-HDL-C, TG, HbA1c levels and insulin resistance HOMA-IR (Homeostatic Model Assessment for Insulin Resistance) scores were recorded. Non-HDL-C levels were calculated by subtracting HDL-C levels from TC.9 HOMA-IR score was calculated with the formula of (glucose) x (insulin)/405, and a score >3.42 was considered as IR (+).10
The TC, LDL-C, HDL-C and TG levels of the patients were compared with the age and sex-standardized percentile chart,11 and recorded as low (<5p), normal (5p-95p) and high (>95p). In this way, the patients were divided into three groups according to their blood lipid levels and the biochemical parameters of the groups were compared.
The Statistical Package for Social Sciences-23 (SPSS-23) program was used to analyze the data. The data with normal distribution was checked with the Kolmogorov-Smirnov test. The median and 25-75th percentile values of non-normal continuous variables were calculated. Categorical variables were expressed as numbers and percentages. The significance of the differences between the groups in non-normal variables was evaluated using the Mann-Whitney U test and the Kruskal-Wallis test. Pearson Chi-square test was used to determine the relationship between categorical variables with two or more groups. The optimal cut-off values and area under the curve of continuous ALT and AST variables were calculated by applying the Receiver Operating Curve (ROC) analysis. The p<0.05 value was considered statistically significant.
RESULTS
The mean age of the patients was 12.06 ± 3.3 years. One hundred and twenty-five (43.1%) of these patients were diagnosed with NAFLD. Of the patients diagnosed with NAFLD 52% (n: 65) were girls and 48% (n:60) were boys. Demographic and biochemical findings of patients with and without NAFLD are given in Table I. The values of several parameters (BMI, BWH, insulin, ALT, AST, fT4, LDL-C, TG, non-HDL-C, HbA1c, HOMA-IR) were computed to be higher in patients with NAFLD than in patients without NAFLD. NAFLD was seen in 64.8% of those with IR (+) and the incidence of NAFLD was significantly higher in those with IR (+) than those with IR (-) (p=0.001).
Table I: Demographic and biochemical findings of patients with and without NAFLD.
|
Variables |
With NAFLD (n=125, 43.1%) |
Without NAFLD (n=165, 56.9%) |
p |
|
Gender (female/male) |
65/60 (%52/48) |
107/58 (%64.8/35.2) |
0.027** |
|
Age (years) |
11,5 (9,6-15) |
12,25 (9,7-15,3) |
0.322* |
|
BW (kg) |
56 (41-70.50) |
55 (39.50-65.50) |
0.198* |
|
Height (cm) |
148 (135-161) |
153 (137.5-160) |
0.821* |
|
BMI (kg/m2) |
25.1 (22.2-27.65) |
24 (21.05-25.80) |
0.001* |
|
BWH (cm) |
129 (125-144) |
123 (122-126) |
<0.001* |
|
Glucose (mg/dL) |
88 (84-94) |
88 (83-93) |
0.314* |
|
Insulin (U/mL) |
20 (12-30) |
15 (10-22) |
0.001* |
|
ALT (U/L) |
62 (55.5-69.5) |
15 (12-17.50) |
<0.001* |
|
AST (U/L) |
42 (37-52) |
18 (15-22) |
<0.001* |
|
fT4 (ng/DL) |
1.2 (1.37-1.1) |
1.1 (0.9-1.3) |
<0.001* |
|
TSH (mIU/mL) |
2.8 (2.2-4.1) |
2.70 (2.05-3.85) |
0.456* |
|
TC (mg/dL) |
154 (139-178.5) |
148 (132-166) |
0.063* |
|
LDL-C (mg/dL) |
101 (83.5-121) |
94 (80-109.50) |
0.007* |
|
HDL-C (mg/dL) |
44 (38-49) |
46 (39-53) |
0.065* |
|
TG (mg/dL) |
108 (78.5-155) |
91 (70-121.50) |
0.016* |
|
Non-HDL-C (mg/dL) |
109 (92.5-132) |
104 (84-120) |
0.009* |
|
HbA1c (%) |
5.3 (5.2-5.7) |
5.2 (4.9-5.5) |
0.001* |
|
HOMA-IR (mg/dL) |
4.2 (2.5-6.5) |
3.1 (2.1-4.7) |
<0.001* |
|
*Mann-Whitney U-test ** Pearson’s Chi-square test. |
|||
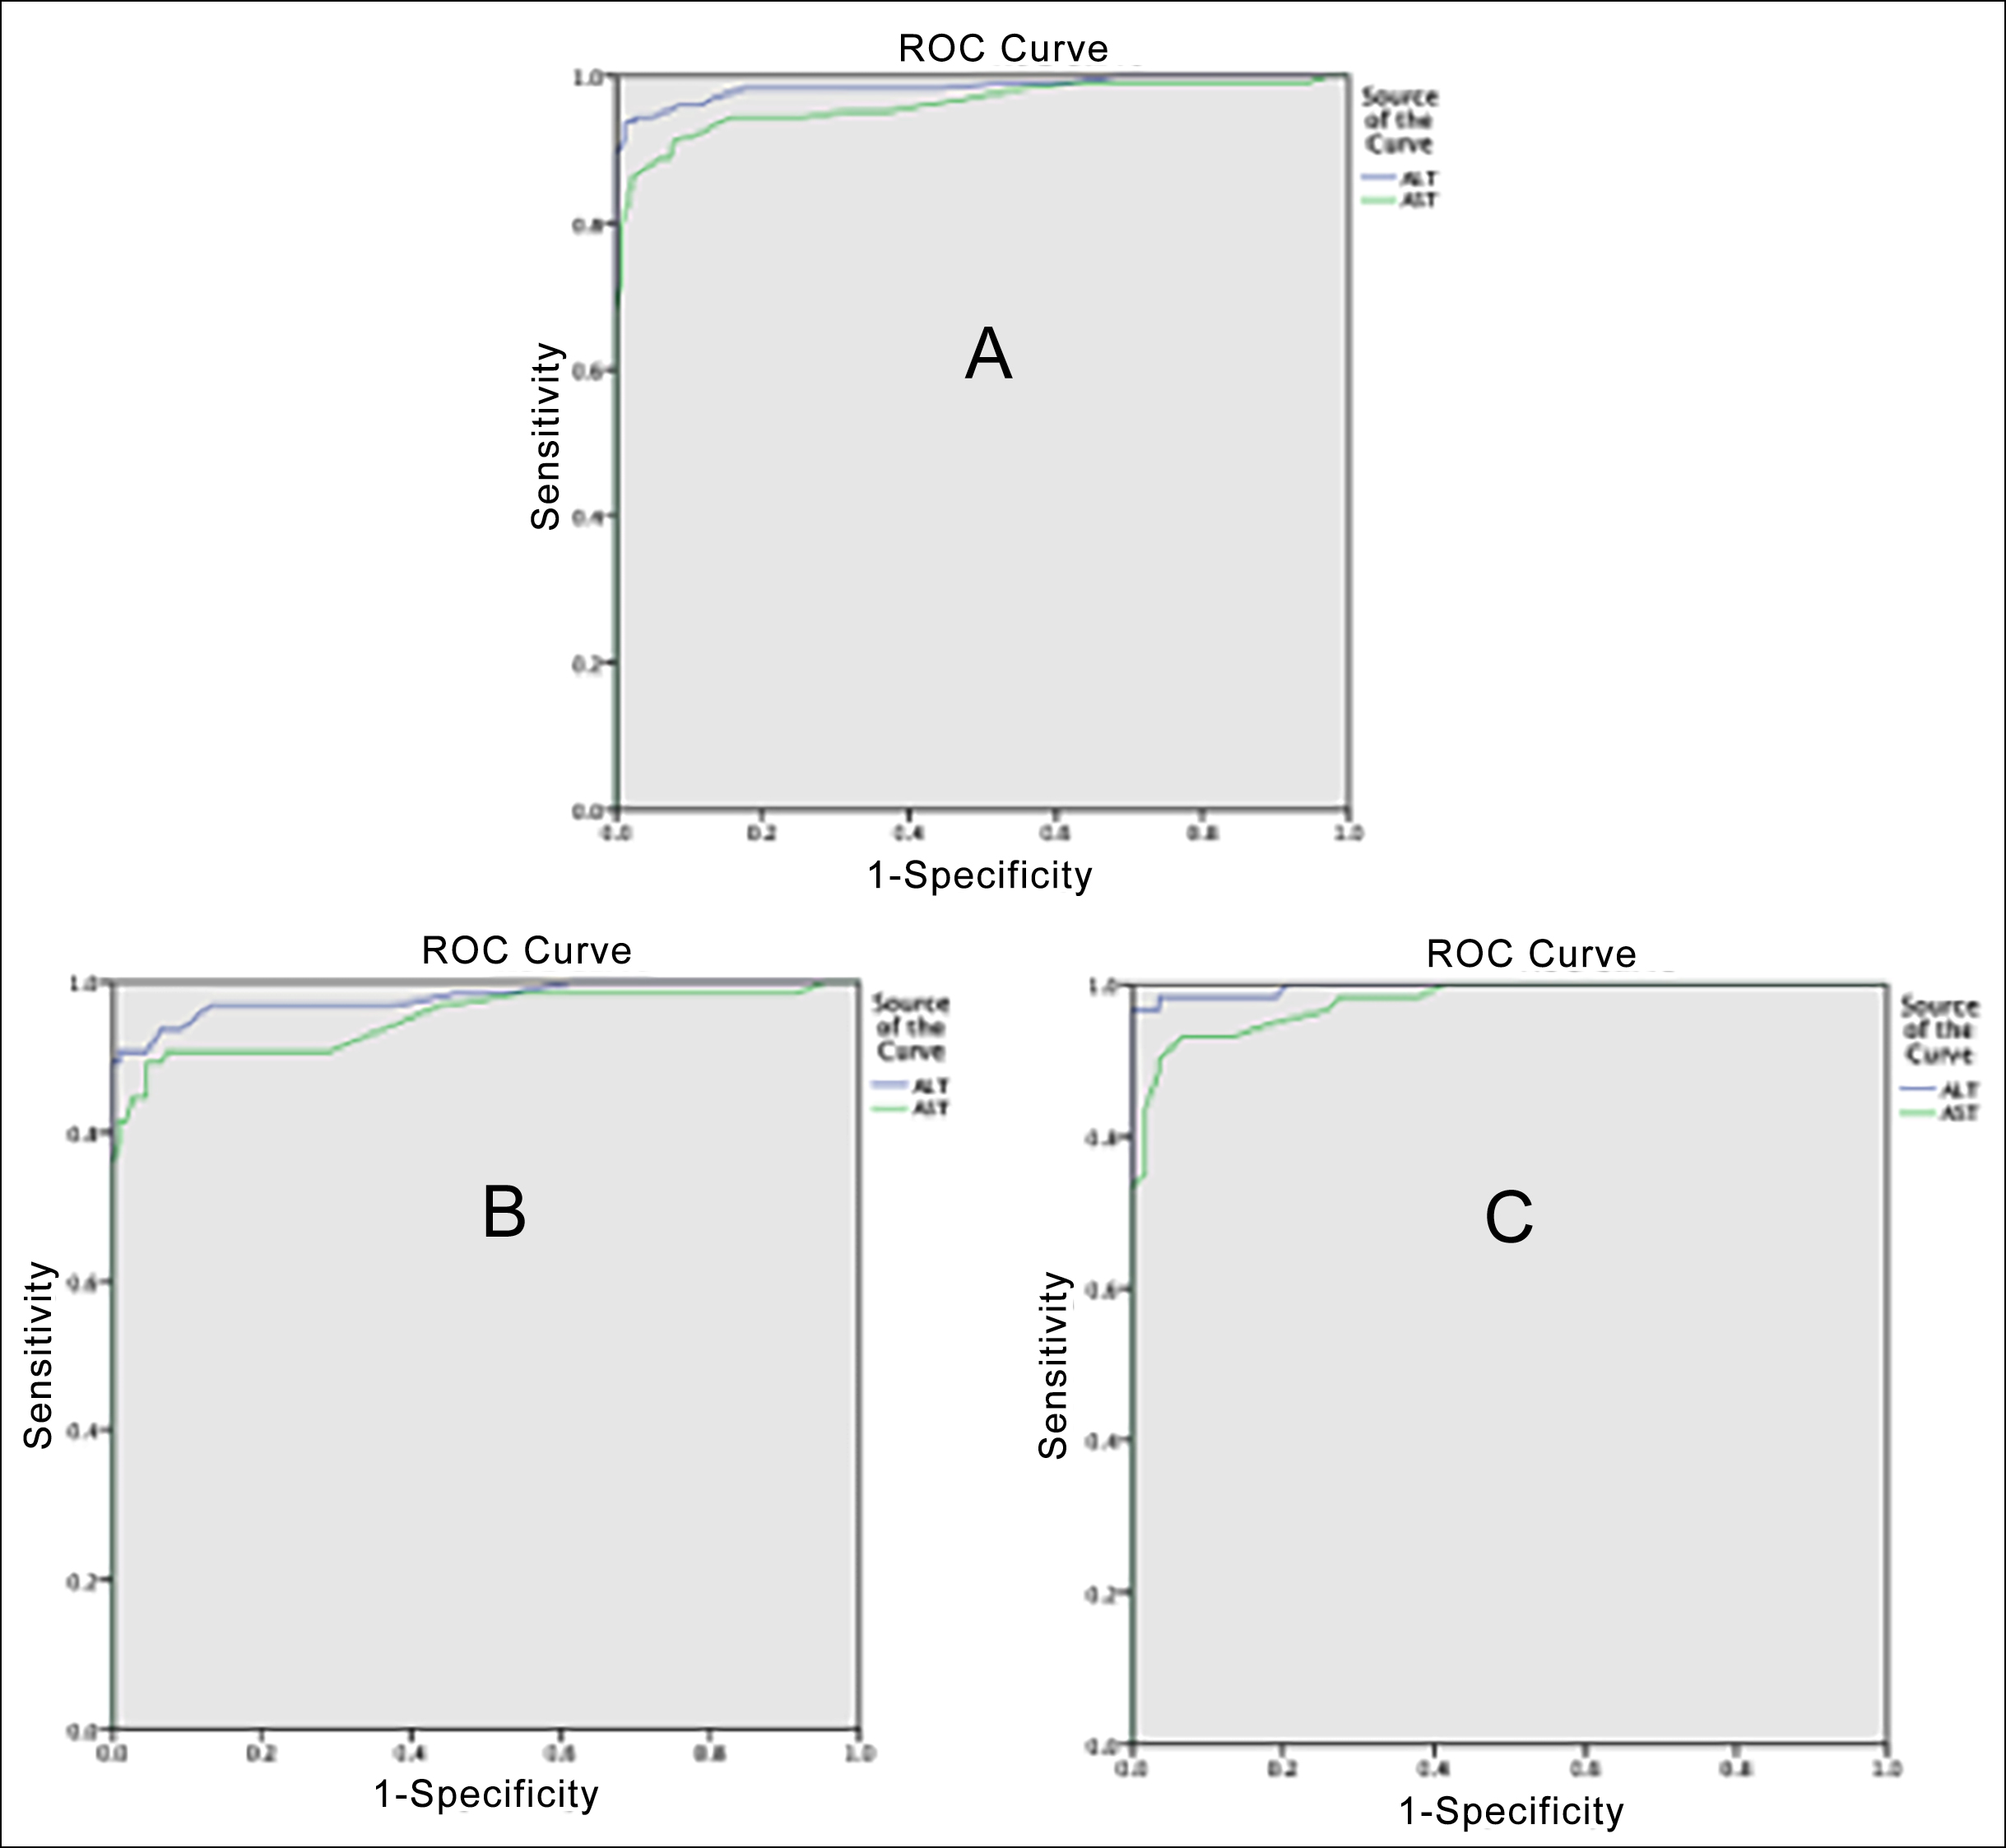 Figure 1: ROC curves of ALT and AST variables for all patients (A), females (B) and males (C) with nonalcoholic fatty liver disease.
The clinical properties and biochemical findings in patients with and without NAFLD by LDL-C levels were compared. Statistically significant differences were found between BWH (p=0.013), ALT (p<0.001), AST (p=0.002), fT4 (p=0.038), TC (p<0.001), TG (p<0.001), non-HDL-C (p<0.001) and HbA1c (p<0.001) in terms of the LDL-C levels. All of the laboratory results were higher in the group with high levels of LDL-C than the other groups (groups with normal and low levels of LDL-C). Moreover, it was higher in the group with normal levels of LDL-C compared to the group with low levels of LDL-C.
The comparison of patients according to their TG levels has been presented in Table II. The parameters (TG, ALT, AST, TC, LDL-C, HDL-C, non-HDL-C, HbA1c) except HDL-C were found to be higher in the group with high levels of TG compared to the groups with normal and low levels of TG. These results were also higher in group with normal level of TG in comparison to group with low level of TG. On the other hand, increasing HDL-C showed a significant decrease in the level of TG.
Table II: Demographic and biochemical findings of patients according to their TG levels.
|
Variables |
TG Level Low n=10, 3.5% |
TG Level Normal n=170, 58.6% |
TG Level High n=110, 37.9% |
p* |
|
Age (years) |
11,25(9,81-16) |
12.1 (9,6-15,3) |
11,6 (9,5-14) |
0.419 |
|
BW (kg) |
56.5 (44.75-65.25) |
56 (42-68) |
55 (38.75-68.25) |
0.869 |
|
Height (cm) |
153.5 (139.75-157.75) |
153 (138-160) |
149 (135-158.5) |
0.673 |
|
BMI (kg/m2) |
25.55 (22.8-25.3) |
24.35 (21.9-26.5) |
24.55 (21.65-26.5) |
0.993 |
|
BWH (cm) |
128 (124.5-130.5) |
124.5 (122-129.25) |
125 (122-136.25) |
0.226 |
|
Glucose (mg/dL) |
91.5 (90.25-93.5) |
88 (84-93) |
88 (82.75-94) |
0.260 |
|
Insulin (U/mL) |
15 (9.25-22.75) |
15.5 (10-25) |
19 (13-27.25) |
0.051 |
|
ALT (U/L) |
13 (10.75-18.25) |
18.5 (14-58) |
46 (15-64) |
0.002 |
|
AST (U/L) |
19 (15.5-22) |
23 (17-40.25) |
28 (18-43) |
0.048 |
|
fT4 (ng/DL) |
1.2 (1.1-1.32) |
1.2 (0.9-1.3) |
1.2 (1-1.3) |
0.389 |
|
TSH (mIU/mL) |
2.75 (1.92-4.8) |
2.6 (2.1-3.75) |
3.15 (2.2-4.2) |
0.122 |
|
TC (mg/dL) |
132 (114.5-140.75) |
147 (128-161.25) |
163 (143.75-190) |
<0.001 |
|
LDL-C (mg/dL) |
68.5 (53.5-82) |
94 (80-108) |
107 (88.75-129.25) |
<0.001 |
|
HDL-C (mg/dL) |
59 (52.75-67.5) |
45 (40-52) |
43 (36-48) |
<0.001 |
|
Non-HDL-C(mg/dL) |
76 (58.75-85) |
101 (83-116.25) |
120.5 (101.5-142.5) |
<0.001 |
|
HbA1c (%) |
5.05 (4.8-5.3) |
5.3 (5-5.5) |
5.4 (5.1-5.6) |
0.012 |
|
HOMA-IR (mg/dL) |
3.3 (2.03-5.13) |
3.2 (2.1-5.63) |
3.9 (2.5-6) |
0.126 |
|
*Kruskal Wallis Test |
||||
Optimal cut-off values of ALT and AST parameters were calculated by ROC (Receiver Operating Characteristic) analysis. The areas under the curve (AUC) of ALT and AST for all patients with NAFLD were 0.986 and 0.962, respectively (Figure 1). The AUC values for ALT and AST were 0.980 and 0.951 in females with NAFLD, and 0.996 and 0.977 in males, respectively. These values showed that ALT and AST are strong diagnostic biomarkers for NAFLD. In addition, the optimal cut-off values for ALT and AST for all patients with NAFLD were 31.5 and 26.5, respectively; 23.5 and 24.5 for females with NAFLD, respectively and for males, it was 37.0 and 29.5, respectively. While 94.4% of all children with NAFLD could be predicted correctly with ALT, 2.4% were predicted incorrectly. In females with NAFLD, the sensitivity of ALT was 93.8% and the specificity was 93.5%; in males, it was 98.3% and 96.6%, respectively. A blood ALT level of ≥37 U/L in obese males and ≥23.5 U/L in obese females was found to be a strong diagnostic biomarker in determining the presence of NAFLD.
DISCUSSION
In this study, the TC, LDL-C, non-HDL-C, TG, insulin, HbA1c and HOMA-IR values were found to be significantly higher in patients with NAFLD compared to patients without. Hazer et al. reported similar findings in their study.11 Jimenez-Rivera et al. found that only TG elevation in blood lipids was significant in obese children with NAFLD compared to non-obese children and they reported that the elevation of TC, LDL-C and non-HDL-C was not significant.12 On the other hand, Öz et al. found that a one-unit increase in the HOMA-IR score in obese children increased the risk of NAFLD by 1.35 times.13 In Tunç's study, significantly higher insulin levels and HOMA-IR were found in the group with NAFLD compared to the group without.14 In addition, a positive correlation was found between the level of HOMA-IR and the severity of NAFLD. These findings suggest that hyperlipidemia and blood sugar irregularity are important risk factors in the development of NAFLD.
The frequency of dyslipidemia (increased TG and LDL-C levels and decreased HDL-C levels), which is an important risk factor for NAFLD, is increased in obese patients.15 In this study, as the TG levels of the patients increased, there was a significant decrease in HDL-C levels (dyslipidemia) and the frequency of NAFLD increased. Toledo et al. found an increase in serum TG levels and a decrease in HDL-C levels in patients with moderate and severe NAFLD compared to the healthy control group.16 Nigam et al. reported that TC, LDL-C and TG levels were higher and HDL-C levels were lower in patients with NAFLD compared to those without.17 Şenyiğit et al. concluded that there was an increase in serum LDL-C and TG levels, and a decrease in HDL-C levels in the group with NAFLD compared to the group without.18 These findings support the opinion that dyslipidemia is an important risk factor for NAFLD.
NASPGHAN guidelines recommend ALT as the best screening test for NAFLD in children. These guidelines recommend ALT ≥ 80 U/L on initial screening or twice the upper limit of normal on repeat screening (ALT ≥ 44 U/L for females and ALT ≥ 52 U/L for males).19 Elizabeth et al.20 reported the optimal cut-off value of ALT for the diagnosis of NAFLD as 30 U/L in females and 42 U/L in males. In this study, the optimal cut-off value of ALT for the diagnosis of NAFLD was found to be lower than the literature, and it was found that it provides good diagnostic accuracy in determining the diagnosis of NAFLD with high sensitivity and specificity.
As a result of the change in the hypothalamo-pituitary axis due to the increased adipose tissue in obese patients, the leptin level increases and the increased leptin causes abnormal TSH secretion. Excess secretion of TSH causes an increase in the amount of fat.21 Torun et al. reported that there was a significant increase in TSH levels as the degree of the fatty liver increased in obese children, but there was no significant difference in free T3 (triiodothyronine) and fT4 levels.22 In their study of 332 obese children Kaltenbach et al. reported that the TSH level was significantly higher in the NAFLD group than in the non-NAFLD group, and there was no significant difference in T3 and T4 levels.23 Pacifico et al. reported that there was a significant increase in TSH levels in children with NAFLD compared to those without, and there was no significant difference in T3 and T4 levels.24 These results suggest that obese children with NAFLD may have increased leptin and TSH levels due to increased adipose tissue. In our study, unlike the literature, it was found that the T4 level was significantly higher in children with NAFLD than those without, and there was no significant difference in TSH level.
CONCLUSION
NAFLD continues to be an important cause of morbidity in children and adolescents with its increasing prevalence. High BWH, ALT, TC, LDL-C, non-HDL-C, TG, insulin and HOMA-IR levels were found to be associated with NAFLD. Detection of ALT elevation in routine blood tests in obese children should be a warning for the development of NAFLD.
ETHICAL APPROVAL:
Ethics Committee approval was received from the Ethics Committee of Kastamonu University Faculty of Medicine (No. 2020-KAEK-143-100, dated June 23, 2021).
PATIENTS’ CONSENT:
Because this study was retrospective, the condition of patients’ consent was waived.
CONFLICT OF INTEREST:
The authors declared no conflict of interest.
AUTHORS’ CONTRIBUTION:
EC: Carried out the conception and design of the research, drafted the manuscript, and carried out the analysis and interpretation of data.
FCI: Performed the statistical analysis.
EE, EY: Participated in the acquisition of data.
REFERENCES
- Tiniakos DG, Vos MB, Brunt EM. Nonalcoholic fatty liver disease: pathology and pathogenesis. Annu Rev Pathol 2010; 5(5):145-71. doi: 10.1146/annurev-pathol-121808- 102132.
- Shah J, Okubote T, Alkhouri N. Overview of Updated Practice Guidelines for Pediatric Nonalcoholic Fatty Liver Disease. Gastroenterol Hepatol (NY) 2018; 14:407-14. PMCID: PMC6111502.
- Doycheva I, Issa D, Watt KD, Lopez R, Rifai G, Alkhouri N. Nonalcoholic Steatohepatitis is the Most Rapidly Increasing Indication for Liver Transplantation in Young Adults in the United States. J Clin Gastroenterol 2018; 52:339-346 doi: 10.1097/MCG.0000000000000925.
- Chen LH, Liang L, Fang YL, Wang YM, Zhu WF. Fish oil improves lipid profile in juvenile rats with intrauterine growth retardation by altering the transcriptional expression of lipid-related hepatic genes. J Matern Fetal Neonatal Med 2016; 29: 3292-8 doi: 10.3109/14767058. 2015.1123244.
- Vajro P, Lenta S, Socha Pet. Diagnosis of nonalcoholic fatty liver disease in children and adolescents: position paper of the ESPGHAN Hepatology committee. J Pediatr Gastroenterol Nutr 2012; 54(5):700-713. doi: 10.1097/ MPG.0b013e318252a13f.
- Fang YL, Chen H, Wang CL, Liang L. Pathogenesis of non-alcoholic fatty liver disease in children and adolescence: From ‘’two hit theory’’ to ‘’multiple hit model.’’ World J Gastroenterol 2018; 24(27):2974-83. doi: 10.3748/wjg. v24.i27.2974.
- Iqbal U, Perumpail BJ, John N. Judicious use of lipid lowering agents in the management of NAFLD. Diseases 2018; 6: 87. doi: 10.3390/diseases6040087.
- Pei K, Gui T, Kan D, Feng H, Jin Y, Yang Y, et al. An overview of lipid metabolism and nonalcoholic fatty liver disease. BioMed Res Int 2020. doi: 10.1155/2020/ 4020249.
- Virani SS. Non-HDL cholesterol as a metric of good quality of care: Opportunities and challenges. Tex Heart Inst J 2011; 38:160-2. PMID: 21494527.
- Kurtoğlu S, Hatipoğlu N, Mazıcıoğlu M, Kendirici M, Keskin M, Kondolot M. Insulin resistance in obese children and adolescents: HOMA-IR cut-off levels in the prepubertal and pubertal periods. J Clin Res Pediatr Endocrinol 2010; 2:100-6. doi: 10.4274/jcrpe.v2i3.100.
- Illian AN, Collin CJ. Disorders of lipoprotein metabolism and transport. In: Kliegman RM, St. Geme J, editors. Nelson Textbook of Pediatrics. 20th Edition volüme, 1st Edition. Philadelphia: John F. Kennedy Blvd; 2016. p.691-705.
- Hazer İ, Kabukçu H.O, Yağcı M, Ertürk Z, Kılıç Yıldırım G, Kirel B. Obez çocuklarda lipid metabolizması ile non-alkolik yağlı karaciğer hastalığı ilişkisi. Türk Pediatri Arşivi 2020; 55(3):263-9. doi: 10.14744/TurkPediatriArs.2020. 65148.
- Jimenez-Rivera C, Hadjiyannakis S, Davila J, Hurteau J, Aglipay M, Barrowman N, et al. Prevalence and risk factors for non-alcoholic fatty liver in children and youth with obesity. BMC Pediatr 2017; 17:113. doi: 10.1186/ s12887-017-0867-z.
- Öz Ö.E, Yazar H Yüksek lisans tezi. Non-alkolik karaciğer yağlanması ve HOMA indeks ilişkisinin retrospektif olarak araştırılması. Sakarya Üniversitesi Sağlık Bilimleri Enstitüsü 2019.
- Tunç S. Obez çocuk ve adölesanlarda yağlı karaciğer hastalığı ile ilişkili risk faktörlerinin değerlendirilmesi: tek merkez deneyimi. Van Tıp Dergisi 2021; 28(2): 171-7. doi: 10.5505/vtd.2021.69862.
- Dowla S, Aslibekyan S, Goss A, Fontaine K, Ashraf AP. Dyslipidemia is associated with pediatric nonalcoholic fatty liver disease. J Clin Lipidol 2018; 12:981-7. doi: 10.1016/j.jacl.2018.03.089.
- Toledo FG, Sniderman AD, Kelley DE. Influence of hepatic steatosis (fatty liver) on severity and composition of dyslipidemia in type 2 diabetes. Diabetes Care 2006; 29:1845-50. doi: 10.2337/dc06-0455.
- Nigam P, Bhatt SP, Misra A ve ark. Non-alcoholic fatty liver disease is closely associated with sub-clinical inflammation: a case-control study on Asian Indians in North India. PLoS One 2013; 8:e49286. doi: 10.1371/journal.pone.0049286.
- Şenyiğit A, Orhanoğlu T, Yaprak B. Non-alkolik yağlı karaciğer (NAYK) hastalığının derecelerinin ve olası biyobelirteçlerinin incelenmesi. Anadolu Kliniği Tıp Bilimleri Dergisi 2018; 23:2. doi:10.21673/anadoluklin.370144.
- Alisi A, Cianfarani S, Manco M, Agostoni C, Nobili V. Nonalcoholic fatty liver disease and metabolic syndrome in adolescents: Pathogenetic role of genetic background and intrauterine environment. Ann Med 2012; 44: 29-40. doi: 10.3109/07853890.2010.547869.
- Reinehr T. Obesity and thyroid function. Mol Cell Endocrinol 2010; 316:165-7. doi: 10.1016/j.mce.2009.06. 005.
- Torun E, Özgen İ.T, Gökçe S, Aydın S, Cesur Y. Thyroid hormone levels in obese children and adolescents with non-alcoholic fatty liver disease. J Clin Res Pediatr Endocrinol 2014; 6(1):34-9. doi: 10.4274/Jcrpe.1155.
- Kaltenbach T.E-M, Graeter T, Oeztuerk S ve ark. Thyroid dysfunction and hepatic steatosis in overweight children and adolescents. Pediatric Obesity 2017; 12:67-74. doi: 10.1111/ijpo.12110.
- Pacifico L, Bonci E, Ferraro F, Andreoli G, Bascetta S, Chiesa C. Hepatic steatosis and thyroid function tests in overweight and obese children. Int J Endocrinol 2013. doi: 10.1155/2013/381014.