rs719725 Polymorphism and Colorectal Cancer Susceptibility: A Meta-analysis
By Xin Zhou1, Aijun Chen1, Tingting Zhang2Affiliations
doi: 10.29271/jcpsp.2023.05.566ABSTRACT
Many studies have suggested an association between 9p24 rs719725 polymorphism and colorectal cancer (CRC) risk, but with inconsistent results. This meta-analysis aimed to summarise the overall association of rs719725 polymorphism with CRC risk. Nine eligible articles with 21 case-control studies (16015 CRC patients and 19341 controls) on the rs719725 polymorphism and CRC susceptibility from four electronic databases (Web of Science, PubMed, SinoMed, and EMBASE) were retrieved and analysed. The association was evaluated with publication bias, pooled OR (odds ratio), and corresponding 95% CI (confidence interval). The pooled results indicated a significant association between the increased CRC risk and rs719725 polymorphism in dominant ([OR] 1.220, [95%CI] 1.161-1.282), recessive (1.166, 1.102-1.234), allele (1.142, 1.102-1.184), homozygous (1.306, 1.212-1.406), and heterozygous (1.18, 1.129-1.234) genetic models. The ethnicity-stratified analyses found a consistently significant association. In the stratification analysis with the source of controls, such significant association was also detected amid the population-based studies under the four former genetic models. Taken together, this meta-analysis indicates that rs719725 genetic variants are associated with an increased risk of CRC among Caucasians and population-based studies. Further relevant research is warranted to confirm these findings.
Key Words: Colorectal cancer, rs719725, Polymorphism, Meta-analysis, Stratification analysis.
INTRODUCTION
Colorectal cancer (CRC) is no doubt one of the most frequently diagnosed malignancies with no gender predisposition and is the third leading cause of cancer-related mortality in recent years worldwide.1 Biological and epidemiological investigations have demonstrated that CRC is a serious and complex disease resulting from both environmental and genetic factors. Molecular epidemiological studies have largely proved that single nucleotide polymorphisms in genes play a vital role in colorectal carcinogenesis and progression, despite its unclear pathogenesis at present.2,3 Genome-wide association studies have recognised the responsibility of genetic factors hold for 33% of CRC cases across the globe.4,5 Among the variants, the single nucleotide polymorphism rs719725 located at the 9p24 locus, has been of great interest in the development of various CRCs.6 Originally identified in a genome-wide association study and thereafter replicated in a candidate gene association study,7,8
The nucleotide 9p24 rs719725 lies within a gene in the presence of several genes nearby. These genes are TPD52L3 (the gene most proximal to this polymorphism), interleukin 33, UHRF2, and glycine dehydrogenase.8 The associations of rs719725 with colorectal tumours may attribute to the linkage disequilibrium between the true susceptibility allele(s) at neighbouring polymorphisms and genetic markers.9 Beyond its reportedly potential competence in risk identification, the rs719725 has been pointed out to be significantly associated with the time to recurrence in CRC patients receiving adjuvant therapy.
Over the past few years, evidence from a range of case-control studies has emerged to helpfully interpret the association between the rs719725 polymorphism and CRC risk, but discouragingly with inconsistent and inconclusive findings. This may be partially on account of the presence of insufficient power, small effect on CRC risk from the polymorphism, phenotypic heterogeneity, population stratification, and publication bias. Therefore, with the increasing investigations and related reports, the aim of this meta-analysis of the publications was to analyse the relationship between the rs719725 polymorphism and CRC susceptibility.
METHODOLOGY
The enrolled articles in this meta-analysis were obtained by searching the four online databases, Web of Science, PubMed, SinoMed (Chinese Biomedical Literature Database), and EMBASE, without language restriction. Keywords focusing on chromosome 9p24 (e.g., 9p24, rs719725) along with words relating to CRC/colorectal adenoma (e.g., colorectal cancer, colorectal adenoma, colorectal neoplasm, rectal cancer, colon cancer, or colorectal adenomatous polyps) were used as search term combinations. The latest included study, as of the initiation of this meta-analysis, was published on March 3, 2022. All references in each included article were searched manually for additional literature of relevance.
Cohort or case-control studies investigating the association between CRC risk and rs719725 polymorphism, enriched with sufficient data for calculating the ORs (odds ratios) and corresponding CIs (confidence intervals) and genotype frequencies complying with Hardy-Weinberg equilibrium (HWE) in controls, were enrolled into the meta-analysis. Abstracts, review articles, case reports or case-only studies, or the studies not concerning cancer risk, or studies with no available data were excluded from this meta-analysis.
Two investigators (Zhou and Chen) independently performed the screening and data extraction of all candidate publications. Any disagreements during data collection were resolved via discussion with the third author (Zhang). The data from each eligible study involved year of publication, first author’s surname, country, origin, ethnicity, cancer type, genotype frequency, genotyping methods, source of controls, number of controls or CRC cases, and the evidence of HWE among controls.
STATA 12.0 software (Stata Corp., United States) was applied for all statistical analyses. HWE of genotype distribution among the controls was assessed in each study using the χ2 goodness-of-fit test, with a significant deviation from HWE (set at p <0.01). The strength of the target association was evaluated with OR (95% CI). The statistical significance of pooled ORs was evaluated by the Z test. The association was measured based on five different genetic models, dominant (AA+AC vs. CC), recessive (AA vs. AC+CC), allele (A vs. C), heterozygote (AC vs. CC), and homozygote (AA vs. CC) models. The heterogeneity among eligible studies was evaluated using both I2 statistics and Cochran’s Q test. The random-effects model with the DerSimonian-Laird approach was applied to calculate the pooled OR in the presence of statistical heterogeneity (p <0.1 or I2 ≥50%) among included studies.10 While a fixed-effects model with the Mantel-Haenszel method was used in the absence of statistical heterogeneity.11 The source of controls and ethnicity were taken for subset stratification analysis. The potential publication bias was evaluated by Egger's linear regression test along with Begg’s funnel plot.12 The influence of one study on the pooled OR and corresponding 95% CI was investigated through sensitivity analyses.13
RESULTS
A total of nine eligible publications with 21 case-control studies (including 16015 CRC patients and 19341 controls) were finally included in this meta-analysis.6-8,14-19 The main characteristics and genotype distribution are summarised in Table I. The enrolled studies were published between August 2007 and August 2020 in international journals. Of these, there were five studies conducted on the Asian population, 15 on the Caucasian population, and 1 on a population with mixed ethnicity. The genotype distribution of the rs719725 polymorphism was consistent with HWE in the control population in the 21 eligible studies. Figure 1 exhibits the literature selection process.
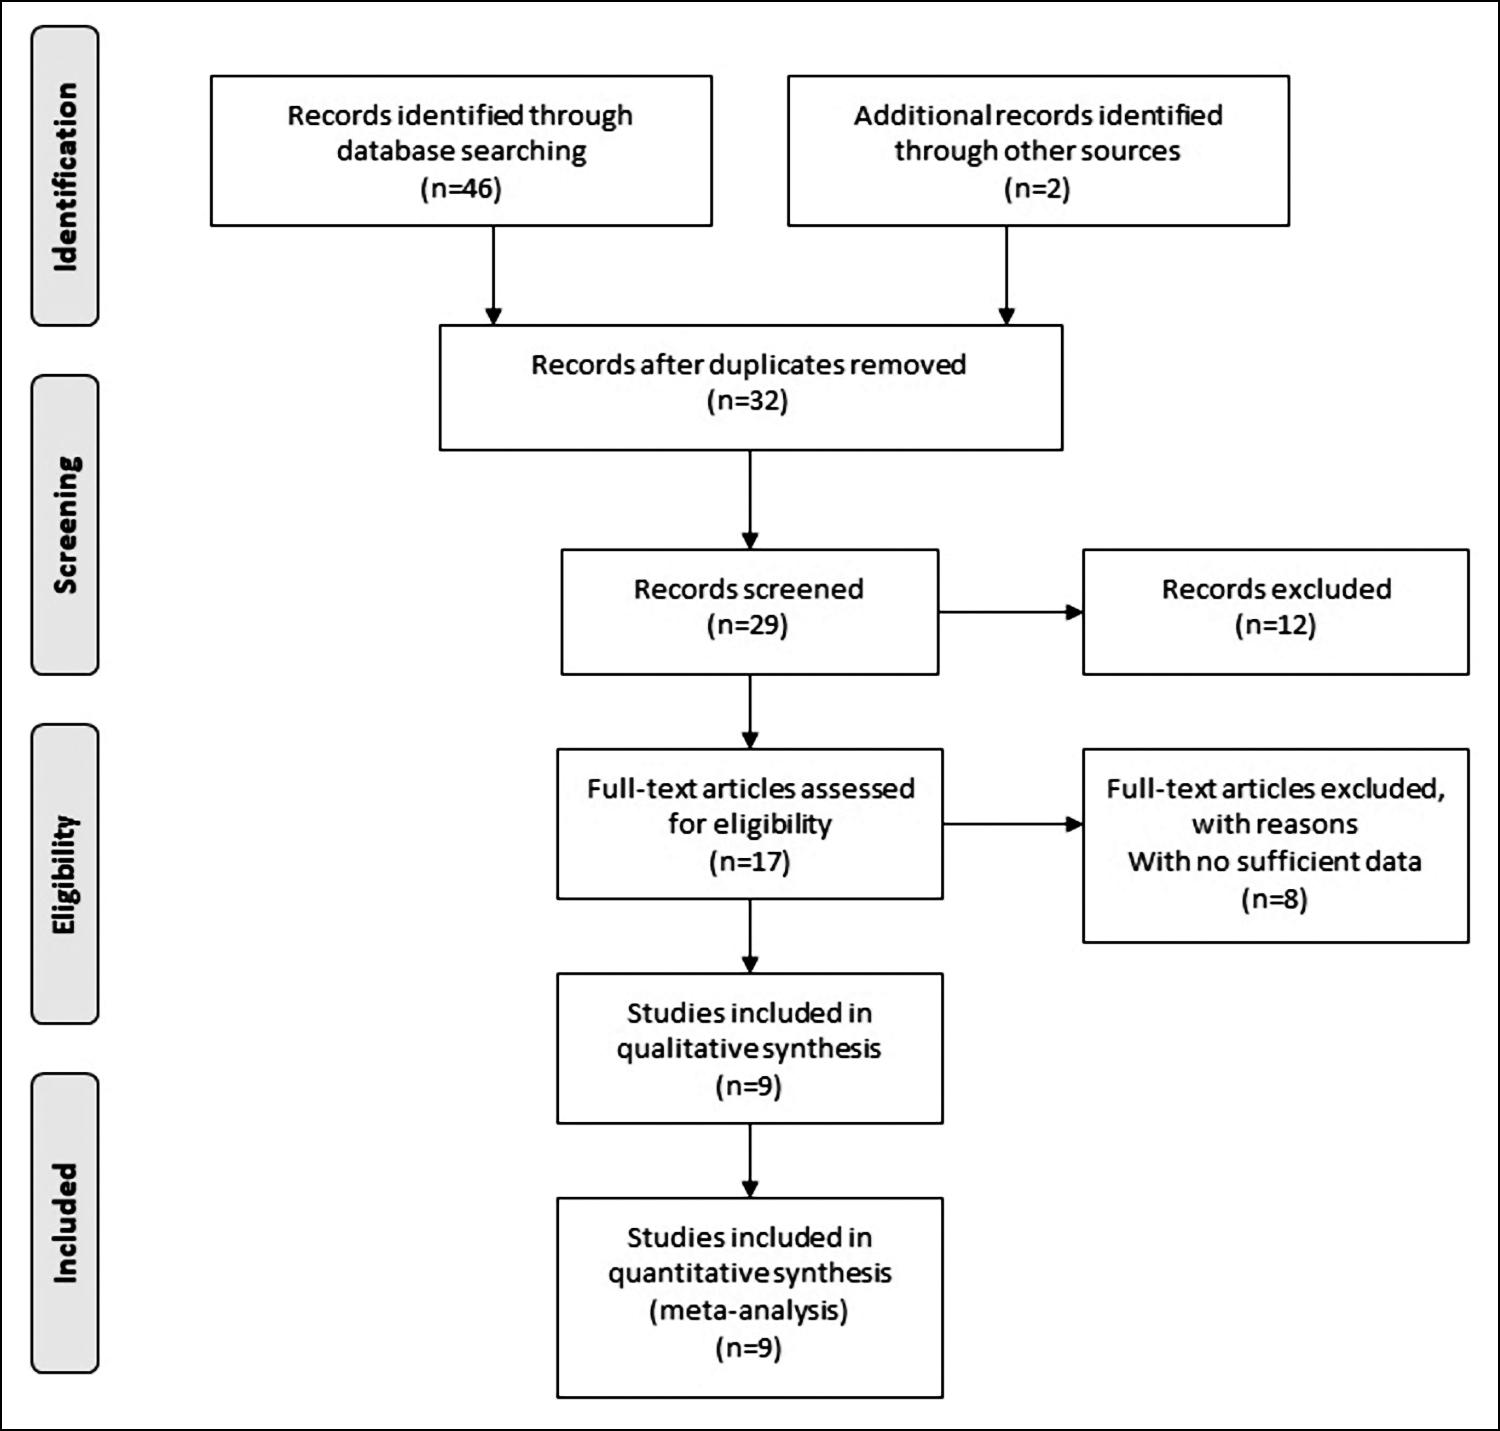 Figure 1: Flow chart of the selection process.
The main results for the association between CRC risk and the rs719725 polymorphism are shown in Table II. The pooled results indicated a significant association between the increased CRC risk and the rs719725 polymorphism in all five genetic models, namely, dominant (AA+AC vs. CC, [OR] 1.220, [95%CI] 1.161-1.282), recessive (AA vs. AC+CC, 1.166, 1.102-1.234), allele (A vs. C, 1.142, 1.102-1.184), homozygous (AA vs. CC, 1.306, 1.212-1.406), and heterozygous (AC vs. CC, 1.18, 1.129-1.234) models (Figure 2). In the ethnicity-stratified subset analysis (in the Asian and Caucasian populations), the pooled ORs indicated the existence of a similar significant association among Caucasians (A vs. C, 1.065, 1.028-1.104; AA vs. CC, 1.123, 1.041-1.211; AA vs. AC+CC, 1.090, 1.036-1.146; AA+AC vs. CC, 1.079, 1.006-1.158). After taking the source of controls into stratification analysis, the same significant associations were detected in the population-based studies under four genetic models (A vs. C, 1.052, 1.017-1.088; AA vs. CC, 1.109, 1.032-1.192; AA vs. AC+CC, 1.061, 1.011-1.113; AA+AC vs. CC, 1.089, 1.024-1.158).
Begg’s funnel plot was created to detect potential publication bias. Its symmetrical shape shown in Figure 3 suggested the absence of publication bias in the enrolled studies. The reliability of the findings was evaluated through leave-one-out sensitivity analyses (by sequentially removing any one study at a time). As shown in Figure 4, no substantial alteration in the statistical results, when any single enrolled study was removed, which demonstrated the reliability of the authors findings.
Table I: Characteristics of enrolled studies in the meta-analysis.
|
Author (Year) |
Country |
Ethnicity |
Genotyping |
Cases (n) |
Controls (n) |
Sample Origin |
Genotypes of Cases (n) |
Genotypes of Controls (n) |
HWE |
||||
|
CC |
AC |
AA |
CC |
AC |
AA |
||||||||
|
Kim (2020) |
Korea |
Asia |
MassARRAY |
691 |
1396 |
PB |
102 |
323 |
266 |
192 |
626 |
578 |
Y |
|
Li (2012) |
China |
Asia |
MassARRAY |
223 |
225 |
HB |
18 |
90 |
115 |
22 |
104 |
99 |
Y |
|
D. Kocarnik (WHI) (2010) |
America |
Caucasian |
MassARRAY |
619 |
637 |
HB |
75 |
281 |
263 |
92 |
310 |
235 |
Y |
|
D. Kocarnik (DALS) (2010) |
America |
Caucasian |
MassARRAY |
1453 |
1790 |
PB |
207 |
659 |
587 |
258 |
808 |
724 |
Y |
|
Win (2013) |
America/ Canada/ Australia |
Caucasian |
MassARRAY |
327 |
736 |
PB/HB |
40 |
145 |
142 |
92 |
337 |
307 |
Y |
|
Holst (2010) |
Sweden |
Caucasian |
TaqMan |
1724 |
1719 |
PB |
231 |
821 |
672 |
253 |
797 |
669 |
Y |
|
Poynter (PB) (2007) |
America/ Australia |
Mixed |
MassARRAY |
1285 |
2122 |
PB |
157 |
630 |
498 |
319 |
992 |
811 |
Y |
|
Poynter (Clinic-based) (2007) |
America/ Australia |
Mixed |
MassARRAY |
277 |
491 |
HB |
35 |
140 |
102 |
68 |
241 |
182 |
Y |
|
Abe (Derivation study) (2017) |
Japan |
Asia |
TaqMan |
558 |
1116 |
HB |
58 |
255 |
245 |
132 |
506 |
478 |
Y |
|
Abe (Replication study) (2017) |
Japan |
Asia |
TaqMan |
547 |
547 |
HB |
68 |
277 |
202 |
69 |
257 |
221 |
Y |
|
Zanke (Ontario) (2007) |
Canada |
Caucasian |
Affymetrix GeneChip |
1148 |
1179 |
PB |
138 |
502 |
508 |
159 |
581 |
439 |
Y |
|
Zanke (Newfoundland) (2007) |
Canada |
Caucasian |
Affymetrix GeneChip |
436 |
362 |
PB |
66 |
208 |
162 |
64 |
156 |
142 |
Y |
|
Zanke (Seattle) (2007) |
America |
Caucasian |
Affymetrix GeneChip |
685 |
691 |
PB |
83 |
324 |
278 |
101 |
337 |
253 |
Y |
|
Zanke (Scotland 3) (2007) |
Scotland |
Caucasian |
Illumina GeneChip |
880 |
900 |
PB |
117 |
410 |
353 |
139 |
447 |
314 |
Y |
|
Zanke (Scotland 4) (2007) |
Scotland |
Caucasian |
TaqMan |
1912 |
1969 |
PB |
264 |
895 |
753 |
301 |
955 |
713 |
Y |
|
Zanke (France/Nantes) (2007) |
France |
Caucasian |
Illumina GeneChip |
1038 |
1101 |
PB |
165 |
510 |
363 |
175 |
537 |
389 |
Y |
|
Zanke (France/Familial) (2007) |
France |
Caucasian |
Illumina GeneChip |
379 |
547 |
PB |
60 |
175 |
144 |
78 |
249 |
220 |
Y |
|
Zanke (EPIC) (2007) |
Europe |
Caucasian |
Illumina GeneChip |
764 |
766 |
PB |
121 |
354 |
289 |
108 |
379 |
279 |
Y |
|
Curtin (UK-Sheffield) (2009) |
United Kingdom |
Caucasian |
SNPlex |
397 |
400 |
PB |
56 |
193 |
148 |
49 |
202 |
149 |
Y |
|
Curtin (UK-Leeds) (2009) |
United Kingdom |
Caucasian |
SNPlex |
244 |
216 |
PB |
30 |
98 |
116 |
31 |
99 |
86 |
Y |
|
Curtin (Utah) (2009) |
America |
Caucasian |
SNPlex |
428 |
431 |
PB |
62 |
203 |
163 |
72 |
189 |
170 |
Y |
|
HB = Hospital-based; PB = Population-based, HWE = Hardy-Weinberg equilibrium, Y = Yes. |
|||||||||||||
Table II: Main results of five genetic models in the meta-analysis.
|
|
Allele A vs. C |
Homozygous AA vs. CC |
Heterozygous AC vs. CC |
Recessive AA vs. AC+CC |
Dominant AA+AC vs. CC |
|||||||||||||||
|
Variables (n) |
OR (95% CI) |
Z |
P |
I2 (%) |
OR (95% CI) |
Z |
P |
I2 (%) |
OR (95% CI) |
Z |
P |
I2 (%) |
OR (95% CI) |
Z |
P |
I2 (%) |
OR (95% CI) |
Z |
P |
I2 (%) |
|
Total (21) |
1.054 (1.022, 1.087) |
2.08 |
0.005 |
21.9 |
1.115 (1.043, 1.191) |
3.22 |
0.001 |
0 |
1.068 (1.001, 1.139) |
2.0 |
0.046 |
0 |
1.062 (1.017, 1.109) |
2.74 |
0.006 |
34 |
1.089 (1.024, 1.158) |
2.73 |
0.006 |
0 |
|
Asian (4) |
0.987 (0.908, 1.072) |
0.31 |
0.755 |
38.1 |
0.992 (0.827, 1.191) |
0.08 |
0.935 |
0 |
1.051 (0.878, 1.258) |
0.54 |
0.586 |
0 |
0.965 (0.861, 1.082) |
0.61 |
0.534 |
44 |
1.024 (0.863, 1.214) |
0.27 |
0.789 |
0 |
|
Caucasian (15) |
1.065 (1.028, 1.104) |
3.47 |
0.001 |
21.1 |
1.123 (1.041, 1.211) |
2.99 |
0.003 |
0 |
1.045 (0.971, 1.126) |
1.17 |
0.241 |
0 |
1.090 (1.036, 1.146) |
3.34 |
0.001 |
32.6 |
1.079 (1.006, 1.158) |
2.14 |
0.032 |
0 |
|
Population-based (15) |
1.052 (1.017, 1.088) |
2.93 |
0.003 |
30.8 |
1.109 (1.032, 1.192) |
2.81 |
0.005 |
11 |
1.063 (0.991, 1.140) |
1.17 |
0.087 |
0 |
1.061 (1.011, 1.113) |
2.43 |
0.015 |
40.2 |
1.089 (1.024, 1.158) |
2.36 |
0.018 |
0 |
|
Hospital-based (5) |
1.067 (0.983, 1.159) |
1.56 |
0.119 |
24 |
1.162 (0.968, 1.396) |
1.61 |
0.107 |
0 |
1.116 (0.932, 1.336) |
1.20 |
0.232 |
0 |
1.069 (0.955, 1.197) |
1.46 |
0.246 |
42 |
1.139 (0.960, 1.352) |
1.49 |
0.136 |
0 |
|
OR = Odds ratio, CI = Confidence interval. |
||||||||||||||||||||
DISCUSSION
Genetics have been reported to serve a dominant role in colorectal carcinogenesis and progression. Since single nucleotide polymorphisms account for most human genetic variation, their connection to individual CRC risk has gained considerable attention. Inconsistent findings were reported in recent epidemiological studies on the relationship between CRC risk and rs719725 polymorphism. Zanke et al., and Kocarnik et al., pointed out an association of rs719725 polymorphism with the increased risk of CRC.7,17 While later research by Curtin et al., Holst et al., and Kim et al., failed to detect any such association. Thus, the authors performed this up-to-date meta-analysis to obtain a comprehensive conclusion.14-16
To the authors’ knowledge, this work is a new meta-analysis within at least the last ten years to evaluate the relationship between CRC risk and rs719725 polymorphism. This meta-analysis critically retrieved all the relevant published studies and ultimately selected 21 eligible case-control studies comprising 16015 CRC patients and 19341 healthy controls. This meta-analysis finally found a significant association between an increased CRC risk and rs719725 polymorphism. In the ethnicity-stratified subset analysis, rs719725 polymorphism was also detected to be significantly associated with the increased incidence of CRC among Caucasians. However, no such association was detected in the Asian population. Such results may be partially on account of a limited number of studies involving Asians. After stratification analysis with the sources of controls, the same significant association was detected among the population-based studies. The sensitivity analyses further confirmed the significance of the above-detected associations. In addition, no significant publication bias was detected in the meta-analysis.
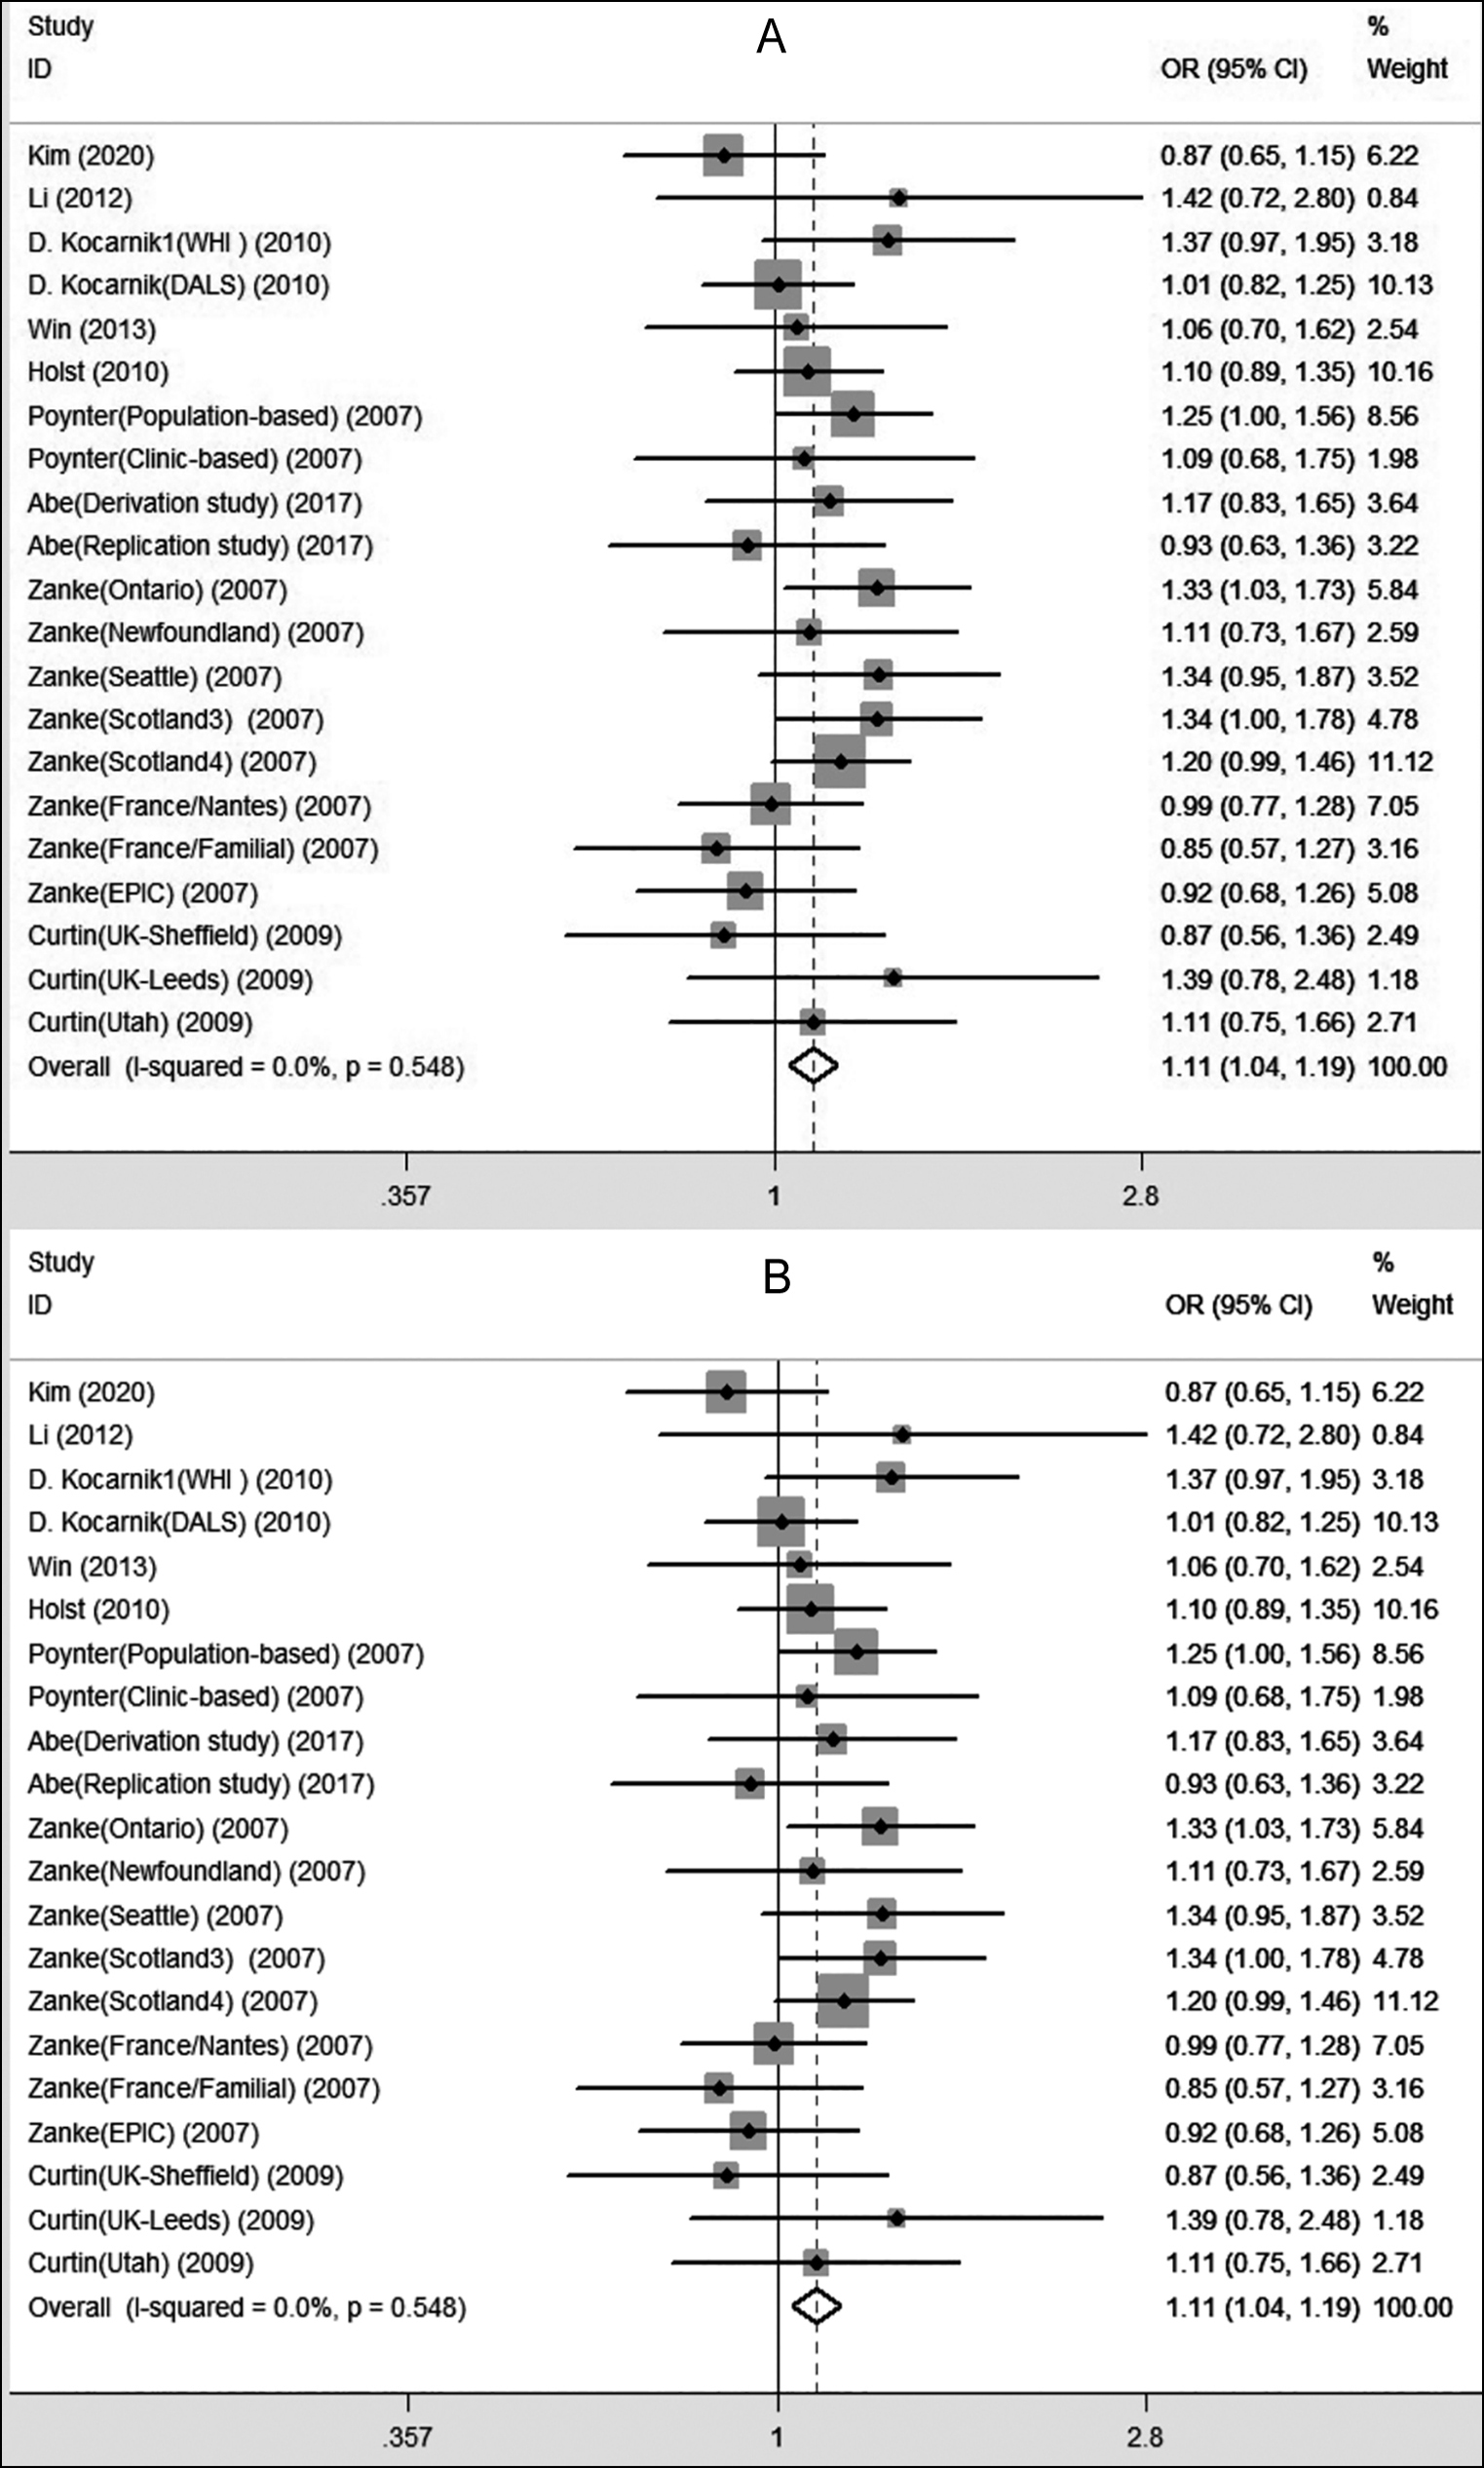 Figure 2: Forest plots for the rs719725 polymorphism and colorectal cancer risk ((A): AA vs. CC; (B): AA vs. AC+CC).
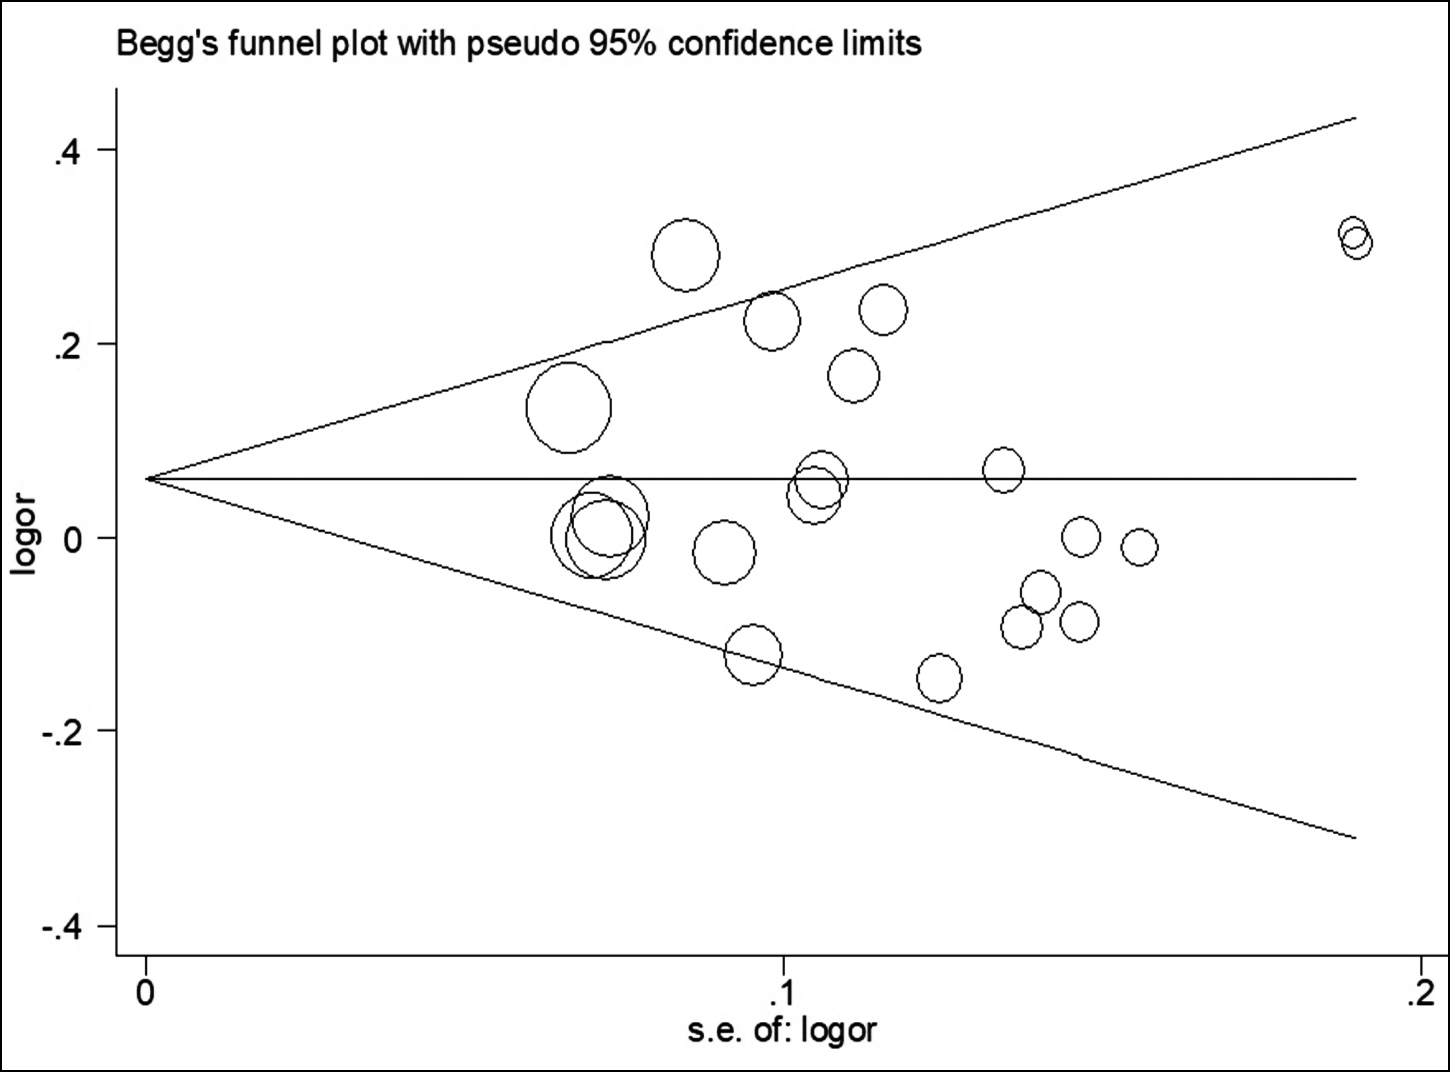 Figure 3: Begg’s funnel plot for assessing potential publication bias (AA vs. AC+CC).
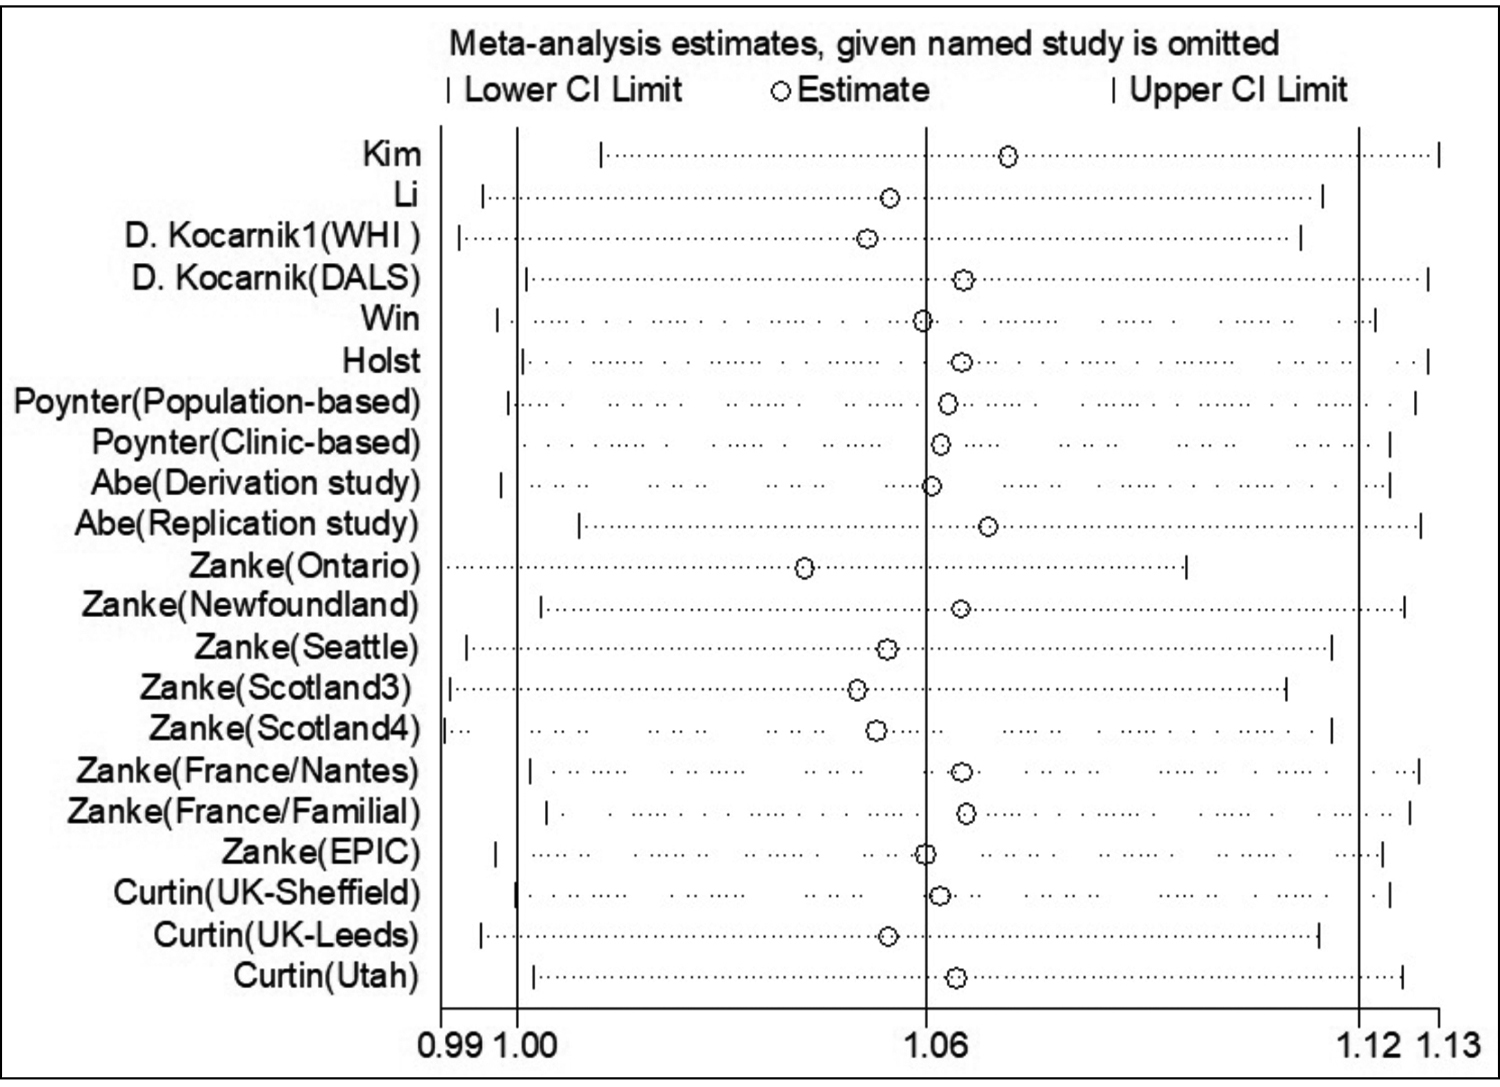 Figure 4: Sensitivity analysis (AA vs. AC+CC).
Several mutations in oncogenes and tumour suppressor genes, predominantly in adenomatous polyposis coli (APC), Kirsten-ras, and p53 are contributable to a sizeable fraction of CRC.20-22
The tumour suppressor gene APC has been determined to be a major contributor to hereditary CRC.23 Various SNPs in APC have been observed in CRC. Huang et al. in their case control study observed a significant difference in genotype frequency for the rs2019720 polymorphism in APC between CRC and normal control (p = 0.004), indicating this SNP might be correlated with the susceptibility to CRC in the Chinese Han population.24 In the same racial population, Ying et al. found the rs1804194 polymorphism in APC and its interactions with body mass index and smoking are associated with CRC risk in the dominant and recessive models (all p <0.001).25 In this meta-analysis, the strength of the association between genotype frequency and CRC risk in all genetic models indicated a powerful conclusion.
Notably, consideration of some limitations should be given when interpreting the meta-analysis. First, potential publication bias may still be an issue when without including the unpublished data and ongoing studies in the meta-analysis, even though the statistical test did not indicate such bias. Second, the ethnicity-stratified subset analysis was limited to the Caucasian and Asian populations, thus these conclusions may not be extrapolated to other populations. Third, the number of included studies or the subjects in some subsets (especially Asian and hospital-based groups) was relatively small, and insufficient statistical power might produce significant or insignificant associations by chance. Nevertheless, the sample size in this investigation was the largest ever since the initiation of this meta-analysis.
CONCLUSION
This meta-analysis strongly indicates that rs719725 polymorphism is significantly associated with increased CRC risk, particularly among Caucasians. Further investigation on the association across different ethnic populations is warranted.
CoMPETING interest:
The authors declared no competing interest.
AUTHORS’ CONTRIBUTION:
XZ: Designed the study and analysed the data.
XZ, AC: Searched the literature.
XZ, AC, TZ: Collected the data and provided interpretations of the results.
TZ: Drafted the manuscript.
All the authors have approved the final version of the manuscript to be published.
REFERENCES
- Jemal A, Siegel R, Xu J, Ward E. Cancer statistics, 2010. CA Cancer J Clin 2010; 60(5):277-300. doi: 10.3322/caac. 20073.
- Ying H, Wang J, Gao X. CCL5-403, CCR5-59029, and Delta32 polymorphisms and cancer risk: a meta-analysis based on 20,625 subjects. Tumour Biol 2014; 35:5895-904. doi: 10.1007/ s13277-014-1780-9.
- Sun L, Liu J, Yuan Q, Xing C, Yuan Y. Association between PTEN Gene IVS4 polymorphism and risk of cancer: A meta-analysis. PLoS One 2014; 9(6):e98851. doi: 10.1371/ journal.pone.0098851.
- Lichtenstein P, Holm NV, Verkasalo PK, Iliadou A, Kaprio J, Koskenvuo M, et al. Environmental and heritable factors in the causation of cancer-analyses of cohorts of twins from Sweden, Denmark, and Finland. N Engl J Med 2000; 343(2): 78-85. doi: 10.1056/NEJM200007133430201.
- Peng Q, Lao X, Tang W, Chen Z, Li R, Qin X, et al. XPC Lys939Gln polymorphism contributes to colorectal cancer susceptibility: Evidence from a meta-analysis. Diagn Pathol 2014; 9:120. doi: 10.1186/1746-1596-9-120.
- Abe M, Ito H, Oze I, Nomura M, Ogawa Y, Matsuo K. The more from East-Asian, the better: Risk prediction of colorectal cancer risk by GWAS-identified SNPs among Japanese. J Cancer Res Clin Oncol 2017; 143(12):2481-92. doi: 10.1007/ s00432-017-2505-4.
- Zanke BW, Greenwood CM, Rangrej J, Kustra R, Tenesa A, Farrington SM, et al. Genome-wide association scan identifies a colorectal cancer susceptibility locus on chromosome 8q24. Nat Genet 2007; 39(8):989-94. doi: 10.1038/ ng2089.
- Poynter JN, Figueiredo JC, Conti DV, Kennedy K, Gallinger S, Siegmund KD, et al. Variants on 9p24 and 8q24 are associated with risk of colorectal cancer: Results from the Colon Cancer Family Registry. Cancer Res 2007; 67(23): 11128-32. doi: 10.1158/0008-5472.CAN-07-3239.
- Pomerantz MM, Ahmadiyeh N, Jia L, Herman P, Verzi MP, Doddapaneni H, et al. The 8q24 cancer risk variant rs6983267 shows long-range interaction with MYC in colorectal cancer. Nat Genet 2009; 41:882-4. doi: 10. 1038/ ng.403.
- Mantel N, Haenszel W. Statistical aspects of the analysis of data from retrospective studies of disease. J Natl Cancer Inst 1959; 22(4):719-48.
- DerSimonian R, Laird N. Meta-analysis in clinical trials revisited. Contemp Clin Trials 2015; 45:139-45. doi: 10. 1016/j.cct.2015.09.002.
- Harbord RM, Egger M, Sterne JA. A modified test for small-study effects in meta-analyses of controlled trials with binary endpoints. Stat Med 2006; 25(20):3443-57. doi: 10.1002/ sim.2380.
- Jia J, Ren J, Yan D, Xiao L, Sun R. Association between the XRCC6 polymorphisms and cancer risks: A systematic review and meta-analysis. Medicine (Baltimore) 2015; 94(1):e283. doi: 10.1097/MD.0000000000000283.
- Curtin K, Lin WY, George R, Katory M, Shorto J, Cannon-Albright LA, et al. Meta association of colorectal cancer confirms risk alleles at 8q24 and 18q21. Cancer Epidemiol Biomarkers Prev 2009; 18(2):616-21. doi: 10.1158/1055- 9965.EPI-08-0690.
- von Holst S, Picelli S, Edler D, Lenander C, Dalén J, Hjern F, et al. Association studies on 11 published colorectal cancer risk loci. Br J Cancer 2010; 103(4):575-80.doi: 10.1038/sj.bjc.6605774.
- Kim J, Lee J, Oh JH, Chang HJ, Sohn DK, Shin A, et al. Associations among dietary seaweed intake, c-MYC rs6983267 polymorphism, and risk of colorectal cancer in a Korean population: A case-control study. Eur J Nutr 2020; 59(5):1963-74. doi: 10.1007/s00394-019-02046-w.
- Kocarnik JD, Hutter CM, Slattery ML, Berndt SI, Hsu L, Duggan DJ, et al. Characterization of 9p24 risk locus and colorectal adenoma and cancer: Gene-environment interaction and meta-analysis. Cancer Epidemiol Biomarkers Prev 2010; 19(12):3131-9. doi: 10.1158/1055-9965.EPI-10- 0878.
- Li FX, Yang XX, Hu NY, Du HY, Ma Q, Li M. Single-nucleotide polymorphism associations for colorectal cancer in southern chinese population. Chin J Cancer Res 2012; 24(1):29-35. doi: 10.1007/s11670-012-0029-7.
- Win AK, Hopper JL, Buchanan DD, Young JP, Tenesa A, Dowty JG, et al. Are the common genetic variants associated with colorectal cancer risk for DNA mismatch repair gene mutation carriers. Eur J Cancer 2013; 49(7):1578-87. doi: 10.1016/j.ejca.2013.01.029.
- Minde DP, Anvarian Z, Rüdiger SG, Maurice MM. Messing up disorder: How do missense mutations in the tumor suppressor protein APC lead to cancer. Mol Cancer 2011; 10:101. doi: 10.1186/1476-4598-10-101.
- Newton KF, Newman W, Hill J. Review of biomarkers in colorectal cancer. Colorectal Dis 2012; 14(1):3-17. doi: 10.1111/j.1463-1318.2010.02439.x.
- Conlin A, Smith G, Carey FA, Wolf CR, Steele RJ. The prognostic significance of K-ras, p53, and APC mutations in colorectal carcinoma. Gut 2005; 54(9):1283-6. doi: 10. 1136/ gut.2005.066514.
- Nassiri M, Kooshyar MM, Roudbar Z, Mahdavi M, Doosti M. Genes and SNPs associated with non-hereditary and hereditary colorectal cancer. Asian Pac J Cancer Prev 2013; 14(10):5609-14. doi: 10.7314/apjcp.2013.14.10.5609.
- Huang X, Wang Y, Yu T, Liu B, Li X, Li W, et al. Association study of APC polymorphisms with colorectal cancer in Han Chinese. Clin Biochem 2012; 45(18):1669-72. doi: 10. 1016/j.clinbiochem.2012.07.001.
- Ying R, Wei Z, Mei Y, Chen S, Zhu L. APC gene 3'UTR SNPs and interactions with environmental factors are correlated with risk of colorectal cancer in Chinese Han population. Biosci Rep 2020; 40(3): BSR20192429. doi: 10.1042/BSR20 192429.