Relationship of V1 Derivation Biphasic P Waves with Morbidity and Mortality in Myocardial Infarction Cases
By Burak Demirci, Abuzer Coskun, Cilem Bakar, Burak AkinAffiliations
doi: 10.29271/jcpsp.2022.08.963ABSTRACT
Objective: To evaluate the biphasic P (V1bP) wave in lead V1 in terms of three-vessel disease (TVD), bypass, and mortality in patients with acute coronary syndrome.
Study Design: A descriptive study.
Place and Duration of Study: Department of Emergency Medicine, University of Health Sciences, Bagcilar Training and Research Hospital, Turkey, between January 2018 and December 2019.
Methodology: A total of 497 patients were admitted to the emergency department due to acute coronary syndrome. Patients were grouped as the right atrium and the left atrium according to the direction of the V1bP wave. Gensini score (GS), left ventricular ejection fraction (LVEF), TVD, bypass, and mortality rates were compared according to these groups.
Results: According to the atrial involvement of the patients, the median age was 66 (58-74) years, 220 (44.3%) females and 277 (55.7%) males. In the left atrial group in the V1bP wave, anterior myocardial infarction was the most common in 128 (41.8%) patients, mortality in 17 (5.6%), TVD in 69 (22.5%), and bypass in 13 (4.2%) patients. In the right atrial group, it was found that 127 (66.5%) patients had inferior myocardial infarction, 34 (17.8%) mortality, 66 (34.6%) TVD, and 19 (9.9%) bypass TVD; GS was 89 (80-117) points and LVEF was 45 (36-55)%. In addition, a significant relationship was found with mortality (p=0.019), bypass (p<0.001) and complications (p=0.043). Although the variables showed differences in acute coronary syndrome, mortality, LVEF, GS, mild and/or moderate correlations were found.
Conclusion: V1bP wave can be a determining parameter for acute coronary syndromes in terms of TVD, bypass, and mortality.
Key Words: Emergency department, Biphasic p in lead V1, Three-vessel disease, Bypass, Mortality.
INTRODUCTION
Acute coronary syndromes (ACS) are a common diagnosis in the emergency department and cause serious morbidity and mortality. It is important to determine the risk correctly during and after hospitalisation in the emergency department, coronary care unit, while selection of the treatment to be applied. A twelve-lead electrocardiogram (ECG) is a simple non-invasive method to evaluate cardiac function and hemodynamic status.1 The effects of the anatomy and physiology of the atrial cavity on the morphology of the P wave are controversial today. It is stated that right or left atrial hypertrophy, dilatation, and electrical conduction abnormalities cause changes in the P wave. Conditions such as acute coronary syndromes, stable angina, exercise test, or balloon angioplasty may cause changes in P wave morphology.2,3
Only a few studies have been published on the evaluation of biphasic P wave on ECG in patients with acute myocardial infarction (AMI). In addition, little data is linking the results of echocardiography and coronary angiography with the P wave. The aim of this study was to evaluate the relationship of lead V1 biphasic P wave (V1bP) morphology with coronary angiography, three-vessel disease, and bypass in AMI patients.
METHODOLOGY
This retrospectively conducted descriptive study included 497 patients with chest pain over the age of 18 who were admitted to the Department of Emergency Medicine, University of Health Sciences, Bagcilar Education and Research Hospital, Begcilar, Istanbul, Turkey, between January 2018 and December 2019, and hospitalised with the diagnosis of acute myocardial infarction (MI). Patients with ST elevation and non-ST elevation MI, who had a biphasic P wave (V1bP) in lead V1 on their ECG and had echocardiography, coronary angiography, hemogram, biochemistry, lipid profile, and cardiac troponin results, were included in the study. Patients without coronary angiography and echocardiography, sepsis and septic shock, pulmonary thromboembolism, pericarditis and myocarditis, blunt chest trauma, malignancy, chronic kidney failure, cerebrovascular diseases, toxic hepatitis, and chronic liver diseases were excluded from the study.
Biphasic P wave in lead V1 was determined with a simple method. In the ECG, if the area above the isoelectric line is large, right atrium involvement, and if the area below the line is large, left atrial involvement would be considered (Figure 1). According to the amplitude of the first and second parts, all the cases were divided into two groups, 306 left atrial involvement and 191 right atrial involvement.
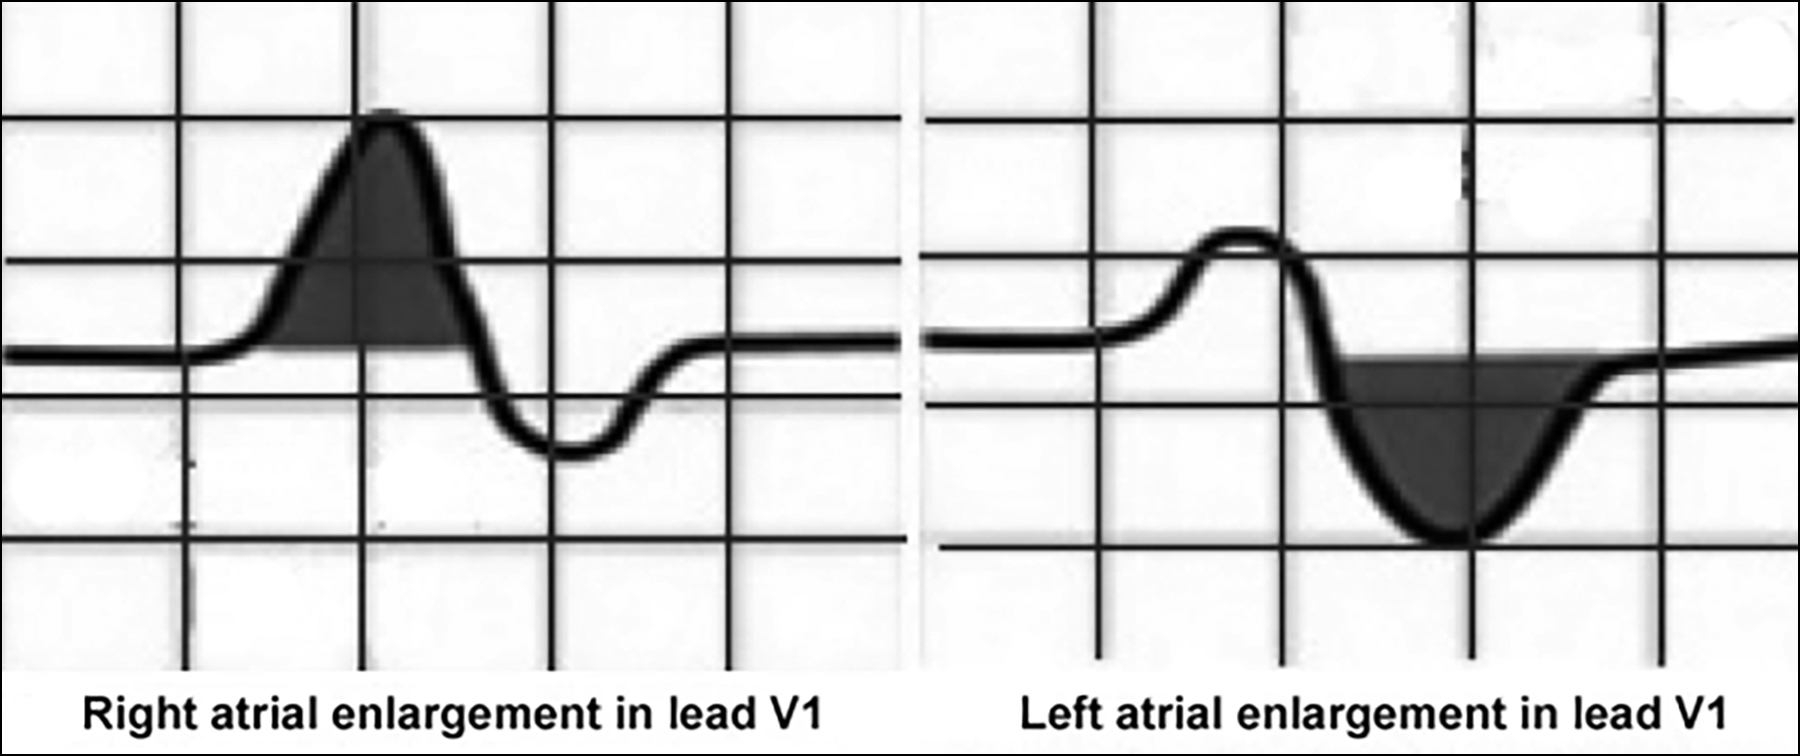 Figure 1: Diagram of right and left atrial ınvolvement in V1 lead biphasic P wave on electrocardiogram paper.
Patients were classified as non-ST elevation MI (NSTEMI) and ST elevation MI (STEMI). STEMI cases were grouped according to the occurrence of inferior, anterior, posterior, lateral, high lateral, and diffuse anterior MI. In addition, two groups were formed according to the presence of three-vessel disease, bypass, and mortality. The characteristics of the bypass cases included left main coronary artery occlusion, triple vessel disease (TVD), failed balloon-stent attempt, and development of cardiogenic shock. According to the complications that developed in the follow-up of the patients after acute coronary syndrome, pulmonary edema, ischemic heart failure, cardiac tamponade/effusion, atrioventricular block, and ventricular tachycardia were determined. Gensini scores (GS) were calculated and recorded according to the angiography results of the patients.
A common definition of MI was used by the World Health Organisation (WHO), the European Society of Cardiology (ESC), and the American Society of Cardiology (AHA).4 The definition of acute MI was jointly decided by emergency medicine and cardiologists. The three-vessel disease was defined as more than 50% occlusion of the right coronary artery, circumflex artery, and left anterior descending artery. Gensini Scoring System (GS) was used to grade the extent and severity of atherosclerosis in the coronary arteries of all the patients. A Gensini score between 1-20 was considered mild coronary atherosclerosis, and a score >20 was considered severe coronary atherosclerosis.5 All the patients included in the study underwent coronary angiography. Coronary angiography was performed via the femoral or radial artery using the standard Judkins technique. Stenosis of ≥50% for the left main coronary artery (LMCA) and ≥70% for other epicardial vessels was considered as severe occlusive coronary artery disease. Gensini scores were calculated to determine the extent of coronary artery disease according to the angiography results of the patients. STAT Elecsys and Cobas e-411 Hitachi Roche analysers were used to measure Cardiac Troponin I (cTn-I). Electrocardiography; 12-lead ECG was performed with Cardiofax ECG-9132K (Nihon Kohden, Tokyo, Japan) at the bedside during admission to the emergency department. Transthoracic echocardiography was performed with Philips Epiq 7 Ultrasound device and left ventricular ejection fractions (LVEF) were evaluated and recorded as a % value.
The data obtained from this study were analysed with the SPSS 20 (SPSS Inc., Chicago, IL, USA) package program. Kolmogorov-Smirnov test was used while investigating the normal distributions of the variables. Nominal variables were shown as the number of cases and percentage (%). In the one-sample Kolmogorov Smirnov test, it was determined that the distribution was not normal in the variables with a significance level of p<0.05 under the assumption of normality. Accordingly, Mann-Whitney U-test, one of the non-parametric tests, was applied for the variables expressed as median and IQR. Chi-square analysis was applied when examining the relationships between nominal variable groups. When interpreting the results, p<0.05 values were considered statistically significant.
The study complied with the Declaration of Helsinki for human research and was approved by the local ethics review board.
RESULTS
The median age of 497 patients included in the study was 66 (58-74) years, and 277 (55.7%) were males and 220 (44.3%) were females. According to the right and left atrial involvement of the patients, there was a significant relationship among white blood cells, mean platelet volume, blood glucose level (p=0.005), cardiac troponin III (p<0.001), GS (p=0.001), and LVEF (p=0.030), was not associated with other parameters (Table I).
Atrial involvement in the biphasic P wave in lead V1 was not associated with gender (p=0.229). While anterior MI was detected most frequently in 128 (41.8%) patients in the left atrial group, posterior MI was not detected. In addition, mortality was observed in 17 (5.6%), TVD in 69 (22.5%), and by-pass in 13 (4.2%). In the right atrial group, 127 (66.5%) had inferior MI, 34 (17.8%) mortality, 66 (34.6%) TVD, and 19 (9.9%) by-pass. Ischemic heart failure was observed most frequently in both groups, more commonly in left atrial hypertrophy (p<0.001, Table II).
In the group with three-vessel disease, GS was 89 (80-117) points (p<0.001) and LVEF was 45 (36-55%) (p=0.009). There was no relationship among TVD, age and gender. In addition, a significant correlation was found with ACS (p=0.012), mortality (p=0.019), bypass (p<0.001), and complications (p=0.043). In bypass cases, GS was 118 (95.75-133.25) points (p<0.001) and LVEF was 41.5 (33.5-49.75%) (p=0.013). There was no relationship among the patients' age, gender, mortality, and ACS types. However, bypass was detected most frequently in anterior MI with 13 (40.6%) patients. Thirty (93.8%) patients had TVD, 17 (53.1%) patients had ischemic heart failure, and 6 (18.8%) had pulmonary edema (p=0.001, Table III).
Table I: Relationship between right-left atrial involvement of V1 Biphasic P Wave with laboratory values and other variables.|
|
All patients n: 497 Median (IQR) |
Left atrium n:306 Median (IQR) |
Right atrium n: 191 Median (IQR) |
p-value* |
|
Baseline characteristic |
||||
|
Age (year) |
66 (58-74) |
65 (58-74) |
67 (58-75) |
0.625 |
|
Gender (F(%) / M(%)) |
220(44.3)/277(55.7) |
142(46.4)/164(53.6) |
78(40.8)/113(59.2) |
0.224 |
|
Laboratory findings |
||||
|
TG, mg/dL |
114 (82-170) |
113.5 (80-163) |
121 (86-181) |
0.091 |
|
CHOL, mg/dL |
164 (131-200) |
164 (130-202) |
161 (133-200) |
0.968 |
|
HDL, mg/dL |
33 (27-39) |
33 (27-39) |
32 (27-38) |
0.445 |
|
LDL, mg/dL |
103 (78-128) |
101.5 (77.75-128) |
104 (78-127) |
0.918 |
|
Glucose, mg/dL |
119 (97.5-168) |
116 (97-150.25) |
131 (98-189) |
0.005 |
|
AST, U/L |
19.1 (15.6-30) |
19.1 (16.1-33.7) |
19.1 (15.6-28.4) |
0.078 |
|
ALT, U/L |
15 (11.5-24) |
15 (12-27) |
15 (11-24) |
0.356 |
|
CK, U/L |
104 (74-156) |
104 (74-156) |
104 (74-148) |
0.521 |
|
CKMB, ng/mL |
26 (18-37) |
26 (18-37) |
25 (18-37) |
0.637 |
|
WBC, 103/uL |
9.2 (7.2-12.1) |
9.05 (7-11.27) |
9.9 (7.2-13.1) |
0.014 |
|
MCV, fL |
89.2 (84.2-93.6) |
89.2 (84.12-93.6) |
89.7 (84.8-93.6) |
0.337 |
|
RDW, % |
14.4 (13.8-15.5) |
14.3 (13.8-15.5) |
14.4 (13.8-15.5) |
0.911 |
|
MPV, fL |
8 (7.6-8.9) |
7.9 (7.4-8.6) |
8.3 (7.8-9) |
<0.001 |
|
Gensini score |
37 (16-75.5) |
33 (13.75-65.25) |
48 (20-84) |
0.001 |
|
LVEF, % |
48 (40-59) |
45.5 (38-57) |
52 (40-60) |
0.030 |
|
Tn I, ng/L |
2.01 (1.02-3.69) |
1.73 (0.94-3.48) |
2.38 (1.19-4.15) |
0.003 |
|
Tn II |
5.09 (2.59-8.77) |
4.46 (2.28-8.19) |
6.13 (3.17-9.5) |
0.003 |
|
Tn III |
11.18 (6-18.18) |
9.46 (5.27-17) |
14.67 (7.63-22.59) |
<0.001 |
|
Data are given in number (percentile) or median (IQR): (25th-75th percentile). F: Female M: Male TG: Triglyceride, CHOL: Cholesterol HDL: High-density lipoprotein, LDL: Low-density lipoprotein, AST: Aspartate aminotransferase, ALT: Alanine aminotransferase, CK: Creatine kinase, CK-MB: Creatine kinase MB, WBC: White blood cell, MCV: Mean corpuscular volume, RDW: Red cell distribution width, MPV: Mean platelet volume, LVEF: Left ventricular ejection fraction, Tn: Troponin, p: Statistical significance (<0.05). * Chi-square test was used for gender, while Mann-Whitney U-test was used for other variables. |
||||
Table II. Relationship between right-left atrial involvement of V1bP with gender, MI subgroups, Mortality, TVD, Bypass, and Complications.
|
V1 Derivation Biphasic P |
Left atrium n (%) 306(61.6) |
Right atrium n (/%) 191(38.4) |
p-value* |
|
|
Gender |
Female |
142 (46.4) |
78 (40.8) |
0.229 |
|
Male |
164 (53.6) |
113 (59.2) |
||
|
Diagnosis |
Non ST MI |
101(33.0) |
37(19.4) |
<0.001 |
|
Inferior MI |
18(5.9) |
127(66.5) |
||
|
Posterior MI |
0(0.0) |
9(4.7) |
||
|
Anterior MI |
128(41.8) |
15(7.9) |
||
|
Lateral MI |
10(3.3) |
1(0.5) |
||
|
Large anterior MI |
38(12.4) |
1(0.5) |
||
|
High lateral MI |
11(3.6) |
1(0.5) |
||
|
Mortality |
No |
289(94.4) |
157(82.2) |
<0.001 |
|
Yes |
17(5.6) |
34(17.8) |
||
|
TVD |
No |
237(77.5) |
125(65.4) |
0.004 |
|
Yes |
69(22.5) |
66(34.6) |
||
|
By-pass |
No |
293(95.8) |
172(90.1) |
0.014 |
|
Yes |
13(4.2) |
19(9.9) |
||
|
Complication |
No complication |
121(39.5) |
74(38.7) |
<0.001 |
|
IHF |
133(43.5) |
59(30.9) |
||
|
VT |
24(7.8) |
14(7.3) |
||
|
AV blok |
4(1.3) |
25(13.1) |
||
|
TMP/EFF |
5(1.6) |
4(2.1) |
||
|
PE |
19(6.2) |
15(7.9) |
||
|
V1bP: V1 Derivation biphasic P, TVD: Three vessel disease, MI: Myocardial infarction, IHF: Ischemic heart failure, VT: Ventricular tachycardia, AV Block: Atrioventricular block, TMP/EFF: Tamponade / Effusion, PE: Pulmonary edema, p: Statistical significance (<0.05). * Chi-square test. |
||||
DISCUSSION
Although there are some studies in the literature about P morphology in electrocardiography, this study could not find an effect of the V1bP wave on TVD and bypass. This prompted us to investigate the effect of the V1bP wave on mortality, TVD, and bypass. In patients with acute coronary syndrome, mortality, TVD, and bypass are more common in patients with right atrial involvement in the V1bP wave, whereas anterior myocardial infarction and ischemic heart failure increase are more common in left atrial involvement. This study is the first to demonstrate this.
Only a few studies have been published on the evaluation of P wave morphology and duration in cases of acute coronary syndrome. The P wave represents the electrical atrial depolarisation time. It consists of the sum of various electrical vectors recorded together with the atrial tissue.
Table III: Relation of By-pass and TVD with MI classifications, V1bP, Complications, Mortality, among each other.|
Bypass &TVD
|
Bypass |
Three Vessel Disease |
|||||
|
No n(%) 465(93.6) |
Yes n(%) 32(6.4) |
p-value* |
No n(%) 362(72.8) |
Yes n(%) 135(27.2) |
p-value* |
||
|
Age, Median (IQR) |
66 (57-74) |
69 (63.75-75.5) |
0.080 |
65 (57-74) |
68 (58-75) |
0.135 |
|
|
Gensini score, Median (IQR) |
35 (15-59.5) |
118 (95.75-133.25) |
<0.001 |
24 (11-43.25) |
89 (80-117) |
<0.001 |
|
|
LVEF, %, Median (IQR) |
50 (40-60) |
41.5 (33.5-49.75) |
0.013 |
50 (40-60) |
45 (36-55) |
0.009 |
|
|
Gender |
Female |
203 (43.7) |
17 (53.1) |
0.358 |
169 (46.7) |
51 (37.8) |
0.085 |
|
Male |
262 (56.3) |
15 (46.9) |
193 (53.3) |
84 (62.2) |
|||
|
Diagnosis |
Non-ST MI |
131(28.2) |
7(21.9) |
0.470 |
115(31.8) |
23(17) |
0.012 |
|
Inferior MI |
137(29.6) |
8(25) |
105(29) |
40(29.6) |
|||
|
Posterior MI |
8(1.7) |
1(3.1) |
6(1.7) |
3(2.2) |
|||
|
Anterior MI |
130(28) |
13(40.6) |
97(26.8) |
46(34.1) |
|||
|
Lateral MI |
11(2.4) |
0 |
6(1.7) |
5(3.7) |
|||
|
Common Anterior MI |
35(7.7) |
3(9.4) |
23(6.4) |
16(11.9) |
|||
|
High Lateral MI |
12(2.6) |
0 |
10(2.8) |
2(1.5) |
|||
|
Mortality |
No |
419(90.1) |
27(84.4) |
0.359 |
336(92.8) |
110(81.5) |
<0.001 |
|
Yes |
46(9.9) |
5(15.6) |
26(7.2) |
25(18.5) |
|||
|
V1bP |
Left Atrium |
293(63) |
13(40.6) |
0.012 |
237(65.5) |
69(51.1) |
0.004 |
|
Right Atrium |
172(37) |
19(59.4) |
125(34.5) |
66(48.9) |
|||
|
TVD/Bypass |
No |
360(77.4) |
2(6.3) |
<0.001 |
360(99.6) |
105(77.8) |
<0.001 |
|
Yes |
105(22.6) |
30(93.8) |
2(0.6) |
30(22.2) |
|||
|
Complication |
No Complication |
192(41.3) |
3(9.4) |
0.001 |
158(43.6) |
37(27.4) |
0.043 |
|
IHF |
175(37.6) |
17(53.1) |
129(35.6) |
63(46.7) |
|||
|
VT |
33(7.1) |
5(15.6) |
26(7.2) |
12(8.9) |
|||
|
AV block |
29(6.2) |
0 |
19(5.2) |
10(7.4) |
|||
|
TMP/EFF |
8(1.7) |
1(3.1) |
6(1.7) |
3(2.2) |
|||
|
PE |
28(6) |
6(18.8) |
24(6.6) |
10(7.4) |
|||
|
Data are given in numbers (percentile) or median (IQR): (25th-75th percentile). LVEF: Left ventricular ejection fraction, V1bP: V1 derivation biphasic P, MI: Myocardial ınfarction TVD: Three vessel disease, IHF: Ischemic heart failure, VT: Ventricular tachycardia, AV Block: Atrioventricular block, TMP/EFF: Tamponade / Effusion PE: Pulmonary edema, p: Statistical significance (<0.05). *Mann-Whitney U-test was used for age, Gensini score, LVEF, and Chi-square test were used for other parameters. Defines TVD in By-pass relationship and By-pass in TVD relationship. |
|||||||
In various heart diseases, conduction delay may occur due to prolonged and inconsistent depolarisation and partly due to left atrial enlargement.6 The elongation of the wave may reflect increased ventricular end-diastolic pressure and wall tension and may occur even before other ECG changes in patients with coronary artery disease.7 The reasons for the inhomogeneous spread of the atrial stimulus may be microstructural and various electrical changes, excessive pressure and increased heart segment size, wall thickness, and volume.8 Biphasic P waves in V1 and V2 may suggest left atrial overload.9
In the examination of age-related P wave morphology characteristics in healthy adults representing different age groups, biphasic P waves in the sagittal plane were observed in a minority of individuals under 50 years of age.10,11 However, biphasic P waves were observed in 70-80% of individuals older than 50 years.10 All of the study included cases with biphasic P. The mean age was 66 years and 44.3% were women.
In patients with acute myocardial infarction, Mehta et al. evaluated the relationship between the terminal strength of the abnormal negative P wave in V1 and angiographic, hemodynamic, and echocardiographic correlations. They reported the association of increased left ventricular end-diastolic pressure, increased creatine kinase-MB, and decreased ejection fraction with the presence of dyskinetic or aneurysmal areas in these patients.12 In the MADIT-II study, atypical P wave morphology was independently associated with heart failure. Although no data were systematically collected on left atrial size, they reported that left atrial enlargement may have contributed to the significantly reduced left ventricular ejection fraction in these patients and the abnormal P wave morphology observed in about a quarter of the patients.13 In the present study, ischemic heart failure, ventricular tachycardia, cardiac tamponade, effusion, and pulmonary edema were found frequently in left atrial involvement in the relationship between the development of complications and the direction of atrial involvement. However, atrioventricular blocks were prominent in right atrium involvement.
It has been shown that P wave dispersion is significantly increased in patients with obstructive coronary artery disease on coronary angiography compared to the patients with normal coronary angiography.14,15 Myocardial ischemia causes an increase in left ventricular and left atrial pressures, and this may lead to a prolongation of P wave duration and dispersion.16 It seems like an appropriate approach to use the P wave in risk classification before coronary angiography.16 In the present study, GS showing the prevalence of coronary artery disease was used. GS was high in posterior MI and diffuse anterior MI. Therefore, the left ventricular ejection fraction was low and troponin values were high. Three vessel disease and mortality were found to be high in right atrium involvement with high GS. It was observed that this situation increased the risk of going to coronary bypass and the morbidity rate. Kangul et al. found a significant positive correlation between P wave duration/change and GS in their study involving 126 patients.17 The utility of P wave duration and variability in the evaluation and risk stratification of the patients with acute coronary syndrome have been supported. In this study, the relation of V1bP with gensini score and ACS groups was remarkable. There appears to be a close interaction between Gensini score, TVD, bypass, LVEF, and mortality.
It was shown that especially left coronary artery disease and TVD increase the sensitivity in the evaluation of P wave duration changes in ST-depression analysis. Wsol et al., in their study with significant angiographically documented coronary lesions, most of their population had two- or three-vessel disease.18 The sensitivity and specificity of the P wave increased with the number of coronary artery stenosis. In this study, the three-vessel disease was detected in 69 (22.5%) patients with left atrial involvement and 66 (34.6%) patients with right atrial involvement. In addition, 13 (4.2%) left and 19 (9.9%) right atrial involvement were present in by-pass group patients. Patients with the three-vessel disease had a GS of 96 and LVEF of less than 45%.
Beinart et al. showed that in patients with acute MI, increased left atrial volume, determined within the first 48 hours of admission, is an independent predictor of five-year mortality together with increasing prognostic information with clinical and echocardiographic data.19 In a similar study, Moller et al. in their study of 324 patients showed that left atrial enlargement adversely affected the prognosis in patients with acute MI.20 They reported that it became a significant independent predictor of mortality at 1 and 5 years after admission. Lu et al. showed that 35% of STEMI patients have P wave abnormalities, and P wave abnormalities in any lead cause a significant increase in both 30-day and 1-year mortality. In the same study, the highest 30-day mortality rate was observed in patients with two notched P waves in the extremity and precordial leads in both anterior and other MI groups.21 In this study, a positive correlation was found between V1bP and mortality. Mortality was higher in patients in the right atrial involvement group. It was found that most of the patients with right involvement developed a new right-bundle branch block before mortality. However, as stated in similar studies, ischemic heart failure predominated in left atrial involvement. It was determined that the risk of mortality was reduced by treating early detected ventricular tachycardia. Beinart et al. and Moller et al. both did not compare the right atrium in their studies.19,20 In these studies, they tried to determine the long-term prognostic significance in patients with acute MI by comparing the normal left atrium with the enlarged left atrium. However, in this study, only V1bP wave cases were evaluated instead of the normal population, and mortality was determined according to the direction of atrial interaction. In addition, by-pass was not applied in 46 (9.2%) of 51 cases with mortality, while by-pass was applied in 5 (1%). While 32 of the patients were treated by bypass, mortality was developed in only 5 of them which can be seen as a success of the surgical team. Because there were advanced complications in all cases who had a bypass attempt.
The most important limitations were the retrospective nature of the study, the difficulties in obtaining the results, and the fact that it was a single-center study. In addition, we could not find the history of medication, secondary life, and coronary artery disease risk factors that may affect the prognosis of the patients. The main limitations were the inability to re-access the electrocardiography, troponin, and data of the patients after discharge.
CONCLUSION
In acute coronary syndrome cases, it was determined that the right or left atrium affected according to the direction of the biphasic P wave in lead V1 is important in terms of atrium hypertrophy, complications after myocardial infarction, three-vessel disease, by-pass, morbidity, and mortality. If it is supported by prospective studies, the authors believe that it will be useful in the future.
FUNDING:
This research did not receive any specific grant from funding agencies in the public, commercial, or not-for-profit sectors.
ETHICAL APPROVAL:
This retrospective observational study was reviewed and approved by the Institutional Review Board of Cumhuriyet University Ethical Committee for Clinical Investigations (Approval No. 2020-02/19).
PATIENTS’ CONSENT:
Informed consents were taken.
COMPETING INTEREST:
The authors declared no competing interest.
AUTHORS’ CONTRIBUTION:
BD: Conceptualisation, design, literature review, methodology, project administration, data curation, visualisation, and writing original draft.
AC: Data curation, statistical analysis, supervision, writing the original draft, and methodology.
CB, BA: Data curation, literature review, writing original draft, and methodology.
All the authors have approved the final version of the manuscript to be published.
REFERENCES
- Shettigar UR, Barry WH, Hultgren HN. P wave analysis in ischaemic heart disease. An echocardiographic, haemodynamic, and angiographic assessment. Br Heart J 1977; 39(8):894-9. doi:10.1136/hrt.39.8.894.
- Rosenheck S. Signal-averaged P wave in patients with paroxysmal atrial fibrillation. Pacing Clin Electrophysiol 1997; 20(10 Pt 2):2577-86. doi:10.1111/j.1540-8159.1997.tb06107.x.
- Otto CM, Bonow RO. Valvular heart disease. In: Bono RO, Mann DL, Zipes DP, Libby P, eds. Braunwald’s heart disease: A textbook of cardiovascular medicine. 9th ed. Philadelphia: Elsevier Saunders 2012; 1468-539.
- Thygesen K, Alpert JS, Jaffe AS, Chaitman BR, Bax JJ, Morrow DA, et al. Executive Group on behalf of the Joint European Society of Cardiology (ESC)/American College of Cardiology (ACC)/American Heart Association (AHA)/World Heart Federation (WHF) task force for the universal definition of myocardial ınfarction. Fourth Universal Definition of Myocardial Infarction (2018). Circulation 2018; 138(20):e618-51. doi: 10.1161/CIR.0000000000000617.
- Gensini GG. A more meaningful scoring system for determining the severity of coronary heart disease. Am J Cardiol 1983; 51(3):606. doi: 10.1016/s0002-9149(83)80105-2.
- Cecchi F, Montereggi A, Olivotto I, Marconi P, Dalara A, Maron BJ. Risk for atrial fibrillation in patients with hypertrophic cardiomyopathy assessed by signal averaged P wave duration. Heart 1997; 78(1):44-9. doi: 10.1136/hrt. 78.1.44.
- Pandia A, Ellestad MH, Crump R. Time course of changes in p-wave duration during exercise. Cardiol 1996; 87(4): 343-6. doi: 10.1159/000177117.
- Shturman A, Bickel A, Atar S. The Predictive Value of P-Wave Duration by Signal-Averaged Electrocardiogram in Acute ST Elevation Myocardial Infarction. Isr Med Assoc 2012; 14(8):493-7.
- Ishida K, Hayashi H, Miyamoto A, Sugimoto S, Ito M, Murakami Y, et al. P wave and the development of atrial fibrillation. Heart Rhythm 2010; 7(3):289-94. doi: 10.1016/j. hrthm.2009.11.012.
- Havmoller R, Carlson J, Holmqvist F, Herreros A, Meurling CJ, Olsson B, et al. Age-related changes in p wave morphology in healthy subjects. BMC Cardiovasc Disord 2007; 7:22. doi: 10.1186/1471-2261-7-22.
- Dilaveris P, Raftopoulos L, Giannopoulos G, Katinakis S, Maragiannis D, Roussos D, et al. Prevalence of interatrial block in healthy school-aged children: definition by P-wave duration or morphological analysis. Ann Noninvasive Electrocardiol 2010; 15(1):17-25. doi: 10.1111/j.1542-474X. 2009.00335.x.
- Mehta A, Jain AC, Mehta MC, Billie M. Left atrial abnormality in acute myocardial infarction. Am J Cardiol 1997; 79(6):807-11. doi: 10.1016/s0002-9149(96)00877-6.
- Holmqvist F, Platonov PG, McNitt S, Polonsky S, Carlson J, Zareba W, et al. MADIT II Investigators. Abnormal p-wave morphology is a predictor of atrial fibrillation development and cardiac death in MADIT II patients. Ann Noninvasive Electrocardiol 2010; 15(1):63-72. doi: 10.1111/j.1542- 474X.2009.00341.x.
- Dilaveris PE, Gialafos EJ, Sideris SK, Theopistou AM, Andrikopoulos GK, Kyriakidis M, et al. Simple electrocardiographic markers for the prediction of paroxysmal idiopathic atrial fibrillation. Am Heart J 1998; 135(5 Pt 1):733-8. doi: 10.1016/s0002-8703(98)70030-4.
- Yilmaz R, Demirbag R. P-wave dispersion in patients with stable coronary artery disease and its relationship with severity of the disease. J Electrocardiol 2005; 38(3):279-84. doi: 10.1016/j.jelectrocard.2005.02.003.
- Dilaveris PE, Andrikopoulos GK, Metaxas G, Richter DJ, Avgeropoulou CK, Androulakis AM, et al. Effects of ischemia on p wave dispersion and maximum p wave duration during spontaneous anginal episodes. Pacing Clin Electrophysiol 1999; 22(11):1640-7. doi: 10.1111/j.1540-8159.1999.tb00384.x.
- Kangul H, Eyuboglu M, Kozan O. Estimating the severity of coronary artery disease availability of p wave dispersion for. Kosuyolu Heart J 2017; 20:111-5. doi: 10.5578/khj.27856.
- Wsol A, Wydra W, Chmielewski M, Swiatowiec A, Kuc M. Increased sensitivity of prolonged p-wave during exercise stress test in detection of angiographically documented coronary artery disease. Cardiol J 2017; 24(2):159-66. doi: 10.5603/CJ.a2016.0099.
- Beinart R, Boyko V, Schwammenthal E, Kuperstein R, Sagie A, Hod H, et al. Long-term prognostic significance of left atrial volume in acute myocardial ınfarction. J Am Coll Cardiol 2004; 44(2):327-34. doi: 10.1016/j.jacc.2004. 03.062.
- Moller JE, Hillis GS, Oh JK, Seward JB, Reeder GS, Wright RS, et al. Left atrial volume: A powerful predictor of survival after acute myocardial infarction. Circulation 2003; 107(17):2207-12. doi: 10.1161/01.CIR.0000066318. 21784.43.
- Lu MLR, Nwakile C, Bhalla V, De Venecia T, Shah M, Figueredo VM. Prognostic significance of abnormal p wave morphology and PR segment displacement after ST-elevation myocardial infarction. Int J Cardiol 2015; 197:216-21. doi: 10.1016/j.ijcard.2015.06.055.