Relationship of Gamma-glutamyl Transferase Levels at Diagnosis with Clinicopathological Features in idiopathic IgA Nephropathy
By Sinan Kazan1, Onur Tunca1, Elif Dizen Kazan2, Cigdem Ozdemir3, Sumeyra Koyuncu4, Hulya Akgun5Affiliations
doi: 10.29271/jcpsp.2022.12.1548ABSTRACT
Objective: To compare clinicopathologic features of idiopathic IgA nephropathy in terms of serum gamma-glutamyl transferase (GGT) levels.
Study Design: Cross-sectional study.
Place and Duration of Study: Department of Nephrology and Department of Pathology, Afyonkarahisar Health Sciences University, Afyonkarahisar, Turkey, from January 2010 to January 2021.
Methodology: All patients diagnosed with IgA nephropathy were retrospectively evaluated. Patients were divided into quartiles of gamma-glutamyl transferase. Clinical and pathological features were compared between the groups.
Results: A total of 69 patients with idiopathic IgA nephropathy were analysed. The GGT quartiles consisted of Q1(GGT ≤14 U/L) in 18 patients, Q2(GGT = 14.01-20 U/L) in 17 patients, Q3(GGT = 20.1-35 U/L) in 18 patients, and Q4(GGT >35 U/L) in 16 patients. The rates of mesangial cellularity, segmental glomerulosclerosis, and tubular atrophy were found to be significantly different among GGT groups (p= 0.024, p= 0.048, and p<0.001 respectively). Serum albumin and 24-hours proteinuria were also significantly different between groups (p<0.001).
Conclusion: Gamma-glutamyl transferase may play a role in some clinical and pathological features of IgA nephropathy.
Key Words: Gamma-glutamyl transferase, IgA nephropathy, Proteinuria, Serum albumin, Mesangial Cellularity, Segmental glomerulosclerosis, Tubular atrophy.
INTRODUCTION
Immunoglobulin A nephropathy (IgAN) is the most common cause of primary glomerulonephritis worldwide.1 The decrease in glomerular filtration rate varies from patient to patient but is typically slow. Histopathological findings are of prognostic importance. The Oxford classification with MEST score: Mesangial cellularity, Endocapillary proliferation, Segmental glomerulosclerosis, and Tubular atrophy/interstitial fibrosis) is the essential tool for the prediction of prognosis.2
In the recent past, the presence of a crescent was added to the MEST score as ‘C’ and the MEST-C score is still a scoring system used to predict disease progression.3 Some clinical findings are important in terms of the progression to chronic kidney disease, the most important of which is proteinuria.4,5
Gamma-glutamyl transferase (GGT) catalyses the transfer of the gamma-glutamyl group from gamma-glutamyl peptides such as glutathione to other peptides. GGT is thought to play a role in amino acid transport.6 It is used as a marker of cholestasis in clinical practice and it may be elevated by the diseases of the liver, gallbladder, and pancreas. A recent meta-analysis showed that there was a dose-response relationship between GGT within the normal reference range and cardiovascular mortality.7 It has been shown that there may be a relationship between albuminuria and GGT levels in non-diabetic adults with normal renal function.8
The aim of this study was to investigate the relationship between serum GGT levels at the time of diagnosis of idiopathic IgAN with proteinuria and histopathological findings.
METHODOLOGY
In this single-centre study, the files of all patients (n= 442) who underwent kidney biopsy, between January 2010 and January 2021, were evaluated retrospectively. The files of the patients diagnosed with IgAN were separated from the others and analysed in detail. Between the specified dates, seventy-six patients (17.2%) were diagnosed with IgAN. Patients with haematological or solid organ malignancies, autoimmune disease, chronic viral infection, acute or chronic liver disease, acute or chronic gallbladder disease, pancreatic disease, and alcohol abuse that could be associated with secondary IgAN or increase in serum GGT levels were excluded from the study. Patients with missing clinical and laboratory information required for the study were also excluded. The study was conducted with patients older than 18 years of age who were diagnosed with idiopathic IgAN as a result of a kidney biopsy. The study design was shown in Figure 1. The study was approved by the local Ethics Committee.
Proteinuria was determined by 24-hour (h) urine analysis in all patients. The patients were asked to urinate their first urine into the toilet in the morning on the day they started collecting urine, and then to urinate in a container for 24 hours. To finish the urine collection on the second day, the patients were asked to urinate for the last time, 24 hours after the last urination in the toilet. They were also told to store the urine in a cool area. Written materials on how to collect 24-hour urine were given to all patients. Proteinuria >3500 mg/day is considered nephrotic range proteinuria. Urines were analysed with an automatic analyzer (Cobas 6000, Roche, Switzerland).
All biochemical tests were analysed from venous blood samples in the morning after overnight fasting of at least 8 hours. Fasting plasma glucose, urea, creatinine, cholesterol parameters, aspartate aminotransferase (AST), alanine aminotransferase (ALT), and GGT levels were measured with an automatic analyser (Cobas 6000, Roche, Switzerland). The estimated glomerular filtration rate (e-GFR) was calculated with Chronic Kidney Disease-Epidemiology Collaboration (CKD-EPI) formula (eGFR= 141 * min(Scr/ κ,1)α * max(Scr/ κ,1)-1.209 * 0.993Age * 1.018[if the patient is female]). Patients were divided into 4 groups according to GGT quartiles. Q1 = GGT ≤14 U/L, Q2 = GGT between 14.01-20 U/L, Q3 = GGT between 20.1-35 U/L, Q4 = GGT >35 U/L (Figure 1). Groups were compared in terms of proteinuria and clinicopathologic features.
All kidney biopsies were evaluated by a specialised nephropathologist. MEST-C scores were recorded for analysis. The score was used as follows: For mesangial cellularity, M0 was mesangial cellularity <50% of glomeruli, and M1≥ was 50. For endocapillary proliferation, E0 was the absence of hypercellularity and E1 was hypercellularity in any glomeruli. For segmental glomerulosclerosis, S0 is the absence of segmental glomerulosclerosis and S1 was the presence of segmental glomerulosclerosis in any glomeruli. For tubular atrophy/interstitial fibrosis, T0 was tubular atrophy/interstitial fibrosis in 0-25%, T1 in 25-50% and T2 in >50% of the cortical area. C0 was no crescents, C1 was crescents in less than one-fourth of glomeruli, and C2 was crescents in over one-fourth of glomeruli.
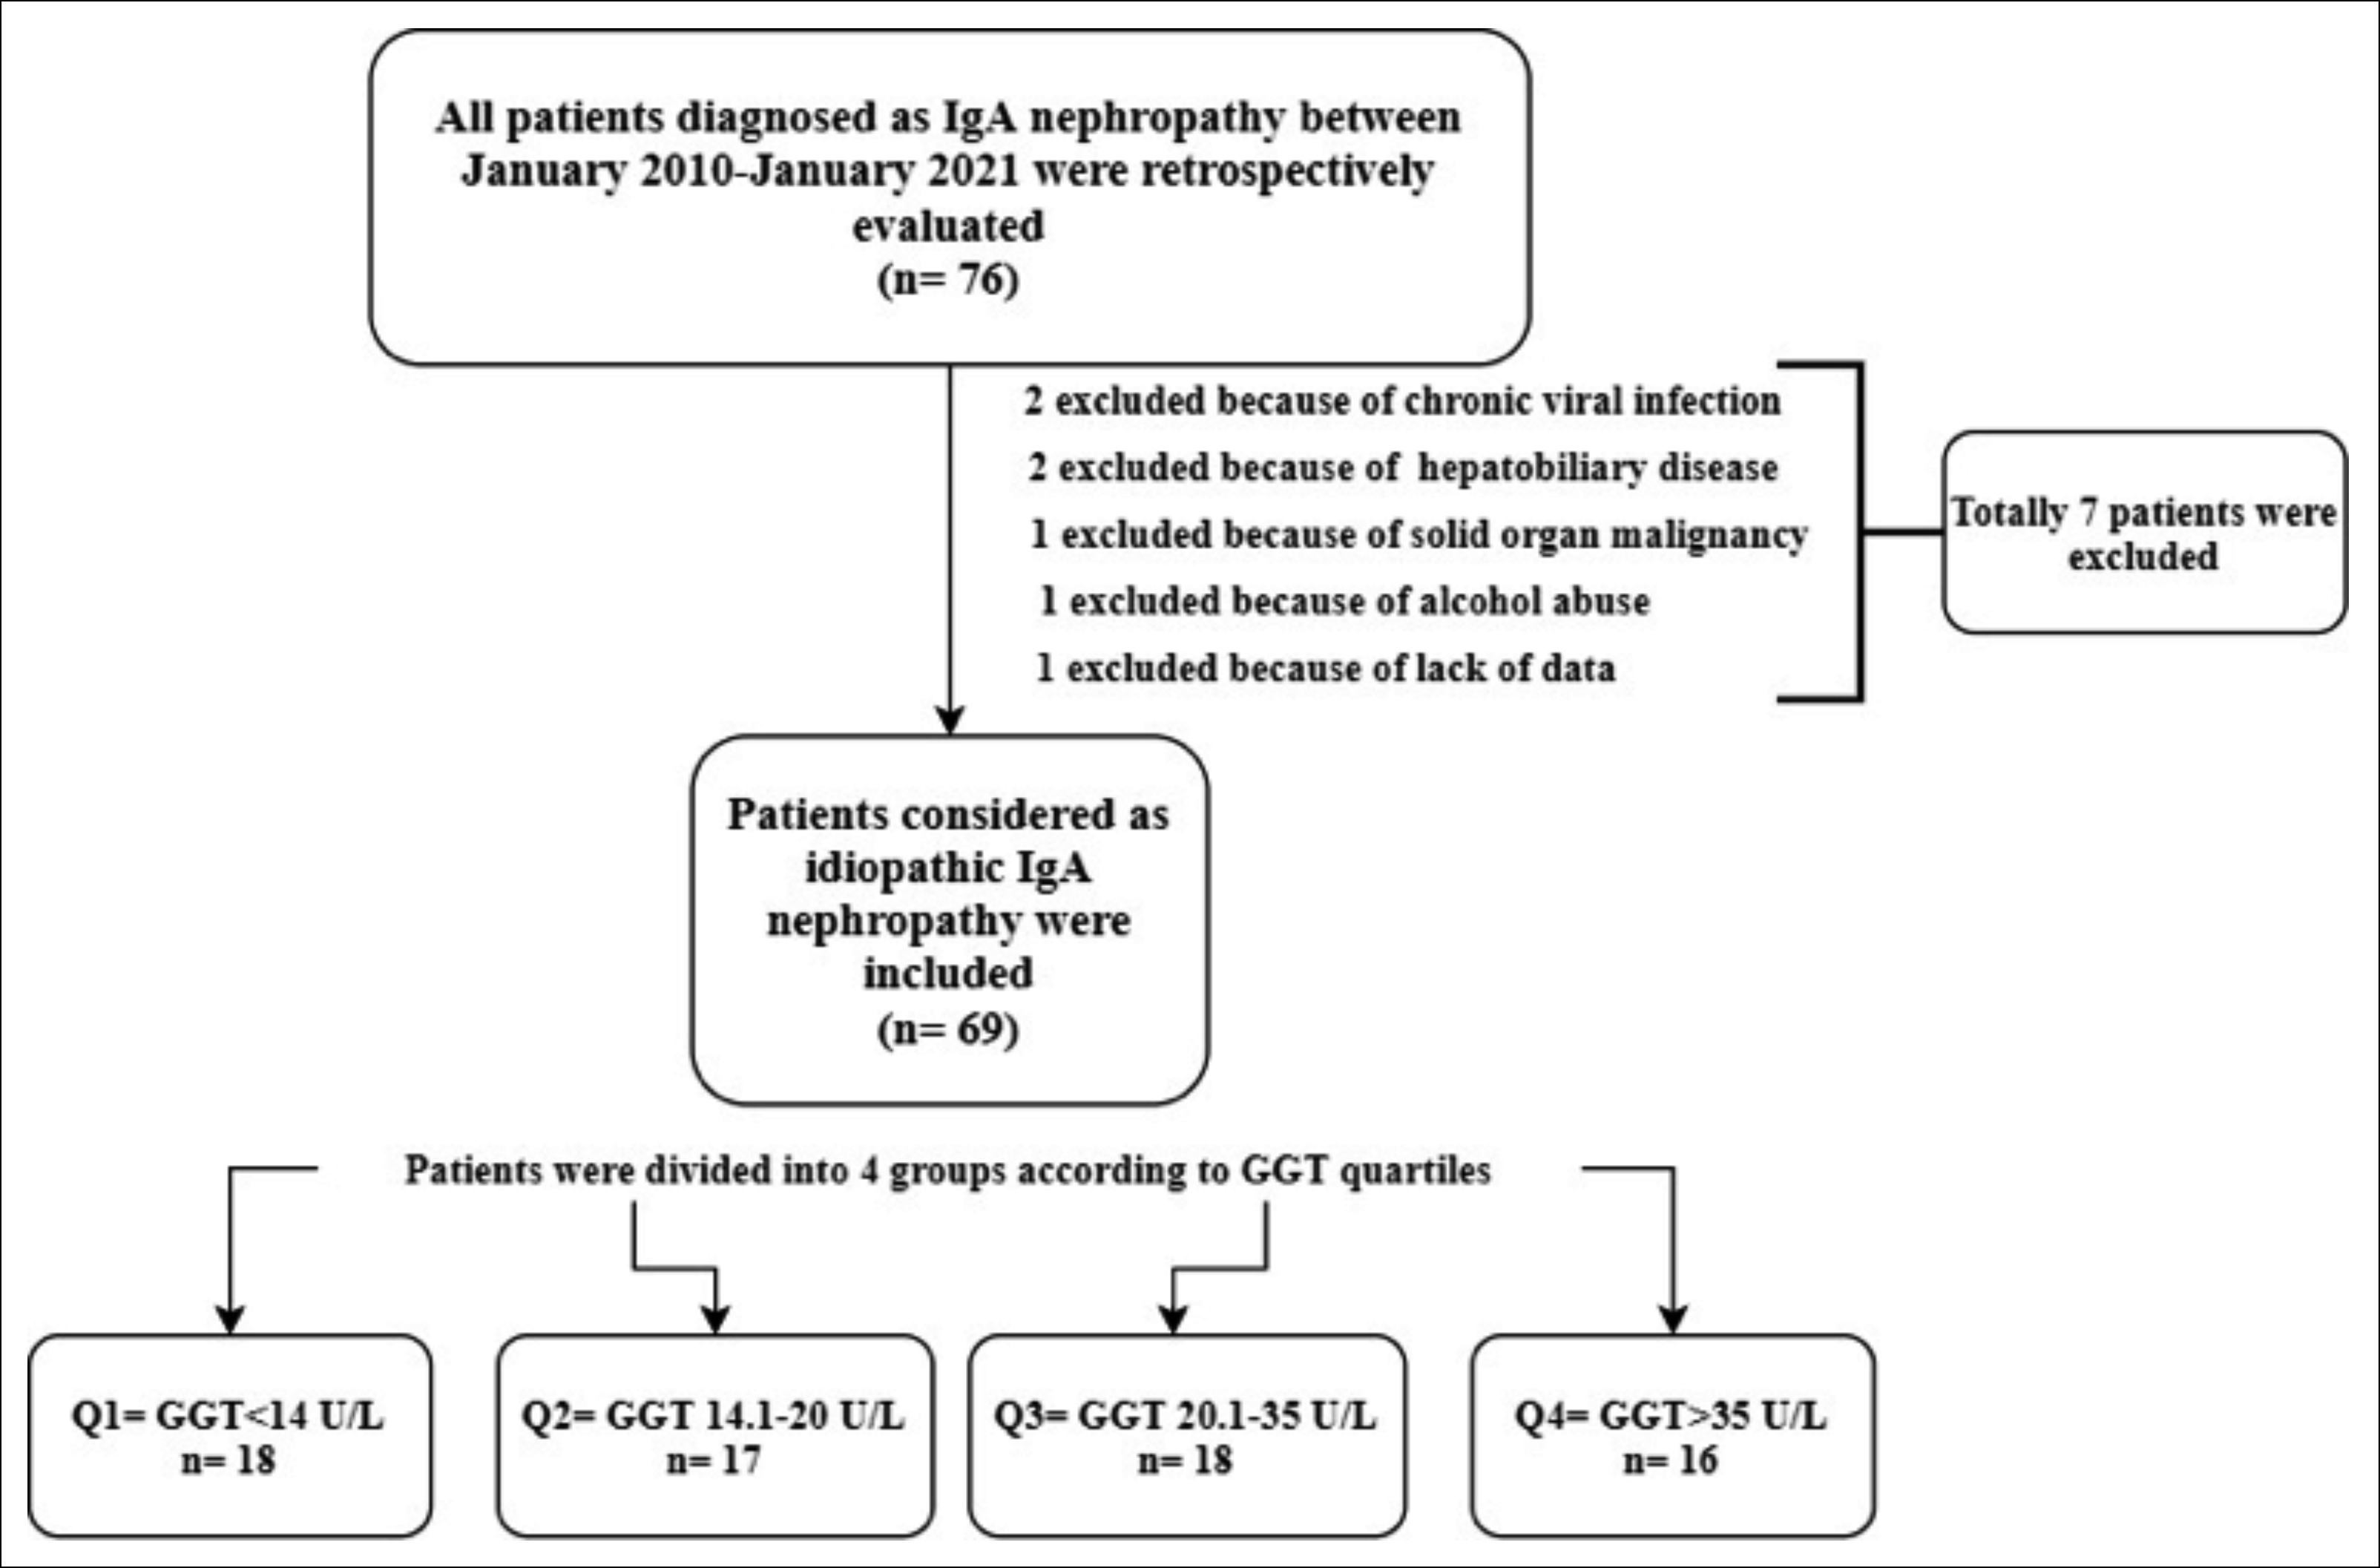 Figure 1: Study design.
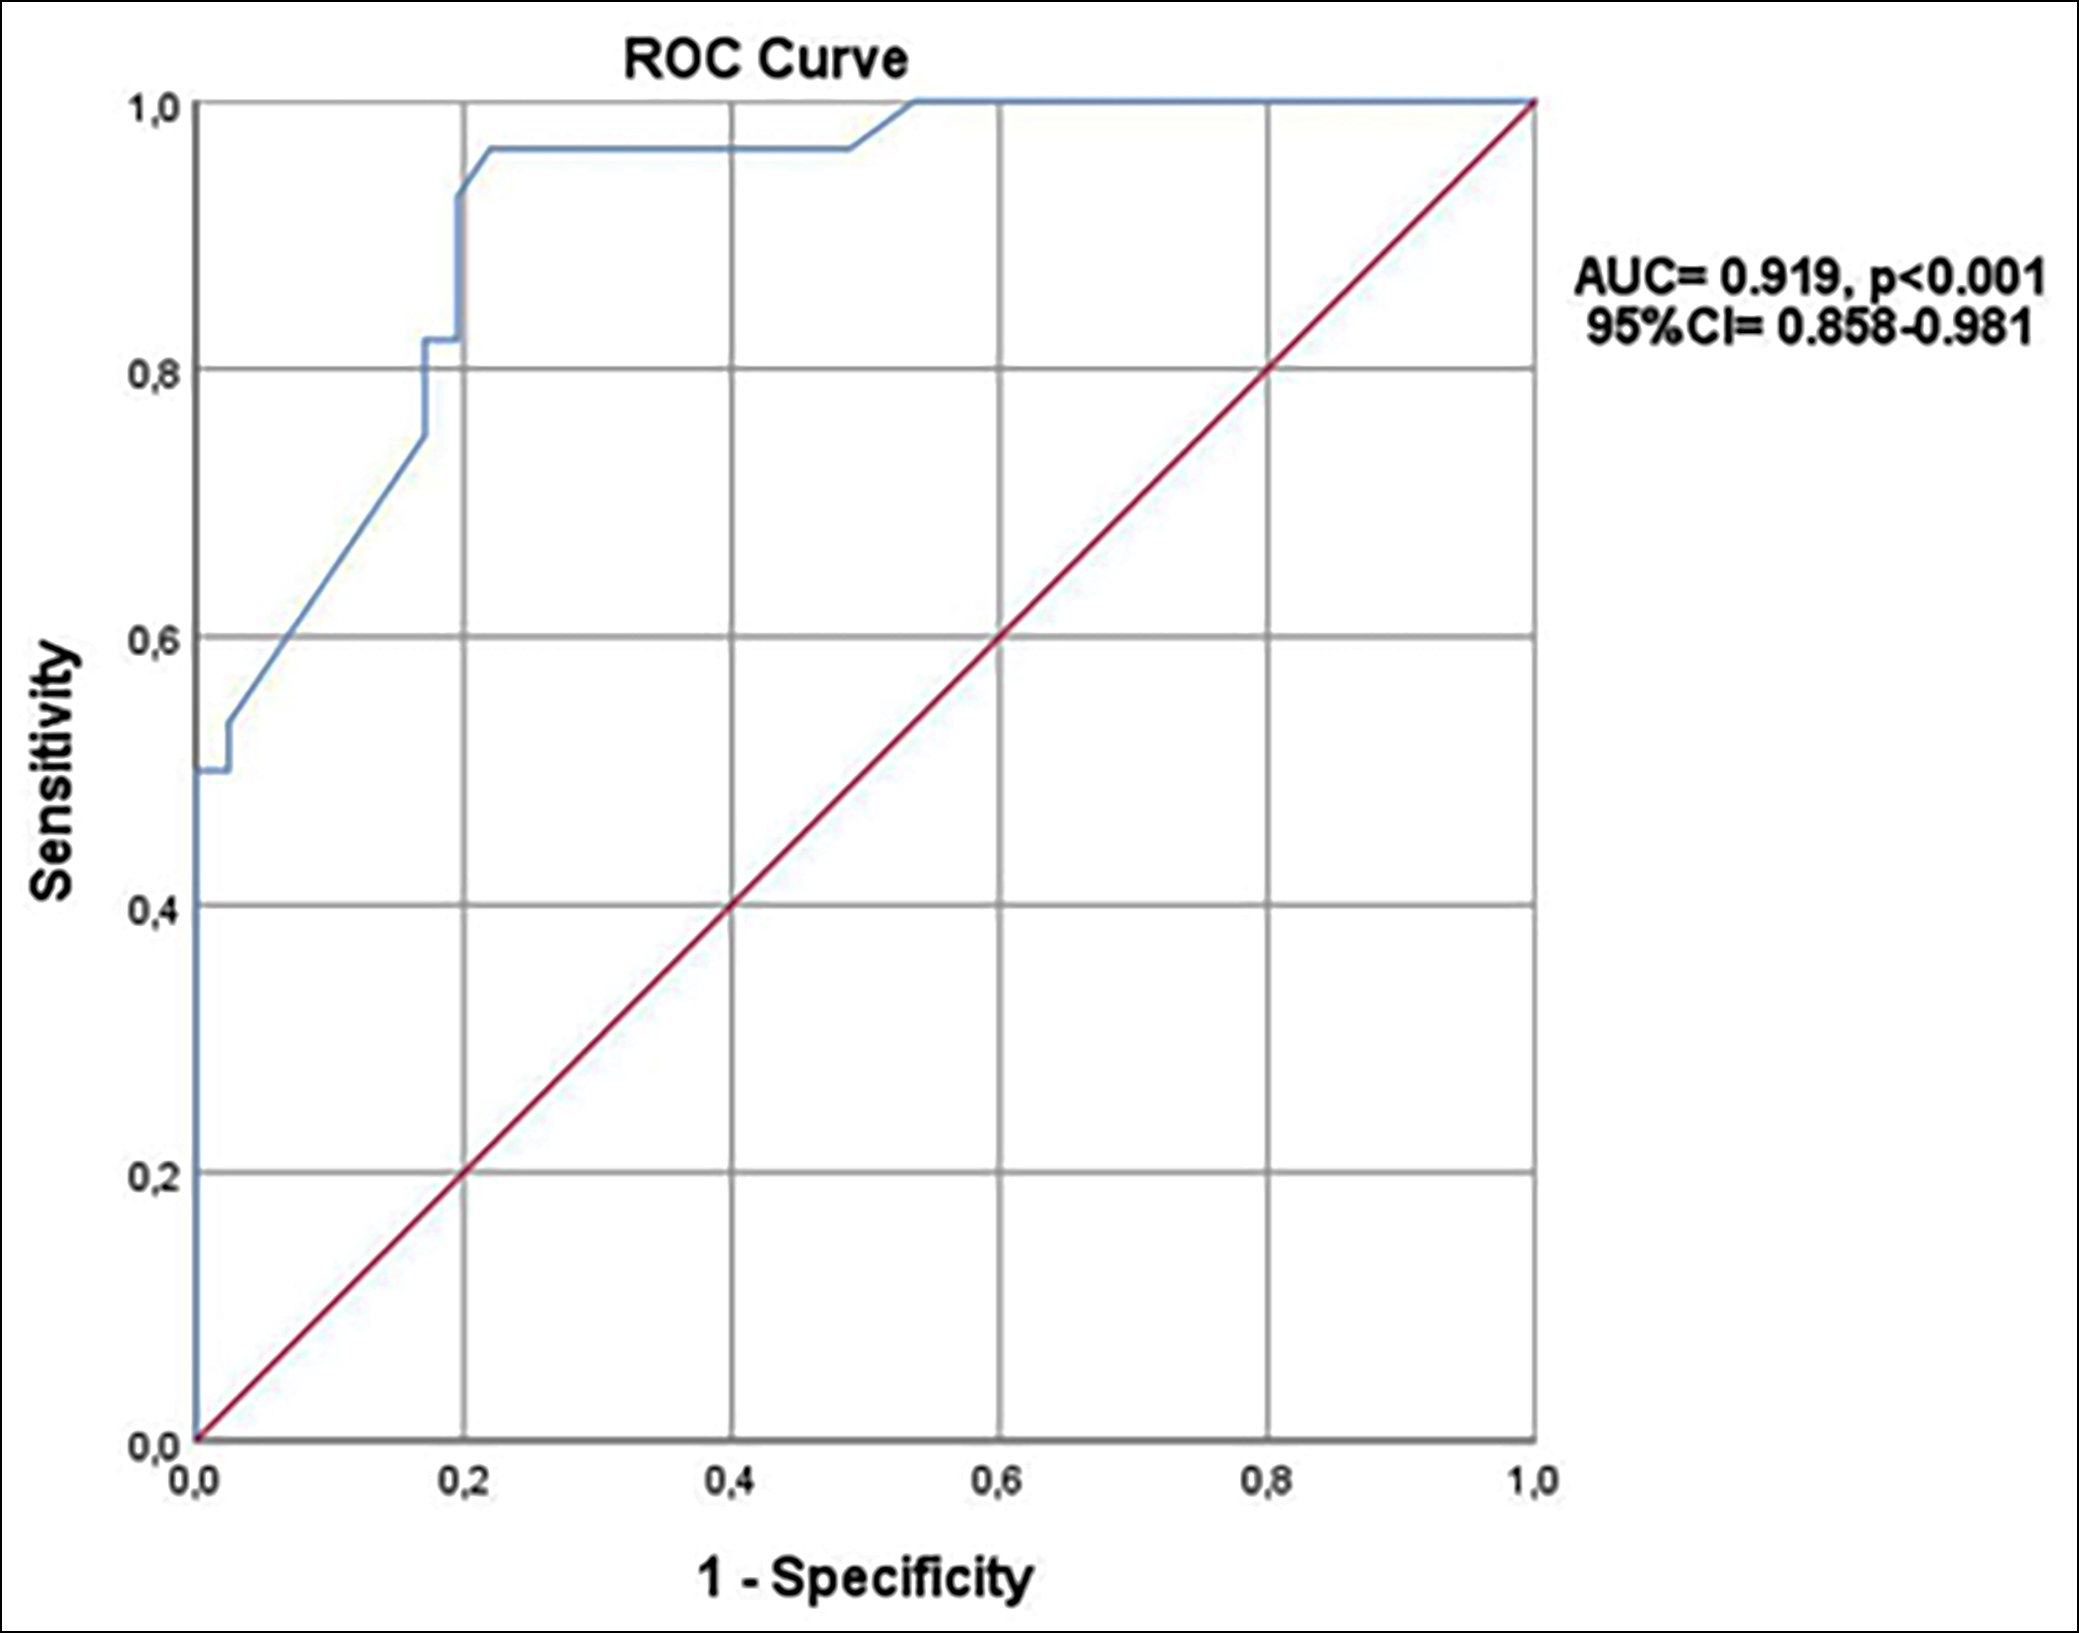 Figure 2: ROC curve for GGT on predicting nephrotic range proteinuria.
All statistical analyses were done with IBM SPSS Statistics (Statistics for Windows, version 26.0. Armonk, NY: IBM Corp.) package program. Categorical variables were presented as frequency and percentages. The chi-square test was used to compare categorical variables between GGT groups. When necessary, the z-test was performed as a post-hoc analysis of the chi-square test. Continuous variables were checked with the Shapiro-Wilk test and visual histograms for normal distribution. Normally distributed continuous variables were presented as mean±standart deviation, and non-normally distributed continuous variables were presented as median (interquartile range 25-75). Normally distributed continuous variables were compared with one way ANOVA test and non-normally distributed ones were compared with the Kruskal-Wallis test. Pairwise comparisons were done for the post-hoc of the Kruskal-Wallis test and Bonferroni correction was done for the post-hoc of the ANOVA. The Receiver Operating Characteristics (ROC) curve was conducted for the predictive value of GGT on nephrotic range proteinuria. The Youden index was used for determining the best cut-off value of GGT for predicting nephrotic range proteinuria. All p-values are two-sided and values as p<0.05 were accepted as significant.
RESULTS
Sixty-nine patients with idiopathic IgAN were analysed. The median age of the patients was 40 years with an interquartile range of 33-54.5 years. Of the patients 62.3% (n = 43) were males and 37.7% (n = 26) were females. The GGT quartiles consisted of Q1 (GGT ≤14 U/L) in 18 patients, Q2 (GGT = 14.01-20 U/L) in 17 patients, Q3 (GGT = 20.1-35 U/L) in 18 patients, and Q4 (GGT >35 U/L) in 16 patients. GGT groups were similar in terms of clinical features including age, gender, smoking status, weight, height, body mass index, the prevalence of diabetes mellitus and hypertension, systolic blood pressure, and diastolic blood pressure (p>0.05). The rates of mesangial cellularity, segmental glomerulosclerosis, and tubular atrophy were found to be different among GGT groups (p = 0.024, p = 0.048, and p<0.001, respectively). Endocapillary proliferation and crescents were similar between groups (p>0.05). Clinical and histopathological comparisons of GGT groups were presented in Table I.
Groups were similar in terms of glucose, urea, creatinine, eGFR, cholesterol parameters, and aminotransferases (p>0.05). Comparisons of laboratory measurements between GGT groups were presented in Table II. Serum albumin and 24h proteinuria were significantly different between groups (p<0.001). Post-hoc analysis revealed a significant difference between group Q4 and others (p<0.001). Proteinuria was only similar between Q2 and Q3 groups at pairwise comparisons (p>0.05).
In the ROC curve, it is found that a GGT value of 21.5 U/L has a predictive value with 96.4% sensitivity and 78% specificity for nephrotic range proteinuria (AUC = 0.919, p<0.001 95% CI = 0.858-0.981). Figure 2 shows the ROC curve of GGT for the prediction of nephrotic range proteinuria.
Table I: Clinical and histopathological comparisons of GGT quartiles.|
|
Quartile 1 (n= 18) |
Quartile 2 (n= 17) |
Quartile 3 (n= 18) |
Quartile 4 (n= 16) |
P
|
|
Age (years) |
45(31-54) |
45(34-55) |
36(27-51) |
45(32-59) |
0.485 |
|
Female (%-n) |
50-9 |
35.3-6 |
33.3-6 |
31.3-5 |
0.652 |
|
Current smoker (%-n) |
16.7-3 |
23.5-4 |
33.3-6 |
31.3-5 |
0.342 |
|
Weight (kg) |
75(65-78) |
77(74-79) |
71(63-76) |
73(65-79) |
0.089 |
|
Height (m) |
1.71(1.65-1.75) |
1.68(1.65-1.75) |
1.68(1.65-1.75) |
1.7(1.66-1.75) |
0.896 |
|
Body mass index (kg/m2) |
25.6±3.5 |
26.6±2.1 |
24.3±3 |
25.1±3.4 |
0.154 |
|
Diabetes mellitus (%-n) |
33.3-6 |
11.8-2 |
11.1-2 |
6.3-1 |
0.126 |
|
Hypertension (%-n) |
11.1-2 |
23.5-4 |
27.8-5 |
37.5-6 |
0.347 |
|
Systolic blood pressure (mmHg) |
121.6±17.2 |
122.5±12.5 |
126.3±20.1 |
133.1±17.6 |
0.141 |
|
Diastolic blood pressure (mmHg) |
74.4±9.8 |
78.2±9.5 |
77.2±8.2 |
82.2±11.6 |
0.272 |
|
Mesangial hypercellularity M0 (%-n) M1 (%-n) |
50-9 50-9 |
58.8-10 41.2-7 |
27.8-5 72.2-13 |
12.5-2 87.5-14 |
0.024* |
|
Endocapillary proliferation E0 (%-n) E1 (%-n) |
94.4-17 5.6-1 |
94.1-16 5.9-1 |
77.8-14 22.2-4 |
81.2-13 18.8-3 |
0.327 |
|
Segmental glomerulosclerosis S0 (%-n) S1 (%-n) |
72.2-13 27.8-5 |
76.5-13 23.5-4 |
38.9-7 61.1-11 |
43.7-7 56.3-9 |
0.048** |
|
Tubular atrophy/interstitial fibrosis T0 (%-n) T1 (%-n) T2 (%-n) |
88.9-16 11.1-2 0-0 |
70.6-12 29.4-5 0-0 |
27.8-5 55.6-10 16.7-3 |
18.8-3 50-8 31.3-5 |
<0.001*** |
|
Crescents C0 (%-n) C1 (%-n) C2 (%-n) |
94.4-17 5.6-1 0-0 |
82.4-14 17.6-3 0-0 |
72.2-13 22.2-4 5.6-1 |
75-12 18.8-3 6.3-1 |
0.610 |
|
Kruskal Wallis test, Chi-square test, and ANOVA was used where appropriate. *z-test revealed only a difference between Q2 and Q4, **z-test revealed no difference between groups, ***z-test revealed only a difference between Q1 and Q3 in terms of T1. |
|||||
Table II: Comparisons of laboratory measurements in terms of GGT quartiles.
|
|
Quartile 1 (n= 18) |
Quartile 2 (n= 17) |
Quartile 3 (n= 18) |
Quartile 4 (n= 16) |
p |
|
Glucose (mg/dl) |
98(85-118) |
96(89-120) |
90(87-101) |
90(84-10) |
0.415** |
|
Urea (mg/dl) |
20.5(15-28) |
19(13-31) |
28(21-50) |
23(13.8-38) |
0.141** |
|
Creatinin (mg/dl) |
1.2(0.9-1.5) |
1.4(0.9-1.7) |
1.5(1.2-1.6) |
1.2(0.9-1.5) |
0.196** |
|
eGFR (ml/dk/1.73m2) |
71.6±26.3 |
67.7±22.9 |
55.8±19.6 |
69.6±22.4 |
0.192* |
|
Total-C (mg/dl) |
190.7±57.4 |
201.8±54.7 |
243.2±74.1 |
196.1±54.3 |
0.078* |
|
Triglyceride (mg/dl) |
150(100-231) |
201(133-238) |
192(143-286) |
207(102-250) |
0.591** |
|
HDL-C (mg/dl) |
40(33-43.5) |
42(29-48) |
40(29.5-44) |
38(27.7-44.7) |
0.930** |
|
LDL-C (mg/dl) |
119.5±43.6 |
127.4±49.4 |
151.9±64.1 |
130.7±40.8 |
0.342* |
|
AST (U/L) |
35(32-36) |
34(34-36) |
34(27-36) |
34.5(32-38) |
0.677** |
|
ALT (U/L) |
18(12.7-24) |
17(13-23.5) |
18(11-28.5) |
16(14-27.5) |
0.997** |
|
Serum albumin (g/dl) |
4.17±0.17 |
4.08±0.15 |
3.88±0.31 |
3.37±0.55 |
<0.001* |
|
Albuminuria (g/24h) |
1.1(0.8-1.2) |
1.7(1.6-1.9) |
2.3(1.5-2.9) |
4.7(4.6-6.2) |
<0.001** |
|
Proteinuria (g/24h) |
2.39(2.1-2.51) |
2.95(2.7-3.27) |
3.62(2.84-4.3) |
5.96(3.92-7.5) |
<0.001** |
|
*ANOVA test, **Kruskal-Wallis test, normally distributed variables were presented as mean±standart deviation, non-normally distributed variables were presented as median (interquartile range 25-75). |
|||||
DISCUSSION
In this cross-sectional study, patients with IgAN having higher GGT levels were found to have higher proteinuria. No earlier study could be found in the literature comparing GGT and proteinuria in patients with idiopathic IgAN. This study is not the first study researching relationship between GGT and kidney diseases.
Albuminuria and proteinuria are prognostic markers for mortality and end-stage renal disease in patients with chronic kidney disease.9-11 Serum GGT level is also another indicator of endothelial dysfunction.12 In this study, the authors hypothesised that they may find higher albuminuria in patients with IgAN who have increased GGT levels. It was found that patients with IgAN having higher GGT levels have higher albuminuria. Although it is not possible to establish a cause-effect relationship due to the design of this study, some theories can be put forward regarding the results of this study.
Galactose deficient IgA1(Gd-IgA1) is the major IgA depositing mesangial matrix in patients with IgAN.13 It has been shown that serum Gd-IgA1 levels may have diagnostic and prognostic significance in patients with IgAN.14 Studies show that increased serum Gd-IgA1 levels may be associated with lower hepatic catabolism rather than a basic increase in production.15,16 GGT is an enzyme that is found in many organs throughout the body with the highest concentrations found in the liver. Increased serum GGT levels in patients with IgAN having higher albuminuria may be an indicator of decreased hepatic catabolism of Gd-IgA1. The most common secondary causes of IgAN are liver diseases.17,18 The fact that the most common cause of secondary IgAN is a liver disease also suggests that there may be a relationship between GGT elevation and IgAN.
Ko et al. found an association between higher GGT within the normal reference range with albuminuria in non-diabetic patients with preserved kidney functions.8 Li et al. also found an association between albuminuria and serum GGT levels in a population-based study.19 In these two studies, it was emphasised that GGT is associated with obesity and metabolic syndrome and therefore may be associated with albuminuria and proteinuria. Although in this study, GGT groups were similar in terms of the components of metabolic syndrome such as fasting blood glucose, triglycerides, hypertension, and obesity, it was found that albuminuria and proteinuria increased as GGT levels increased in patients with idiopathic IgAN. This supports that different mechanisms play a role in the relationship between GGT and proteinuria in patients with idiopathic IgAN.
In addition, GGT acts as a cell surface enzyme that metabolizes glutathione which is the main antioxidant of cells.20 Therefore, increased GGT levels are generally accepted as an early and reliable indicator of oxidative stress.21 There are many studies in the literature supporting that increased oxidative stress may cause progression to albuminuria and chronic kidney disease.22,23 Also, a meta-analysis found that albuminuria in diabetic kidney disease may be slowed by any antioxidant supplement.24 The increase in albuminuria and proteinuria as GGT increased in patients suggested that GGT may also be a marker of oxidative stress.
Gowrishankar et al. showed that the MEST-C score shows an association with clinical variables in patients with IgAN.25 In this study mesangial cellularity, segmental glomerulosclerosis, and tubular atrophy were relatively higher in Q3 and Q4 groups, but in post-hoc analysis, only Q4 had a higher rate of mesangial cellularity than Q2 and Q3 had a higher rate of tubular atrophy than Q1. These findings suggest that GGT may also be effective on pathological findings. The authors think that GGT may have affected the pathological features as an indicator of oxidative stress.
There are some limitations of this study. Retrospective design and a limited number of patients are two of them. Since these patients were diagnosed with hypertension and Diabetes mellitus before renal biopsy, some used angiotensin-converting enzyme inhibitors or angiotensin receptor blockers that may affect proteinuria. Another limitation was that no causality could be established due to the cross-sectional nature of this study.
CONCLUSION
The present study showed that increased serum GGT levels accompany increased proteinuria in patients with idiopathic IgAN. Larger-scale, prospective, and well-designed studies investigating the pathophysiological mechanisms between GGT and IgAN may clarify this issue.
ETHICAL APPROVAL:
Before the start of the study, ethics committee approval was obtained from Afyonkarahisar Health Sciences University Ethics Committee (Ethical Committee Code: 2011-KAEK-2) with the decision numbered 531 at the meeting dated 03.12.2021 and number 13.
PATIENTS’ CONSENT:
Not applicable.
COMPETING INTEREST:
The authors declared no competing interest.
AUTHORS’ CONTRIBUTION:
SK, OT, EDK, CO, SK, HA: Designed the study.
SK, OT, EDK, CO: Collected the data.
SK, EDK, CO, SK, HA: Done the literature search.
SK, OT, EDK, SK, HA: Supervised the research.
SK, EDK, SK, HA: Had done the analysis.
SK, OT, EDK: Drafted the manuscript.
OT, EDK, CO, HA: Critically reviewed the manuscript.
All the authors have approved the final version of the manuscript to be published.
REFERENCES
- McGrogan A, Franssen CFM, de Vries CS. The incidence of primary glomerulonephritis worldwide: A systematic review of the literature. Nephrology Dialysis Transplantation 2011; 26(2):414-30. doi: 10.1093/ndt/gfq665.
- Roberts ISD, Cook HT, Troyanov S, Alpers CE, Amore A, Barratt J, et al. The of IgA nephropathy: Pathology definitions, correlations, and reproducibility. Kidney Int 2009; 76(5):546-6. doi: 10.1038/ki.2009.168.
- Haas M, Verhave JC, Liu Z-H, Alpers CE, Barratt J, Becker JU, et al. A multicenter study of the predictive value of crescents in ıga nephropathy. J Am Soc Nephrol 2017; 28(2):691-701. doi: 10.1681/ASN.2016040433.
- Berthoux F, Mohey H, Laurent B, Mariat C, Afiani A, Thibaudin L. Predicting the risk for dialysis or death in IgA nephropathy. J Am Soc Nephrol. 2011; 22(4):752-61. doi: 10.1681/ASN.2010040355.
- Wakai K, Kawamura T, Endoh M, Kojima M, Tomino Y, Tamakoshi A, et al. A scoring system to predict renal outcome in IgA nephropathy: From a nationwide prospective study. Nephrol Dial Transplant 2006; 21(10):2800-8. doi: 10.1093/ndt/gfl342.
- Meister A. The gamma-glutamyl cycle. Diseases associated with specific enzyme deficiencies. Ann Intern Med 1974; 81(2):247–53. doi: 10.7326/0003-4819-81-2-247.
- Wang J, Zhang D, Huang R, Li X, Huang W. Gamma-glutamyltransferase and risk of cardiovascular mortality: A dose-response meta-analysis of prospective cohort studies. PLoS One 2017; 12(2):e0172631. doi: 10.1371/journal.pone.017 2631.
- Ko SH, Baeg MK, Han K Do, Ko SY, Shin SB, Ko SH, et al. Association between gamma-glutamyltransferase and albuminuria in nondiabetic adults with normal renal function. Clin Exp Nephrol. 2017; 21(5):835-41. doi: 10.1007/s10157- 016-1356-7.
- Astor BC, Matsushita K, Gansevoort RT, van der Velde M, Woodward M, Levey AS, et al. Lower estimated glomerular filtration rate and higher albuminuria are associated with mortality and end-stage renal disease. A collaborative meta-analysis of kidney disease population cohorts. Kidney Int 2011; 79(12):1331-40. doi: 10.1038/ki.2010.550.
- Murton M, Goff-Leggett D, Bobrowska A, Garcia Sanchez JJ, James G, Wittbrodt E, et al. Burden of chronic kidney disease by KDIGO categories of glomerular filtration rate and albuminuria: A systematic review. Adv Ther 2021; 38(1):180-200. doi: 10.1007/s12325-020-01568-8.
- Kelly JT, Su G, Zhang L, Qin X, Marshall S, González-Ortiz A, et al. Modifiable lifestyle factors for primary prevention of CKD: A systematic review and meta-analysis. J Am Soc Nephrol 2021; 32(1):239-53. doi: 10.1681/ASN.20200 30384.
- Yilmaz MI, Turgut F, Kanbay M, Saglam M, Sonmez A, Yaman H, et al. Serum gamma-glutamyltransferase levels are inversely related to endothelial function in chronic kidney disease. Int Urol Nephrol 2013; 45(4):1071-8. doi: 10. 1007/s11255-012-0354-2.
- Ebefors K, Liu P, Lassén E, Elvin J, Candemark E, Levan K, et al. Mesangial cells from patients with IgA nephropathy have increased susceptibility to galactose-deficient IgA1. BMC Nephrol 2016; 17:40. doi: 10.1186/s12882-016-0251-5.
- Kim JS, Hwang HS, Lee SH, Kim YG, Moon JY, Kong JY, et al. Clinical relevance of serum galactose deficient IgA1 in patients with IgA nephropathy. J Clin Med 2020; 9(11):3549. doi: 10.3390/jcm9113549.
- Tomana M, Phillips JO, Kulhavy R, Mestecky J. Carbohydrate-mediated clearance of secretory IgA from the circulation. Mol Immunol 1985; 22(8):887-92. doi: 10.1016/0161- 5890(85)90074-4.
- Novak J, Julian BA, Tomana M, Mestecky J. Progress in molecular and genetic studies of IgA nephropathy. J Clin Immunol 2001; 21(5):310-27. doi: 10.1023/a:1012284402054.
- Saha MK, Julian BA, Novak J, Rizk DV. Secondary IgA nephropathy. Kidney Int 2018; 94(4):674-81. doi: 10.1016/j.kint.2018.02.030.
- Pouria S, Feehally J. Glomerular IgA deposition in liver disease. Nephrology Dialysis Transplantation 1999; 14(10):2279–82. doi: 10.1093/ndt/14.10.2279.
- Li M, McDermott R. Albuminuria and its associated biomedical factors among indigenous adults in far North Queensland: A 7-year follow up study. BMC Nephrol 2015; 16:208. doi: 10.1186/s12882-015-0200-8.
- Heisterkamp N, Groffen J, Warburton D, Sneddon TP. The human gamma-glutamyltransferase gene family. Hum Genet 2008; 123(4):321-32. doi: 10.1007/s00439-008- 0487-7.
- Koenig G, Seneff S. Gamma-Glutamyltransferase: A predictive biomarker of cellular antioxidant ınadequacy and disease risk. Dis Markers 2015; 2015:818570. doi: 10. 1155/2015/818570.
- Jha JC, Banal C, Chow BSM, Cooper ME, Jandeleit-Dahm K. Diabetes and kidney disease: Role of oxidative stress. Antioxid Redox Signal 2016; 25(12):657-84. doi: 10. 1089/ars.2016.6664.
- Nerpin E, Helmersson-Karlqvist J, Risérus U, Sundström J, Larsson A, Jobs E, et al. Inflammation, oxidative stress, glomerular filtration rate, and albuminuria in elderly men: A cross-sectional study. BMC Res Notes 2012; 5:537. doi: 10.1186/1756-0500-5-537.
- Bolignano D, Cernaro V, Gembillo G, Baggetta R, Buemi M, D’Arrigo G. Antioxidant agents for delaying diabetic kidney disease progression: A systematic review and meta-analysis. PLoS One 2017; 12(6):e0178699. doi: 10.1371/journal.pone.0178699.
- Gowrishankar S, Gupta Y, Vankalakunti M, Gowda KK, Kurien AA, Jansi Prema KS, et al. Correlation of oxford MEST-C scores with clinical variables for IgA nephropathy in South India. Kidney Int Reports 2019; 4(10):1485-90. doi: 10. 1016/j.ekir.2019.06.013.