Relationship between the Properties of Paraspinal Muscles and Bone Mineral Density in Osteoporotic Patients
By Zeynep Nilufer Tekin1, Bilinc Dogruoz Karatekin2Affiliations
doi: 10.29271/jcpsp.2022.09.1137ABSTRACT
Objective: To investigate the properties of paraspinal muscle structures in osteoporotic patients, lumbar computed tomography (CT) and their relationship with lumbar and femoral neck bone mineral density (BMD).
Study Design: A Descriptive study.
Place and Duration of Study: Department of Radiology and Physical Medicine, Istanbul Medeniyet University, Goztepe Prof Dr Suleyman Yalcin City Hospital, Istanbul, Turkey, between June 2020 and June 2021.
Methodology: Ninety patients with osteoporosis, who received lumbar spine CT and dual-energy X-ray absorptiometry (DEXA) examinations, were retrospectively included. Cross-sectional areas (CSA), densities, index values, and Hounsfield unit average calculation(HUAC) values were measured for psoas, multifidus, erector spinae, and quadratus lumborum muscles at the L3 level, and their associations with BMD were investigated.
Results: A total of 90 patients including 71 females were evaluated. The mean age was 63.31±11.90 years. A moderate correlation of lumbar spine (r=0.32, p<0.01) and femur neck BMD (r=0.28, p<0.05) with erector spinae CSA was defined. Small correlation between psoas CSA (r=0.28, p<0.05) and psoas muscle index (PMI, r=0.24, p<0.05) with lumbar spine BMD was found. The CSA of all the paraspinal muscles (p<0.01) and densities, except psoas muscle (p<0.05), were higher in males. In non-obese osteoporotic patients, the density and HUAC values of the paraspinal muscles, except the psoas muscle, were found to be significantly higher (p<0.05).
Conclusion: The properties of the paraspinal muscles measured by the lumbar CT scan are found to be related to BMD. The psoas and erector spinae CSA and index values are the most significantly associated parameters with the lumbar spine BMD.
Key Words: Bone mineral density, Computed tomography, Osteoporosis, Paraspinal muscles, Psoas.
INTRODUCTION
Osteoporosis is a progressive metabolic bone disease characterised by the deterioration of the microarchitecture of bone tissue, resulting in low-bone mass and increased bone fragility.1 The muscle and bone tissues interact with each other.2 Osteosarcopenia is the result of decreased differentiation and proliferation ability of mesenchymal stem cells, which are the origin of muscle and bone cells. Since there is no consensus for the diagnostic criteria of osteosarcopenia, its prevalence is variable and has been reported as 5-37% in community-dwelling individuals over 65 years.2
The relationship between the paraspinal muscles and the vertebral column has gained increasing importance nowadays. Since the paraspinal muscles are highly related to the vertebral column, both positionally and functionally, they are extremely important for stabilisation of the spine and maintenance of balance and mobility.3 The changes in paraspinal muscle mass and structures are expected by the same mechanisms in osteoporotic patients. Evidence on whether osteoporosis leads to the changes in paraspinal musculature is lacking. The evaluation of the paraspinal muscles and their potential interactions with various imaging methods may provide better information about the pathophysiological mechanisms of osteoporosis. The computed tomography (CT) scan and magnetic resonance imaging (MRI) are the gold standard for the quantifying skeletal muscle mass, as they provide cross-sectional images that allow segmental and total measurement of the fat and non-fat mass.4,5 Yao et al. reported that CT findings, especially skeletal muscle density, correlated with the clinical features expressed by the SARC-F questionnaire and FRAIL scale.6
It was therefore hypothesise that paraspinal muscles' height-adjusted cross-sectional areas (CSA) and densities were associated with bone mineral density (BMD). The aim of this study was to investigate the characteristics of paraspinal muscle structures in lumbar CT scan and their relationship with lumbar and femoral neck BMD in patients with osteoporosis.
METHODOLOGY
This is a descriptive study. The requirement for informed consent has been waived as it is a retrospective review. Inclusion criteria of the study were: having osteoporosis diagnosis; underwent lumbar spine CT; and had dual-energy X-ray absorptiometry (DEXA) scans within a maximum 3 months interval from CT acquisition between June 2020 and June 2021. DEXA was considered as gold standard method for the diagnosis of osteoporosis.7 Exclusion criteria were: non-osteoporotic metabolic diseases (eg. renal osteodystrophy); pathological vertebral fractures; other pathological bone disorders (eg. bone tumours); haematological disorders; morphological spine and/or hip spinal pathologies that produce asymmetry (eg. scoliosis); and patients whose image quality was not sufficient to assess, or CSA could not be performed because the muscle group did not enter the imaging field. The age, gender, body mass index (BMI), and BMD were recorded. All the axial CT images were evaluated by a senior radiologist.
All the patients had undergone multislice lumbar CT examinations, that were performed with a 64-detector CT scanner (GE Optima CT660 GE Healthcare, Milwaukee, WI) by using a helical lumbar spine protocol. The CT image data was collected with a GE system equipped with a 512×512 matrix detector. The helical scanning region was performed in supine position without the gantry angle, covering mid-T12 to mid-S3. The images was obtained using acquisition 24x1.2 mm, slice collimation 1.2 mm with, slice width 25 mm, pitch 0.98, 120 KV, and 75 mAs. Axial imaging data were post-processed (GE workstation, GE Healthcare, Milwaukee, WI), and 1.25 mm coronal and sagittal reconstructions were performed. The elliptical regions of interest (ROIs) were drawn by outlining the fascial boundary of the paraspinal muscles on the soft tissues window of a single axial slice of the lumbar CT scan on the level of L3-endplate, using the Radx PACS system (Simplex Radx 3D, Ankara, Turkey, Figure 1).
Paraspinal muscle indices were calculated as (right area+left area) /height2 and expressed as cm2 /m2. HUAC was determined as (right CSA x density) + (left CSA x density) / total CSA.
The dual-energy X-ray absorptiometry (DEXA; OsteoSys Primus, Seoul, Korea) scan was used to measure BMDs and T-scores calculated from the femoral neck and lumbar spine. According to the World Health Organisation (WHO) criteria, cases with a T-score below -2.5 were considered osteoporotic.8
The descriptive statistics for paraspinal muscles were presented as mean, standard deviation, and maximum-minimum values. The conformity of the numerical variables to the normal distribution was examined using the Shapiro-Wilk test. In order to investigate the differences between two independent groups (gender and BMI groups), non-parametric Mann-Whitney U Test was used since the normality assumption was violated. The relationship between osteoporosis and paraspinal muscle values were analysed by using Pearson’s correlation. Cohen's correlation coefficient classification was used to determine the effect size of the relationship; between 0.10 and 0.29 is defined as small, 0.30 to 0.49 as moderate, and 0.50 to 1.0 as high correlation.9 The difference between the independent group means (BMI and gender) in the paraspinal muscle values using a two-tailed test with alpha of 0.05 was tested by post hoc power analysis using G*Power 3. Since there is missing values for the same measurements, sample size changes. The achieved power results are presented in the tables in parenthesis.
The results were evaluated bilaterally at 95% confidence interval, statistical significance level was taken as 0.05 and 0.01, and SPSS (version 26) package program was used in the analysis.
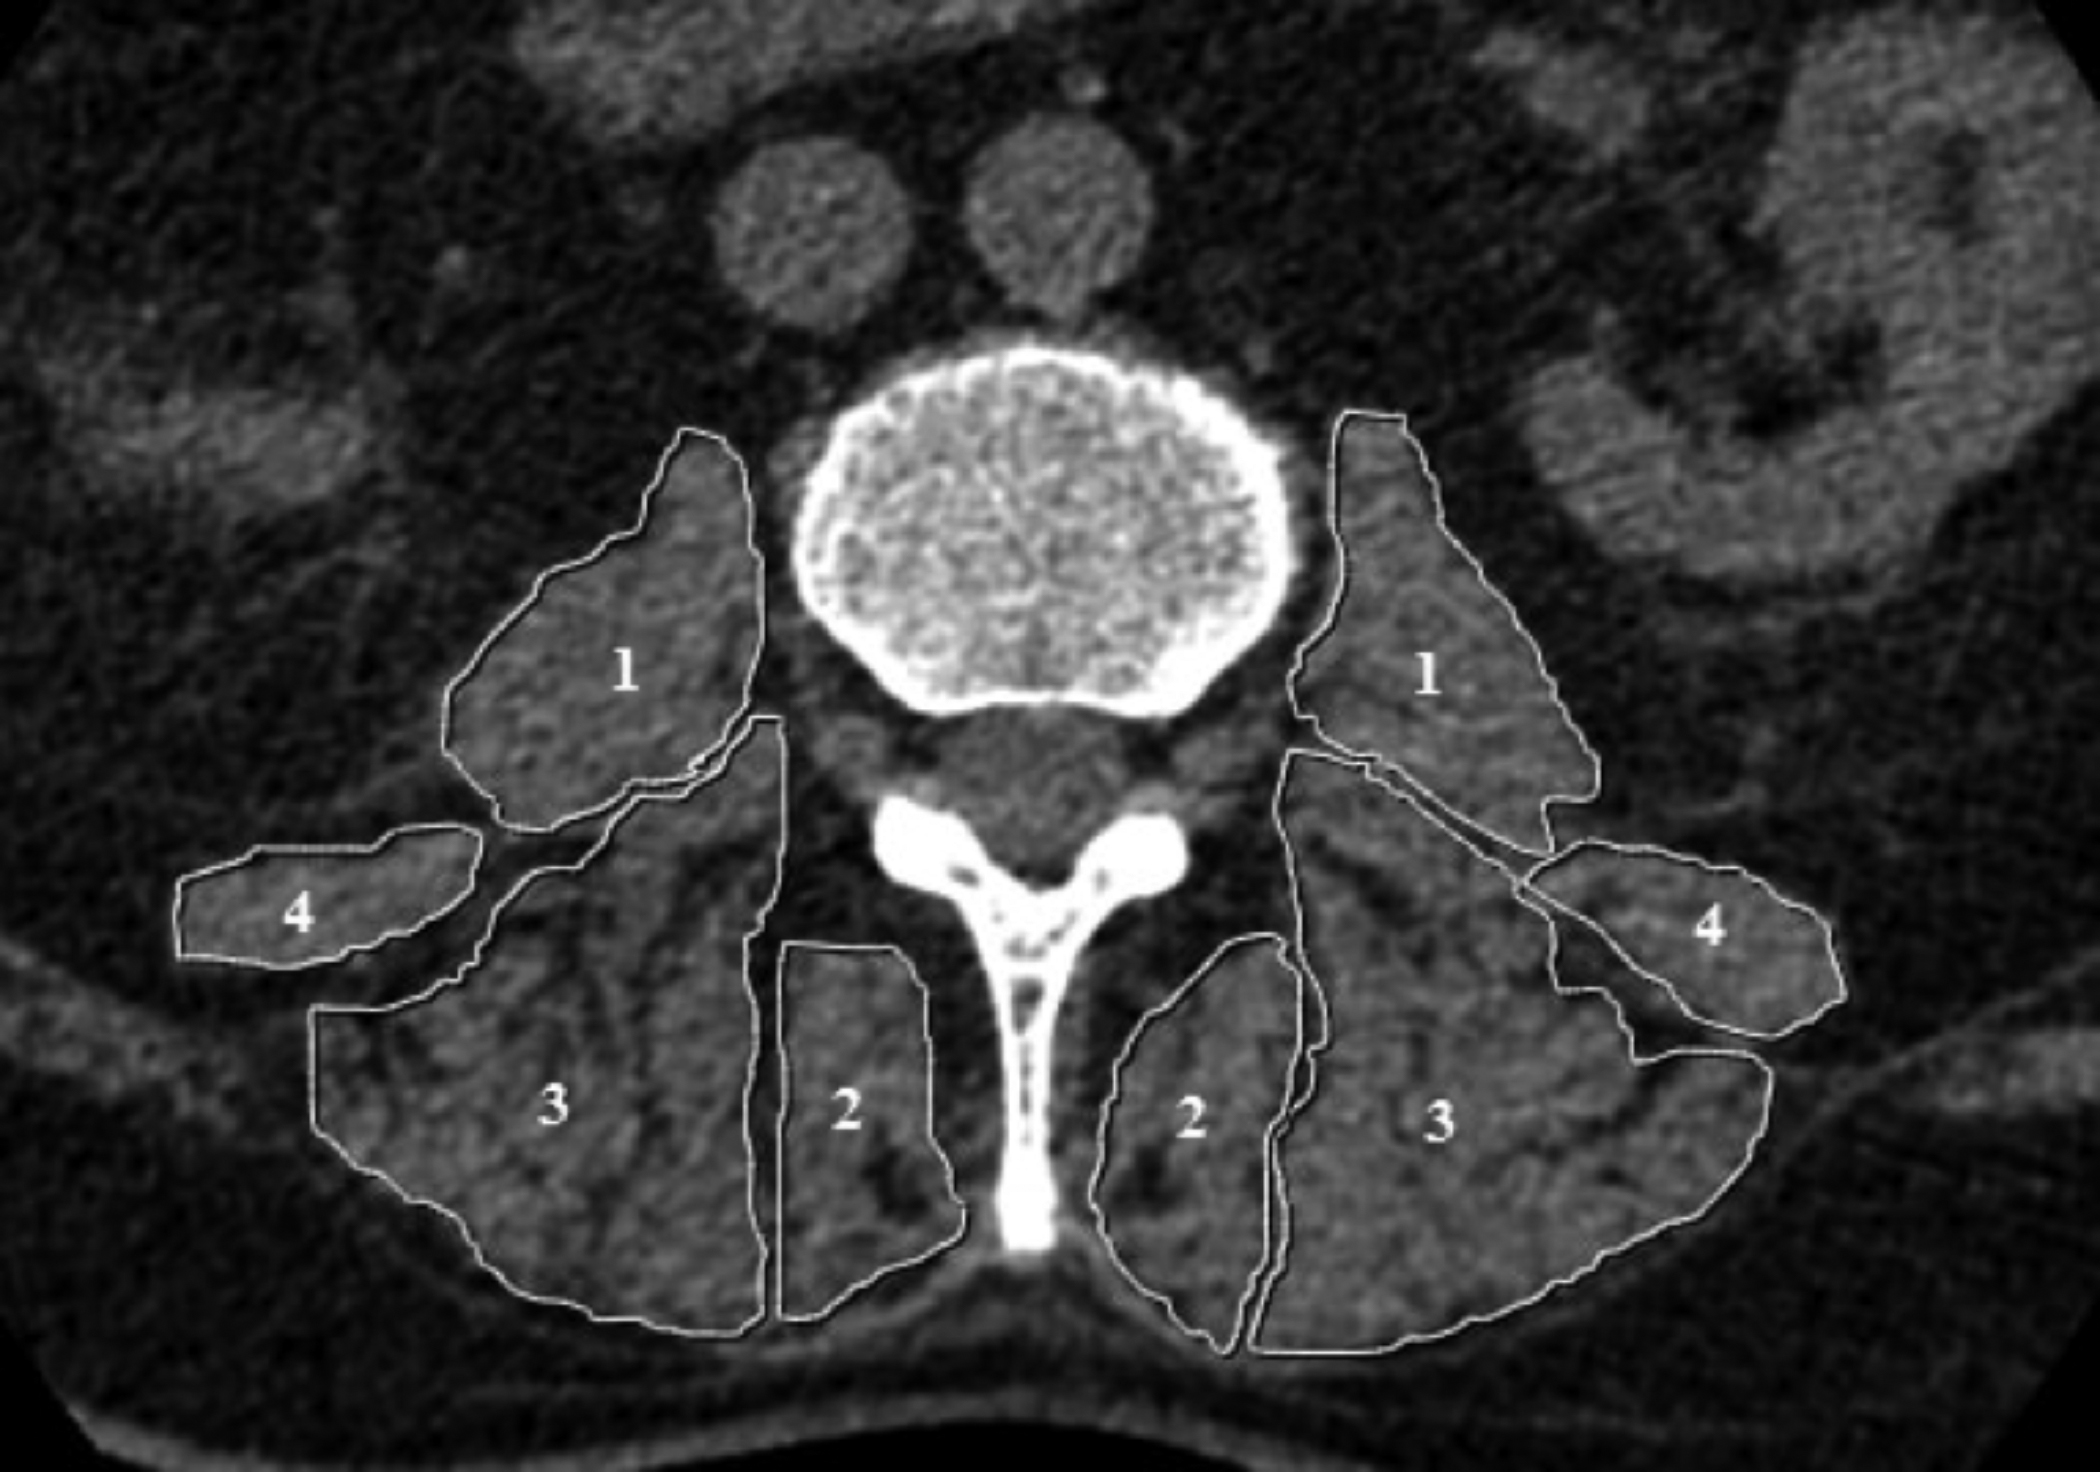 Figure 1: L3 axial CT image showing example ROIs used for calculating the CSA of psoas (1), multifidus (2), erector spinae (3), and quadratus lumborum (3) muscles. CSA: crosssectional area.
RESULTS
Overall, 90 patients were included in this study (71 females and 19 males). The mean age of the participants was 63.31±11.90 years (min: 23, max: 88), of which 71 were females (78.9%) and 19 were males (21.1%). The mean height was 1.58±0.09 m (min: 1.40, max: 1.83), the mean weight was 74.10±13.20 Kg (min: 40, max: 110), and the mean BMI was 29.68±5.04 Kg/m2 (min: 14.69, max: 50.22). The descriptive statistics of mean area, mean density, index, and HUAC values for paraspinal muscles, psoas, multifidus, erector spinae, and quadratus lumborum muscles are shown Table I.
In order to investigate the association between the properties of paraspinal muscles and osteoporosis, Pearson’s r correlation coefficient was calculated. For osteoporosis, L1-4 and femur neck values were analysed separately. Table I shows the correlation coefficients of paraspinal muscles with L1-4 and femur neck. Only with erector spinae muscles’ area, there was a moderate relationship with both L1-4 BMD (r= 0.32, p<0.01) and femur neck BMD (r= 0.28, p<.05).
Table I: Descriptive statistics paraspinal muscles and association between paraspinal muscles and osteoporosis.|
n |
Mean |
SD |
Minimum |
Maximum |
L1 - 4 |
Femur neck |
||
|
Psoas muscle |
|
|
|
|
|
|
||
|
Area |
90 |
671.16 |
270.52 |
0.00 |
1398.10 |
.281** (0.87) |
0.189 |
|
|
Density |
90 |
39.31 |
35.12 |
0.00 |
354.95 |
-.043 |
0.182 |
|
|
Index |
89 |
5.33 |
1.66 |
2.00 |
9.15 |
.245* (0.77) |
0.166 |
|
|
HUAC |
89 |
2.22 |
56.22 |
36.37 |
9.24 |
-.064 |
0.209* (0.64) |
|
|
Multifidus muscle |
|
|
|
|
|
|
||
|
Area |
81 |
503.78 |
153.99 |
135.65 |
892.60 |
.009 |
0.149 |
|
|
Density |
81 |
24.56 |
44.30 |
-36.45 |
361.90 |
.198 |
0.281* (0.83) |
|
|
Index |
81 |
1.27 |
6.85 |
4.01 |
1.18 |
-.070 |
0.016 |
|
|
HUAC |
81 |
-36.57 |
67.40 |
20.46 |
23.05 |
.192 |
0.274* (0.82) |
|
|
Erector spinae muscle |
|
|
|
|
|
|
||
|
Area |
74 |
1700.18 |
850.64 |
998.65 |
8402.95 |
.317** (0.88) |
0.281* (0.80) |
|
|
Density |
74 |
15.48 |
20.93 |
-65.25 |
58.60 |
.069 |
0.134 |
|
|
Index |
74 |
8.49 |
58.15 |
13.54 |
5.78 |
.244* (0.69) |
0.072 |
|
|
HUAC |
74 |
-65.37 |
58.55 |
15.73 |
20.64 |
.082 |
0.143 |
|
|
Quadratus lumborum muscle |
|
|
|
|
|
|||
|
Area |
76 |
380.82 |
130.87 |
171.20 |
787.40 |
.048 |
0.163 |
|
|
Density |
77 |
26.55 |
14.55 |
-27.30 |
63.85 |
.191 |
0.159 |
|
|
Index |
76 |
1.26 |
5.12 |
3.06 |
0.89 |
-.007 |
0.087 |
|
|
HUAC |
76 |
-27.18 |
59.36 |
26.33 |
14.29 |
.189 |
0.153 |
|
|
* p <.05, **p<.01, Post-hoc power analysis values are indicated in parentheses. HUAC: Hounsfield unit average calculation. |
||||||||
Table II: Comparison of paraspinal muscles according to the genders.
|
Female (n=71) |
Male (n=19) |
p |
||||||
|
n |
Median (IQR) |
Mean rank |
n |
Median (IQR) |
Mean rank |
|||
|
Psoas muscles |
|
|
|
|
|
|
||
|
Area |
71 |
550.45 (242.80) |
37.70 |
19 |
1019.45 (464.70) |
74.63 |
<.001 (1.00) |
|
|
Density |
71 |
39.80 (12.35) |
44.41 |
19 |
38.04 (14.95) |
49.58 |
0.44 |
|
|
Index |
70 |
4.67 (1.82) |
38.14 |
19 |
7.49 (2.27) |
70.26 |
<.001 (0.99) |
|
|
HUAC |
70 |
36.83 (12.12) |
44.03 |
19 |
38.42 (14.68) |
48.58 |
0.50 |
|
|
Multifidus muscles |
|
|
|
|
|
|||
|
Area |
63 |
475.40 (121.70) |
36.68 |
18 |
617.55 (281.55) |
56.11 |
<.01 (0.57) |
|
|
Density |
63 |
18.90 (34.10) |
36.52 |
18 |
39.05 (29.29) |
56.69 |
<.01 (0.75) |
|
|
Index |
63 |
3.99 (1.38) |
39.29 |
18 |
4.43 (1.69) |
47.00 |
0.22 |
|
|
HUAC |
63 |
18.67 (33.59) |
36.68 |
18 |
38.70 (27.55) |
56.11 |
<.01 (0.96) |
|
|
Erector spinae muscles |
|
|
|
|
|
|||
|
Area |
57 |
1494.25 (392.80) |
33.44 |
17 |
1818.85 (468.75) |
51.12 |
<.01 (0.23) |
|
|
Density |
57 |
17.80 (24.05) |
34.72 |
17 |
26.95 (30.03) |
46.82 |
<.05 (0.65) |
|
|
Index |
57 |
12.96 (3.10) |
37.30 |
17 |
12.74 (2.58) |
38.18 |
0.88 |
|
|
HUAC |
57 |
17.73 (23.80) |
34.74 |
17 |
27.36 (30.42) |
46.76 |
<.05 (0.63) |
|
|
Quadratus lumborum muscles |
|
|
|
|
|
|||
|
Area |
59 |
338.30 (94.25) |
34.22 |
17 |
512.45 (285.60) |
53.35 |
<.01 (0.97) |
|
|
Density |
60 |
24.65 (15.74) |
34.83 |
17 |
34.65 (17.15) |
53.74 |
<.02 (0.92) |
|
|
Index |
59 |
2.89 (1.09) |
35.81 |
17 |
3.56 (1.91) |
47.82 |
<.05 (0.65) |
|
|
HUAC |
59 |
23.93 (15.86) |
34.08 |
17 |
34.56 (17.04) |
53.82 |
<.01 (0.94) |
|
|
Post-hoc power analysis values are indicated in parentheses. HUAC: Hounsfield unit average calculation. |
||||||||
There were small relationship, between psoas area and L1-4 BMD, psoas mucle index (PMI) and L1-4 BMD, psoas HUAC and femur neck BMD, multifidus density and femur neck BMD, multifidus HUAC and femur neck BMD, and erector spinae index and L1-4 BMD.
A post hoc power analysis was conducted to test the association between paraspinal muscles and L1-4 and femur neck BMD. According to the α 0.05, the achieved powers were above 0.80 for psoas area and L1-4 BMD, multifidus density and index with femur neck BMD, and erector spinae area with BMD values of L1-4 and femur neck.
Table II demonstrates the significant differences in paraspinal muscles values of males and females. According to the Mann-Whitney U Test results, males’ area and index of psoas muscles were significantly higher than females (p<0.001) but there was no significant difference in the PMI and psoas HUAC values of males and females (p>0.05). For the multifidus muscles and erector spinae muscles, area, density, and index values of males were higher than females (p<0.01), but there is no significant difference in index values between males and females (p>0.05). In all the parameters (area, density, index, and HUAC) of quadratus lumborum muscles, there were significant differences between males and females i.e. males had higher values than females (p<0.05).
Table III shows the significant differences in paraspinal muscles’ values of obese and non-obese patients. There was no significant differences in all the parameters of psoas muscles (area, density, index, and HUAC) of obese and non-obese patients (p>0.05).
Table III: Comparison of the paraspinal muscles between BMI groups (Non-obese and Obese).|
Non-obese (BMI <30) (n=52) |
Obese (BMI >30) (n=38) |
p |
||||||
|
n |
Median (IQR) |
Mean rank |
n |
Median (IQR) |
Mean rank |
|||
|
Psoas muscles |
|
|
|
|
|
|
||
|
Area |
52 |
629.93 (257.52) |
44.73 |
38 |
638.28 (467.40) |
46.55 |
0.74 |
|
|
Density |
52 |
38.08 (17.08) |
49.31 |
38 |
35.65 (7.66) |
40.29 |
0.10 |
|
|
Index |
52 |
4.76 (2.00) |
42.21 |
37 |
5.52 (3.12) |
48.92 |
0.23 |
|
|
HUAC |
52 |
38.51 (16.91) |
48.46 |
37 |
36.02 (7.40) |
40.14 |
0.13 |
|
|
Multifidus muscles |
|
|
|
|
|
|||
|
Area |
49 |
502.80 (227.30) |
41.08 |
32 |
489.95 (158.69) |
40.88 |
0.97 |
|
|
Density |
49 |
31.60 (36.52) |
45.88 |
32 |
17.55 (30.59) |
33.53 |
<.05 (0.43) |
|
|
Index |
49 |
3.90 (2.03) |
39.76 |
32 |
4.14 (1.04) |
42.91 |
0.56 |
|
|
HUAC |
49 |
31.60 (35.69) |
45.88 |
32 |
17.50 (30.39) |
33.53 |
<.05 (0.51) |
|
|
Erector spinae muscles |
|
|
|
|
|
|||
|
Area |
43 |
1525.85 (419.35) |
35.63 |
31 |
1591.35 (524.40) |
40.10 |
0.38 |
|
|
Density |
43 |
23.80 (98.80) |
43.36 |
31 |
9.40 (26.35) |
29.37 |
<.01 (0.64) |
|
|
Index |
43 |
12.70 (2.12) |
34.09 |
31 |
13.78 (3.29) |
42.23 |
0.11 |
|
|
HUAC |
43 |
23.82 (19.76) |
43.26 |
31 |
8.88 (23.71) |
29.52 |
<.01 (0.62) |
|
|
Quadratus lumborum muscles |
|
|
|
|
|
|||
|
Area |
41 |
338.30 (92.90) |
35.45 |
35 |
388.55 (157.95) |
42.07 |
0.19 |
|
|
Density |
41 |
30.40 (14.38) |
44.38 |
36 |
22.13 (16.01) |
32.88 |
<.05 (0.39) |
|
|
Index |
41 |
2.85 (1.07) |
34.67 |
35 |
3.29 (1.38) |
42.99 |
0.10 |
|
|
HUAC |
41 |
30.64 (14.48) |
44.22 |
35 |
21.64 (15.95) |
31.80 |
<.05 (0.43) |
|
|
Post-hoc power analysis values are indicated in parentheses. |
||||||||
For the paraspinal muscles other than psoas, while there was no significant differences in area and index values between obese and non-obese patients (p>0.05), non-obese patients had significantly higher density and HUAC values than obese patients (p<0.05).
DISCUSSION
The paraspinal muscles including the psoas, multifidus, erector spinae, and quadratus lumborum play an important roles in the stabilisation and movement of the spine.3,10 In this study, the characteristics of the paraspinal muscle structures in lumbar CT scan and their relationship with lumbar and femoral neck BMD were investigated in osteoporotic patients.
Considering the relationship between BMD and the characteristics of the paraspinal muscles; areas and indices of the psoas and erector spinae muscles were found to be associated with lumbar BMD. This may show that psoas and erector spinae muscle areas and indices may be a marker of low-lumbar BMD. Besides, multifidus HUAC value and density, psoas HUAC value and erector spinae area were also found to be associated with femoral neck BMD. There was no relationship between the quadratus lumborum muscle and either L1-4 or femoral neck BMD in terms of area, density, index, and HUAC values.
Globally, it was seen that erector spinae CSA had the highest correlation with both lumbar and femoral neck BMD. Although there are many studies in the literature on the psoas muscle, the erector spinae area is more prominent in this study in terms of the relationship with BMD. In a recent cross-sectional MRI study, fat infiltration of erector spinae and multifidus muscle was found to be significantly higher in osteoporotic subjects than in controls.11 Li et al. also showed a correlation of BMD with erector spinae and multifidus CSA in their study, but this correlation was not found with psoas CSA.12 It is clear that more studies are needed on this subject. In daily practice of neurosurgery and physical medicine and rehabilitation, which are the branches that most frequently encounter patients with osteoporosis and lumbar pathology, patients at the risk of osteoporosis can be identified and BMD can be easily estimated by measuring the muscle CSA without using any software in patients with lumbar CT.
In a recent study, it is reported that PMI cut-off values were 3.2 and 2.87 cm2/m2 for males and females, respectively.13 According to these cut-off values, the patients were not able to be grouped in terms of sarcopenia, as sarcopenia was detected in only 3 individuals. Due to the small number of osteosarcopenic patients, it can be expected the area, density, index, and HUAC values of the paraspinal muscles in this study group to be higher than in the community. Arbanas et al. showed that psoas activity and CSA increased to provide lumbar spine stability in people with back pain.14 The distinction of the lumbar pathologies of the participants is important in this respect; and therefore, should be taken into account in further studies.
Although no relationship was found with sarcopenia, PMI maintains its clinical importance in terms of its relationship with lumbar BMD. Kajiki et al. showed important relationship between PMI and osteoporosis in people with degenerative spinal disease, as DEXA underestimates osteoporosis in patients with degenerative spinal disease.15
The CSA of all the paraspinal muscles was found to be greater in males than females in accordance with the literature.16,17 Except for psoas muscle, the densities and HUAC values of the paraspinal muscles were also found to be higher in men than in women. Kalichman et al. reported that erector spinae and multifidus muscle densities were higher in men.18 In a recent MRI-based study, erector spinae muscle CSA and proton density fat fraction (PDFF) values were found to be significantly higher in men, although the CSA values of the psoas muscle were higher in men, no significant difference was found in PDFF values between the genders.19 Considering that density and HUAC values show muscle quality, and the CSA shows muscle quantity, it can be concluded that although the quantity of muscle in men is higher for all the muscles measured, the quality of the psoas muscle, unlike other paraspinal muscles, does not differ according to the gender.
The density and HUAC values of the multifidus, erector spinae, and quadratus lumborum muscles were found to be significantly higher in non-obese patients compatible with the literature18 apart from the psoas muscle. According to these results, it can be revealed that psoas muscle density and HUAC measurements are independent of gender and BMI. Furthermore, although sarcopenia is not detected by PMI in obese patients, there is a decrease in paraspinal muscle density and HUAC values compared to the non-obese patients. Since the mean BMI of the patients in this study group was high, obesity-associated sarcopenia may have been underestimated when evaluated with PMI. More studies are needed on the validity of PMI in the evaluation of sarcopenia in obese osteoporotic patients.
Limitations of the study are multiple. No prior sample size calculations are made. The number of the male participants is low, although this is to be expected as women are more likely to be diagnosed with osteoporosis. Because subjects undergoing lumbar CT are included in the study, there is a high probability of lumbar spine pathology in the study sample than in the general population. Due to the retrospective design of the study, this distinction cannot be made. In future, prospective studies would be useful to investigate the differences in osteoporosis severity between the patients with and without lumbar pathology.
CONCLUSION
The properties of the paraspinal muscles measured by lumbar spine CT are found to be related to BMD. The most significantly associated parameters with lumbar spine BMD are psoas and erector spinae muscles’ CSA and index values. Osteoporotic men have higher paraspinal muscle CSA and densities than women. Multifidus, erector spinae, and quadratus lumborum muscle densities are higher in non-obese osteoporotic patients.
FUNDING:
The authors declare that no funds, grants, or other support were received during the preparation of this manuscript.
ETHICAL APPROVAL:
This study was performed in line with the principles of the Declaration of Helsinki. Approval was granted by the Ethics Committee of Istanbul Medeniyet University (24.09.2021/No 2021/0463).
PATIENTS’ CONSENT:
In keeping with the policies for a retrospective review, informed consent requirement was waived.
COMPETING INTEREST:
The authors declared no competing interest.
AUTHORS’ CONTRIBUTION:
BDK: Design, analysis, drafting, and final approval.
ZNT: Design, acquisition, analysis, revising, and final approval.
All the authors have approved the final version of the manuscript to be published.
REFERENCES
- NIH Consensus development panel on osteoporosis prevention, diagnosis, and therapy, March 7-29, 2000: Highlights of the conference. South Med J 2001; 94(6): 569-73.
- Kirk B, Zanker J, Duque G. Osteosarcopenia: Epidemiology, diagnosis, and treatment-facts and numbers. J Cachexia Sarcopenia Muscle 2020; 11(3): 609-18. doi: 10.1002/jcsm.12567.
- Fortin M, Lazary A, Varga PP, Battie MC. Association between paraspinal muscle morphology, clinical symptoms and functional status in patients with lumbar spinal stenosis. Eur Spine J 2017; 26(10):2543-51. doi: 10. 1007/s00586-017-5228-y.
- Cruz-Jentoft AJ, Bahat G, Bauer J, Boirie Y, Bruyère O, Cederholm T, et al. Sarcopenia: Revised European consensus on definition and diagnosis. Age Ageing 2019; 48(1):16-31. doi: 10.1093/ageing/afy169.
- Erlandson MC, Lorbergs AL, Mathur S, Cheung AM. Muscle analysis using pQCT, DXA and MRI. Eur J Radiol 2016; 85(8):1505-11. doi: 10.1016/j.ejrad.2016.03.001.
- Yao L, Petrosyan A, Fuangfa P, Lenchik L, Boutin RD. Diagnosing sarcopenia at the point of imaging care: Analysis of clinical, functional, and opportunistic CT metrics. Skeletal radiol 2021; 50(3):543-50. doi: 10. 1007/ s00256-020-03576-9.
- Roux C, Briot K. Current role for bone absorptiometry. Joint bone spine 2017; 84(1):35-7. doi: 10.1016/j.jbspin. 2016.02.032.
- Dimai HP. Use of dual-energy X-ray absorptiometry (DXA) for diagnosis and fracture risk assessment; WHO-criteria, T- and Z-score, and reference databases. Bone 2017; 104:39-43. doi: 10.1016/j.bone.2016.12.016.
- Cohen J. Statistical power analysis for the behavioral sciences. Second edition. ed. Yagi M, Hosogane N, Watanabe K, Asazuma T, Matsumoto M. The paravertebral muscle and psoas for the maintenance of global spinal alignment in patient with degenerative lumbar scoliosis. Spine J 2016; 16(4):451-8. doi: 10. 1016/j.spinee.2015.07.001.
- Yagi M, Hosogane N, Watanabe K, Asazuma T, Matsumoto M. The paravertebral muscle and psoas for the maintenance of global spinal alignment in patient with degenerative lumbar scoliosis. Spine J 2016; 16(4): 451-8. doi: 10.1016/j.spinee.2015.07.001.
- Han G, Zou D, Liu Z, Zhou S, Li W, Gong C, et al. Paraspinal muscle characteristics on MRI in degenerative lumbar spine with normal bone density, osteopenia and osteoporosis: A case-control study. BMC Musculoskelet Disord 2022; 23(1):73. doi: 10.1186/s12891-022-05036-y.
- Li X, Xie Y, Lu R, Zhang Y, Tao H, Chen S. Relationship between oseteoporosis with fatty infiltration of paraspinal muscles based on QCT examination. J Bone Miner Metab 2022; 40(3):518-27. doi: 10.1007/s00774- 022-01311-z.
- Ufuk F, Herek D. Reference skeletal muscle mass values at L3 vertebrae level based on computed tomography in healthy turkish adults. Int J Gerontol 2019; 13:221-5. doi: 10.6890/IJGE.201909_13(3).0008.
- Arbanas J, Pavlovic I, Marijancic V, Vlahovic H, Starcevic-Klasan G, Peharec S, B, et al. MRI features of the psoas major muscle in patients with low back pain. Eur Spine J 2013; 22(9):1965-71. doi: 10.1007/s00586-013- 2749-x.
- Kajiki Y, Tsuji H, Misawa H, Nakahara R, Tetsunaga T, Yamane K, et al. Psoas muscle index predicts osteoporosis and fracture risk in individuals with degenerative spinal disease. Nutrition 2022; 93:111428. doi: doi.org/10.1016/j.nut.2021.111428.
- Schlaeger S, Inhuber S, Rohrmeier A, Dieckmeyer M, Freitag F, Klupp E, et al. Association of paraspinal muscle water-fat MRI-based measurements with isometric strength measurements. Eur Radiol 2019; 29(2): 599-608. doi: 10.1007/s00330-018-5631-8.
- Sollmann N, Franz D, Burian E, Loffler MT, Probst M, Gersing A, et al. Assessment of paraspinal muscle characteristics, lumbar BMD, and their associations in routine multi-detector CT of patients with and without osteoporotic vertebral fractures. Eur Radiol 2020; 125:108867. doi.org/10.1016/j.ejrad.2020.108867.
- Kalichman L, Hodges P, Li L, Guermazi A, Hunter DJ. Changes in paraspinal muscles and their association with low back pain and spinal degeneration: CT study. Eur Spine J 2010; 19(7):1136-44. doi: 10.1007/s00586- 009-1257-5.
- Burian E, Syvari J, Holzapfel C, Drabsch T, Kirschke JS, Rummeny EJ, et al. Gender- and age-related changes in trunk muscle composition using chemical shift encoding-based water⁻fat MRI. Nutrients 2018; 10(12). doi: 10. 3390/nu10121972.