Referral Profile of Developmental Disabilities at a Tertiary Care Hospital in a Resource-limited Country
By Sidra Kaleem Jafri1, Anusha Alam2, Hassan Raja2, Nasreen Gulzar Ali1, Fariha Shaheen1, Shahnaz Hamid Ibrahim1
Affiliations
doi: 10.29271/jcpsp.2023.08.944ABSTRACT
The burden and the spectrum of neuro-developmental disabilities are well-established in the developed countries, however, they continue to be a challenge in the Low Middle-Income Countries. The aim of this study was to present the referral profile and trends of developmental disabilities in the child development centre of The Agha khan University, from 2012 to 2021. All children (1 month to 18 years), who had undergone diagnostic evaluations for suspected neurodevelopmental disabilities were included. A total of 1340 children were evaluated at the centre. The mean age of the children at the presentation was 5.4 ± 3.0 years. Male to female ratio was 3:1. Autism Spectrum Disorder (ASD) was the most common diagnosis (n=446, 33.3%). This study highlights a considerable burden and an increasing trend of children being referred for suspected developmental disabilities in Pakistan.
Key Words: Developmental disabilities, Referral, Pakistan, Autism spectrum disorder.
Neurodevelopmental disabilities (NDD) are a diverse group of chronic disorders that affect the functions of the central nervous system (CNS). They are due to an impairment in the physical, learning, language, or behaviour areas of functioning during the developmental period, and often last throughout an individual’s lifetime.1 Autism spectrum disorder (ASD), attention deficit hyperactivity disorder (ADHD), intellectual disability (ID), sensory and motor impairments, language disorder, and learning disorders are all part of NDDs. The aetiology of neurodevelopmental disorders is largely multifactorial, including antenatal infections, genetic abnormalities, exposure to toxins, and idiopathic aetiologies.1
Approximately 95% of the children and families affected by developmental disabilities are residing in developing countries, however, the major contribution in the literature related to developmental disabilities is from developed countries.2
Developmental disabilities have an estimated prevalence of 17% in the USA, in individuals younger than 18 years of age, while the estimated prevalence of developmental disorders in rural Pakistan is around 0.5 to 7%.3 However, there is a lack of local data about the types and the trends.
Thus, this study aims to assess the referral profile of developmental disabilities in a tertiary care facility in Pakistan over the last decade and study how the trends of presenting patients have changed over the years.
Following approval from the Institutional Ethics Review Committee, a retrospective cross-sectional study was carried out at a local child development center in a private tertiary care hospital. This centre caters to all kinds of neuro-developmental disabilities in children. The team comprises of pediatric neurologists, developmental pediatrician, child psychologists, behaviour, and occupational and speech therapists.
All children (1 month to 18 years), who had undergone diagnostic evaluations for suspected neurodevelopmental disabilities at the CDRC from 1st January 2012 to 31st December 2021 were included in the study. Data were collected by reviewing the patients’ files on a predesigned proforma.
The data were analysed and tabulated using IBM SPSS Statistics for Windows, version 23.0 (IBM Corp., Armonk, N.Y., USA). Continuous variables were reported as Mean ± Standard Deviation while categorical variables were reported as frequency and percentage. Trends of developmental disabilities in terms of referrals and developmental disabilities diagnoses with percentage change were also calculated.
There were a total of 1340 children. The socio-demographic characteristics of the patients are displayed in Table I. Out of 1340 children, 20.4% (n=273/1339) of the referred children were younger than 3 years of age. Seventy-six percent (n=1022/1340) of the children assessed were boys, and 50% (n=601) of the children were firstborns.
Table I: Demographics and parental factors.
|
Total number of children assessed |
1340 |
|
Age in years |
5.4 ± 3.0 |
|
Age categories (n=1339) |
|
|
<3 years |
273 (20.4%) |
|
3-4 years |
478 (35.7%) |
|
5-10 years |
479 (35.8%) |
|
>10 years |
110 (8.2%) |
|
Gender |
|
|
Male |
1,022 (76.3%) |
|
Female |
318 (23.7%) |
|
Residence (n=812) |
|
|
Urban |
728 (89.7%) |
|
Rural |
84 (10.3%) |
|
Reason for referral (n=1333) |
|
|
Speech delay |
572 (42.9%) |
|
Learning issues |
133 (10.0%) |
|
Behavioural issues |
214 (16.1%) |
|
Development delay |
176 (13.2%) |
|
Poor understanding |
74 (5.6%) |
|
Hyperactivity |
127 (9.5%) |
|
Poor attention |
37 (2.8%) |
|
Mode of delivery (n=1311) |
|
|
Spontaneous vertex delivery |
665 (50.7%) |
|
Cesarean |
646 (49.3%) |
|
Gestational age (n=1316) |
|
|
Term |
1,174 (89.2%) |
|
Preterm |
142 (10.8%) |
|
Place of delivery (n=1316) |
|
|
Home |
5 (0.4%) |
|
Hospital |
1,311 (99.6%) |
|
Number of siblings excluding patient (n=1239) |
1.4 ± 1.2 |
|
Birth order (n=1212) |
2.3 ± 6.9 |
|
Firstborn |
601 (49.6%) |
|
Disability in siblings |
73 (5.5%) |
|
Consanguinity (n=1270) |
418 (32.9%) |
|
Family type (n=422) |
|
|
Joint |
255 (60.4%) |
|
Nuclear |
151 (35.8%) |
|
Single parent |
16 (3.8%) |
|
Maternal age, years (n=1075) |
27.6 ± 6.8 |
|
Maternal education (n=1051) |
|
|
Primary or less |
53 (5.0%) |
|
Secondary |
272 (25.9%) |
|
Graduation or higher |
726 (69.1%) |
|
Maternal employment (n=1086) |
|
|
Selfemployed |
12 (1.1%) |
|
Employed |
123 (11.3%) |
|
Unemployed |
951 (87.6%) |
|
Maternal history of development disability (N=1340) |
59 (4.4%) |
|
Paternal age, years (n=1036) |
32.8 ± 5.5 |
|
Paternal education (n = 1066) |
|
|
Primary or less |
22 (2.1%) |
|
Secondary |
165 (15.5%) |
|
Graduation or higher |
879 (82.5%) |
|
Paternal employment (n = 1075) |
|
|
Self-employment |
309 (28.7%) |
|
Employment |
746 (69.4%) |
|
Unemployed |
20 (1.9%) |
|
Paternal history of development disability (n=1093) |
80 (7.3%) |
|
Single diagnosis |
1030 (77%) |
|
Dual diagnoses |
155 (11.5%) |
|
No developmental disabilities identified |
155 (11.5%) |
|
Data presented as mean ± sd and n (%) |
|
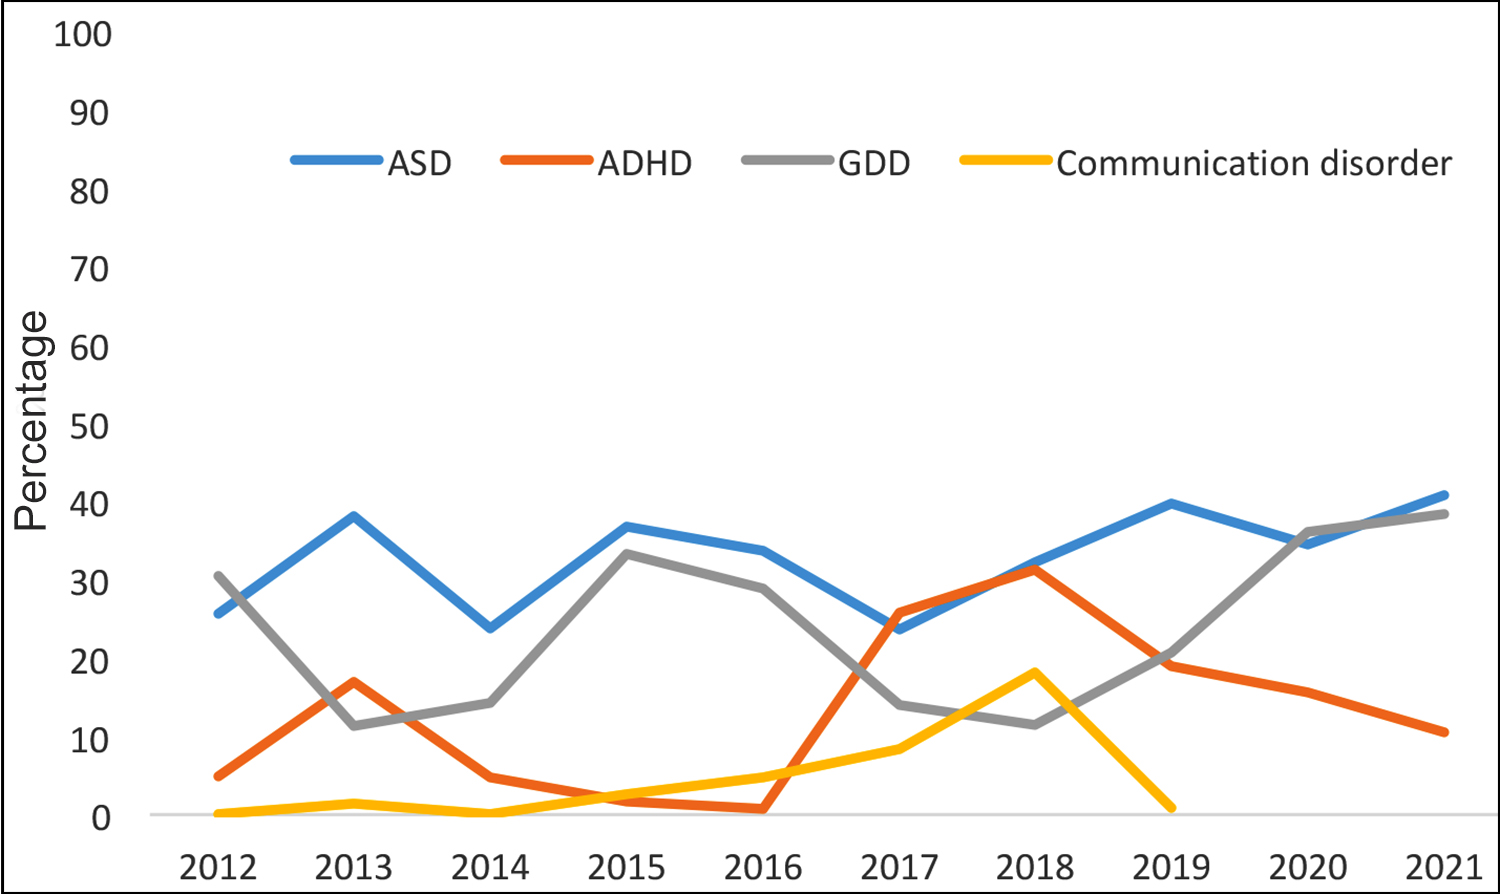 Figure 1: Yearly trend of the developmental disabilities diagnosed at the centre.
A steady increase in yearly referrals has been observed since 2012. It also demonstrates the yearly trend of the reason for referrals such that for all 10 years, speech delay consistently remained the leading reason for referral (n=572, 42.9%), followed by behavioural problems (n=214, 16.1%), and developmental delay (n=176, 13.2%).
In terms of symptomatic referrals (Figure 1), 33.3% (n=446/ 1340) were diagnosed with ASD, 24.5% (n=329/1340) were diagnosed with global developmental delay, and 15.5% (n=207) with ADHD. Dual diagnoses were observed in 11.57% (n=155/1340) children. ASD displayed a rising trend which was higher than all other disabilities.
Pakistan’s data on prevalence of different types of childhood development disorders are sparse. There are a few studies on individual disorders, yet they do not represent the profile of different developmental disabilities. This information is shared to raise awareness of the different developmental disabilities that are commonly referred to the centre and highlight the rise in certain types of disabilities being witnessed in developed countries.
The mean age of referral in this study was 5.4 ± 3.0 years, while children who presented younger than 3 years of age were 20.4%. This was in contrast with the findings from India in 2012, where an earlier mean age of 4.5 years was observed as well as 62.8% of children presented before 3 years of age.4
This study showed that ASD represented the greatest population among the referred cases, with 33.3% of the referred children being diagnosed with ASD. The exact prevalence of ASD in Pakistan is yet to be determined, yet a recent systematic review focused on South Asia, including studies from Bangladesh, Sri Lanka, and India reported the prevalence of ASD in South Asia ranging from 0.09% in India to 1.07% in Sri Lanka. Pakistan was not included due to the absence of studies.5
Global developmental delay and intellectual disability when combined were the most common diagnoses in this study. Bashir et al., found in Pakistan, among a sample of 6,365 children between the ages 6 to 15-year-old, the rates of mild intellectual disability and severe intellectual disability were 6.5% and 1.9%, respectively.6
While it is difficult to estimate the overall prevalence from this study, due to the single centre nature of the study, yet the results are largely in line with trends observed in other regions.4 Like any other study, there are a few limitations to be considered. An important limitation of this study is that it is limited to a single centre. Additionally, due to the broad spectrum of developmental disabilities, the current study was unable to capture the full profile of these disorders in detail.
A considerable burden and an increasing trend of children being referred with the suspicion of developmental disabilities has been observed in this study. This study highlights a need for community-wide estimation of developmental disabilities, especially ASD.
COMPETING INTEREST:
The authors declared no competing interest.
AUTHORS’ CONTRIBUTION:
SKJ: Conception, proposal, data analysis, and manuscript writing.
AA, HR, NG, FS: Data collection, analysis, and manuscript writing.
SHI: Conception, guided the research at all points, review, and final edits.
All the authors have approved the final version of the manuscript to be published,
REFERENCES
- Ismail FY, Shapiro BK. What are neurodevelopmental disorders? Curr Opin Neurol 2019; 32(4):611-6. doi: 10. 1097/WCO.0000000000000710.
- Durkin M. The epidemiology of developmental disabilities in low‐income countries. Ment Retard Dev Disabil Res Rev 2002; 8(3):206-11. doi: 10.1002/mrdd.10039.
- Olusanya BO, Davis AC, Wertlieb D, Boo NY, Nair M, Halpern R, et al. Developmental disabilities among children younger than 5 years in 195 countries and territories, 1990–2016: A systematic analysis for the global burden of disease study 2016. Lancet Glob 2018; 6(10):e1100-e21. doi: 10.1016/S2214-109X(18)30309-7.
- Juneja M, Jain R, Mishra D. Referral profile of a child development clinic in Northern India. Indian J Pediatr 2012; 79(5):602-5. doi: 10.1007/s12098-011-0525-7.
- Hossain MD, Ahmed HU, Jalal Uddin MM, Chowdhury WA, Iqbal MS, Kabir RI, et al. Autism spectrum disorders (ASD) in South Asia: A systematic review. BMC Psychiatry 2017; 17(1):281. doi: 10.1186/s12888-017-1440-x.
- Bashir A, Yaqoob M, Ferngren H, Gustavson KH, Rydelius PA, Ansari T, et al. Prevalence and associated impairments of mild mental retardation in six‐to ten‐year old children in Pakistan: A prospective study. Acta Paediatrica 2002; 91(7):833-7. doi: 10.1111/j.1651-2227.2002.tb03336.x.