Quantitative Evaluation of late Gadolinium Enhancement to the Differential Diagnosis of Prostate Cancer and Prostatitis in mpMRI
By Huseyin Aydin1, Kahraman Topsakal2, Veysel Atilla Ayyildiz1, Hasan Aydin3, Adnan Karaibrahimoglu4Affiliations
doi: 10.29271/jcpsp.2023.01.24ABSTRACT
Objective: To evaluate the late gadolinium enhancement ratio (LGER) quantitatively in late post-contrast images in multiparametric prostate MRI (mpMRI) for the differential diagnosis of chronic prostatitis and prostate cancer (PCa).
Study Design: Descriptive study.
Place and Duration of Study: Department of Radiology, Suleyman Demirel University, Isparta, Turkey, from January 2018 to October 2021.
Methodology: The data of 111 patients with a diagnosis of PCa and chronic prostatitis, were retrospectively analysed who underwent mpMRI of the prostate were retrospectively analysed. Histopathological verification was available in 57 of 57 prostate carcinoma patients and 20 of 54 chronic prostatitis cases. The detection of lesions from the images and the correlation of the detected lesions with their histopathological diagnoses were made by the joint decision of two radiologists. The LGER measurements were made independently by both radiologists. Signal intensity (SI) values of the lesions were obtained by placing a hand-drawn ROI on pre-contrast and late post-contrast images. Late enhancement ratio was calculated from the ratio of the difference between the pre- and post-contrast SI values to the pre-contrast SI values. The LGER values obtained were statistically compared between the pathologically proven PCa and chronic prostatitis patient groups.
Results: The prostatitis LGER values (103.40 ± 31.54%) were significantly higher than the PCa values (79.71±27.39, p<0.001). The LGER values of lesions with a Gleason score <7 were lower than those of lesions scoring ≥7 (p = 0.004). The LGER values of PI-RADS-3 PCa lesions were lower than those of PI-RADS-4 and PI-RADS-5 (p = 0.002). In the late post-contrast phase, low signal measurements in PI-RADS-3 lesions excluded the presence of prostatitis.
Conclusion: Late contrast enhancement quantitative SI measurements performed in the late contrast phase of mpMRI may enable the differential diagnosis of PCa/prostatitis and a more accurate evaluation of PI-RADS scores in terms of malignancy.
Key Words: Prostate cancer, Prostatitis, Gadolinium, Dynamic contrast-enhanced magnetic resonance imaging.
INTRODUCTION
In recent years, multiparametric magnetic resonance imaging (mpMRI) has been increasingly used in prostate cancer (PCa) diagnosis. However, despite high sensitivity, the specificity is reported to be low.1-3 In order to standardise the parameters and reduce inter-observer differences in reporting prostate MRI, the Prostate Imaging Reporting and Data System (PI-RADS) has been proposed by the American College of Radiology and the European Society of Uroradiology.
In this system, the probability of having a clinically significant cancer is evaluated on a scale that scores the lesions from 1 to 5. Basic sequences used in MRI for prostate lesion evaluation include diffusion-weighted imaging (DWI) for the peripheral zone (PZ), T2-weighted imaging (T2W) for the transitional zone, and dynamic contrast-enhanced (DCE) imaging for the whole prostate.4 The contribution of DCE to the diagnosis of prostate cancer (PCa) is limited, and it contributes to diagnosis in the presence of early arterial focal enhancement.1-3,5,6 The late-phase enhancement properties of tissues in DCE are not used in PI-RADS scoring. However, quantitative/semi-quantitative measurements of late gadolinium enhancement may contribute to prostate lesion evaluation.7
On dynamic-contrast MRI, malignant tissues are typically enhanced in the early arterial phase, followed by the early release of the contrast agents. This contrasting pattern reflects extensive neovascularisation in malignant tissues and the deterioration of vascular permeability.8 However, chronic prostatitis, which often accompanies PCa, causes great variability and heterogeneity in the dynamics of enhancement.9 In chronic prostatitis, the delayed increase in contrast material in late contrast imaging is attributed to the fibrosis caused by increased myofibroblastic activity and enlargement of the extracellular space.9 Therefore, the expected typical type-3 enhancement pattern revealing PCa is not observed in every patient.10,11
To be able to evaluate myocardial viability, increased enhancement, which is characterised in the late-phase of fibrosis-dominated tissues, is used in cardiac MRI studies.12 Increased contrast material uptake is observed at the infarct site secondary to fibrosis in the late-phase contrast imaging, which can also be considered for imaging fibrosis due to chronic prostatitis. There are a limited number of studies investigating the contribution of the late contrast phase of mpMRI to the differential diagnosis of PCa and chronic prostatitis. A previous study investigated the late phase Gadolinium (Gd) increase in patients with prostatitis and its contribution to the differential diagnosis of PCa.10 However, to the best of the authors’ knowledge, no study has quantitatively evaluated late-phase Gd enhancement in the prostate. The aim of this study was to evaluate the contribution of the quantitative measurements of signal intensity of lesions in post-contrast late images for the differentiation of PCa and prostatitis.
METHODOLOGY
Approval for this retrospective study was granted by the Local Ethics Committee (Suleyman Demirel University, decision No:16.11.2021/322) and all procedures were in compliance with the Helsinki Declaration. Archived patient data from the institutional database were used.
A retrospective scan was made of the hospital archives, and 144 patients were identified who were diagnosed with prostate cancer and prostatitis and were treated and followed up between January 2018 and October 2021. Patients were excluded from the study if they received anti-androgen therapy (n = 5), had non-prostate cancer or a history of pelvic radiotherapy/chemotherapy (n = 3), insufficient MR imaging due to lack of sequence or artefact (n = 16), or had an area of haemorrhage at a rate that would affect the evaluation on T1W (n = 9). The remaining 111 patients were included in the study. Of these, 57 had a diagnosis of PCa and 54 had a diagnosis of chronic prostatitis. All PCa patients and 20 patients with chronic prostatitis had a histopathological diagnosis. Pathological materials were obtained from transurethral resections in 3 cases, radical prostatectomy in 5, and from cognitive fusion biopsy under transrectal ultrasound guidance in 12 (9 quadrant standard biopsy and 3 quadrant suspicious area biopsy). Of the patients with histopathological diagnosis of prostatitis, 5 had atypical small acinar proliferation (ASAP) and 2 had prostatic intraepithelial neoplasia (PIN) findings. The diagnosis of 34 patients with chronic prostatitis//chronic pelvic pain syndrome was made clinically. The clinical diagnosis of chronic prostatitis was made according to the criteria defined in the literature: 1-presence of symptoms for longer than three months, 2-findings from a digital rectal examination, 3- laboratory findings.13 In the most recent MRI examination, specific antigen (PSA) values were recorded from blood samples.
All mpMRI examinations were performed using a 1.5T MR system (MAGNETOM Avanto, Siemens Medical Solutions, Erlangen, Germany). The bladder was emptied before the examination, but no enema was performed. The imaging protocol included multiplanar turbo spin-echo T2-weighted images, echo-planar DWI (with different b-values: 0/50-400-800-1800 s/mm2) and the ADC map automatically created on a pixel-by-pixel basis using both two and three b-values), three-dimensional (3D) fast field-echo DCE MRI (temporal resolution 7 seconds) and delayed (4th minute) axial turbo spin echo T1-weighted images with fat suppression. For the DCE-MRI, an intravenous bolus of 0.1 mmol/kg contrast material (Gadolinium) at 2 ml/s was administered with an automatic injector, followed by 20 ml saline at the same injection rate. All mpMRI examinations were performed before biopsy or at least four weeks after prostate biopsy in order to minimise post-biopsy hemorrhagic artefacts.
The mpMRI evaluation of all patients was performed by two radiologists with experience of 10 years (first author) and 5 years (third author) with abdominal MRI. The clinical and pathological diagnoses of the patients were known to both observers since the aim of this study was to evaluate the contrast agent uptake in the late post-contrast sequence of lesions with known pathological diagnosis. Therefore, initially, the locations of the lesions which were defined in the pathology reports (12 quadrants/total prostatectomy) and the corresponding areas in MR images were determined. The MR images of the patients who were clinically diagnosed with prostatitis were determined by the joint decision of both referees. The lesions that were to be measured were defined according to PI-RADS v2.1. However, the signal intensity measurements were made by both observers independently of each other. The measurements were taken from the lesions and parenchyma of normal appearance in the same section.14 The region of interest (ROI) selected for measurement was drawn by hand and measured in the range of 30mm2–50mm2, according to the size of the lesion. The ROI was placed by centralising the areas with the lowest ADC value in peripheral zone lesions and the areas with the lowest T2W signal in transitional zone lesions. Then, the determined ROI was placed in the corresponding areas of pre-contrast and late post-contrast fat-suppressed T1W sections using the cut-copy-paste technique. Thus, measurements were taken using the same ROI in the same lesion areas (Figure 1).
The measurements were repeated after two weeks to test intraobserver and interobserver reliability. Contrast enhancement percentages were calculated for the evaluation of adrenal adenomas by adapting lesion and normal parenchyma measurements on pre- and late post-contrast MRI sequences with the “relative wash-out” formula used in dynamic contrast computed tomography examinations:15

This index was obtained from the ratio of the LGER measurement in the parenchyma, which was negative for PCa/prostatitis in the pathology report and normal on T2W/DAG, to the lesion LGER measurement. Thereafter, LGER and LGER-I values were compared between the patient groups.
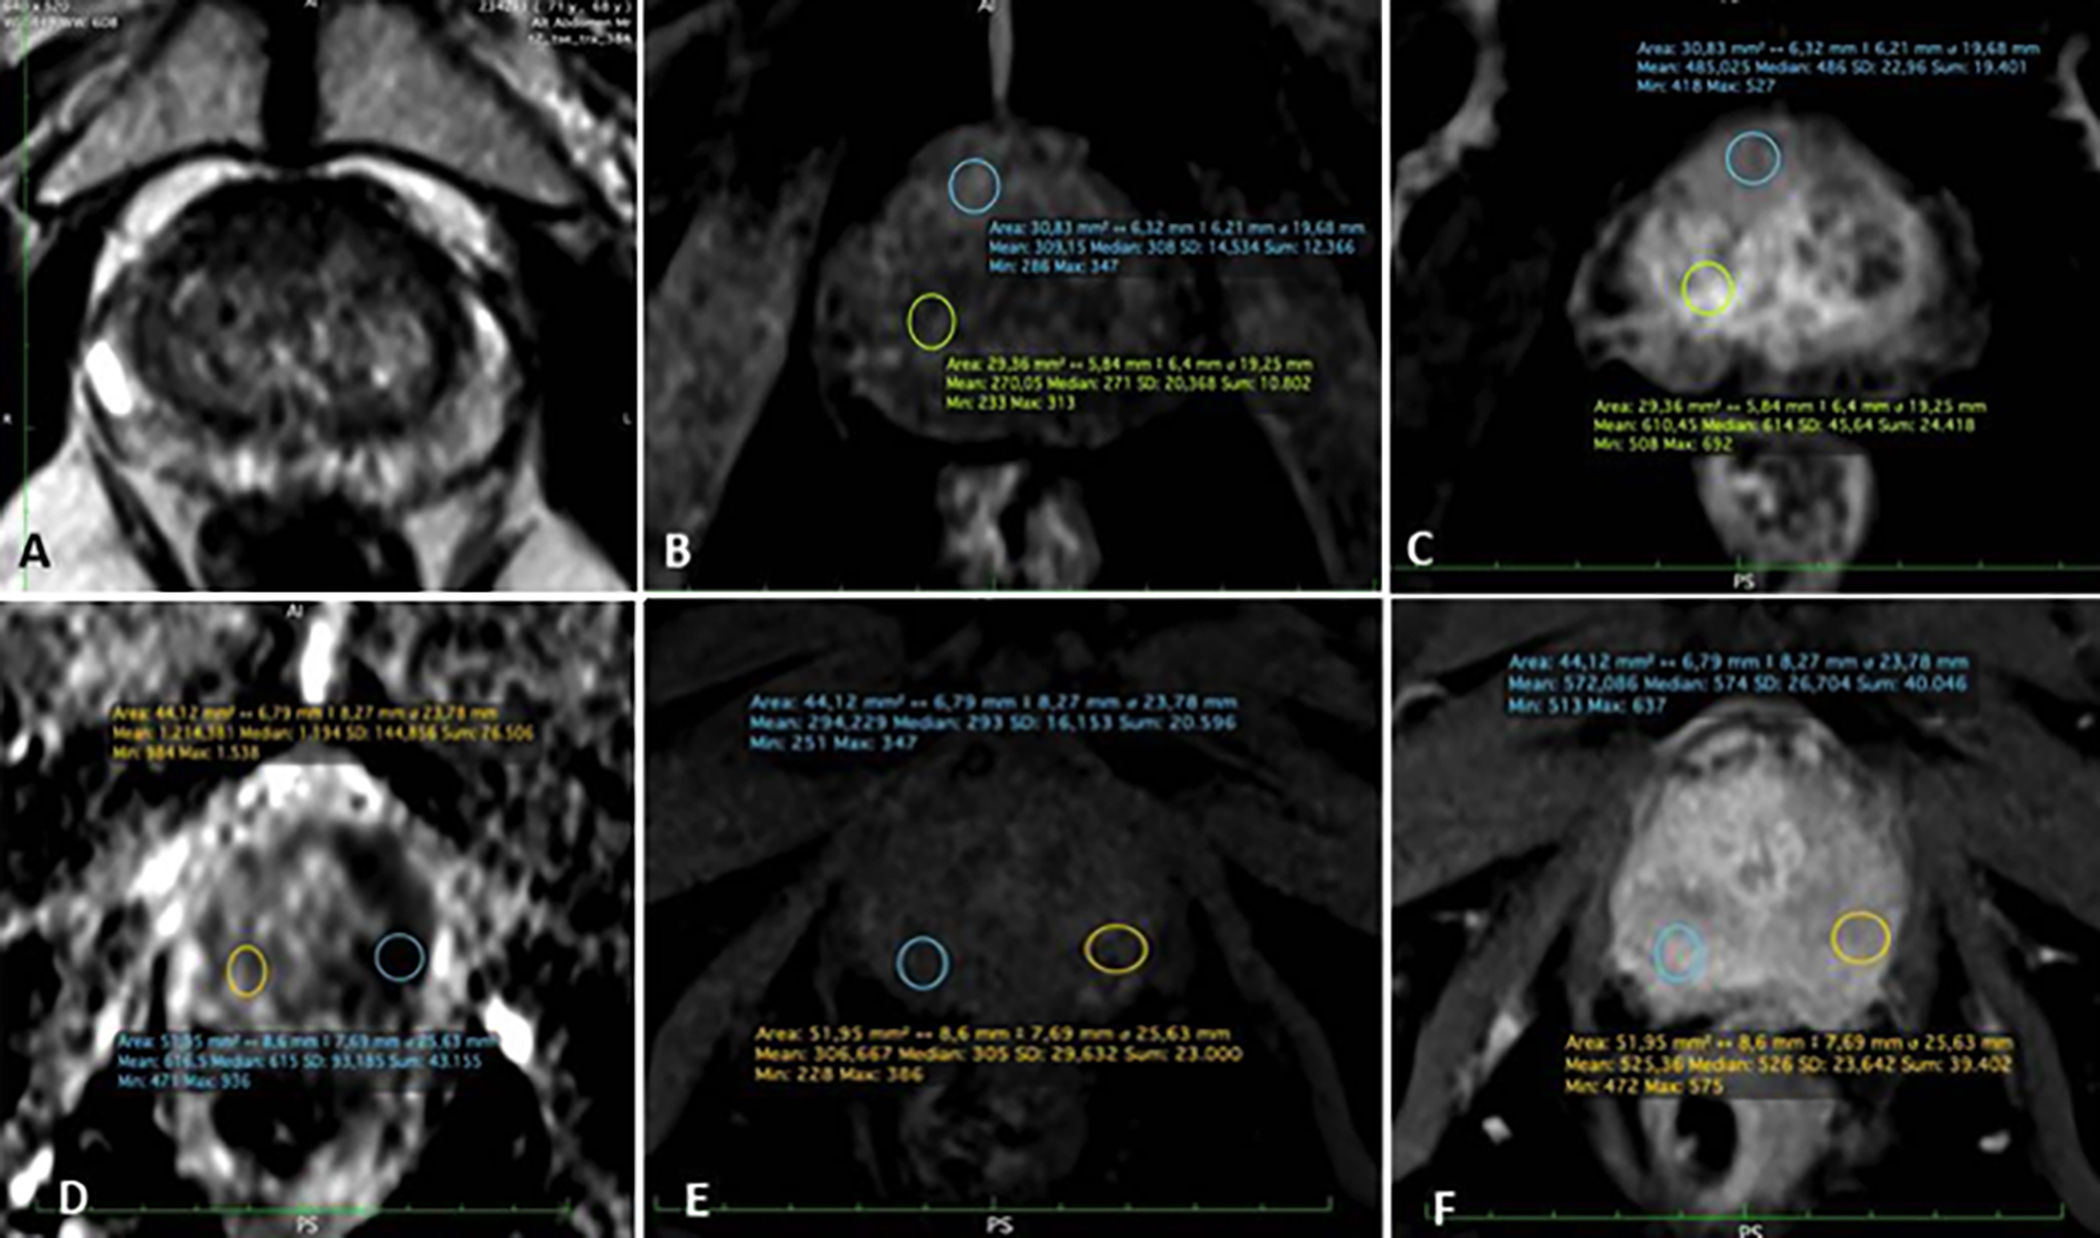 Figure 1: mpMRI axial scans showed measurements from the lesion and normal parenchyma. A, B and C: The measurements of the axial T2W image, pre-contrast T1W and post-contrast T1W axial images of PI-RADS 5 lesions located in the transition zone are shown, respectively. D, E and F: Measurements from ADC mapping, pre-contrast and post-contrast T1W images of peripheral zone located PI-RADS 5 lesions are shown, respectively.
Data obtained in the study were analysed statistically using SPSS vn. 20.0 software (IBM Inc., Chicago, IL, USA). Descriptive statistics were presented as frequency and percentage for categorical variables and as mean ± standard deviation (SD) values for numerical measurements. The conformity of numerical measurements to normal distribution was analysed using the Kolmogorov-Smirnov test. The Student’s t-test was applied in the comparisons of two independent groups, and One-way analysis of variance (ANOVA) was used for comparisons of multiple groups. When parametric conditions were not met, the Kruskal-Wallis test was applied. For posthoc analyses of results that were found to be significant, the Tukey HSD test was applied to parametric data and the K-W q test to non-parametric data. Pearson’s correlation analysis was used to determine the correlation coefficients among measurements. The relationships between categorical variables were determined using the Chi-square test. ROC analysis was performed to determine the diagnostic ratios for LGER, LGER-I and ADC for PCa Intra-observer and inter-observer agreement was determined using intraclass correlation coefficient (ICC) analysis with two-way mixed single measures and average measures methods. A value of p <0.05 for Type-I error rate was considered statistically significant in all the analyses.
Power analysis was performed using GPower 3.1.9.2. software (Universitaet Kiel, Germany). The effect size, calculated using normal and LCR values measured from the lesions in the pilot study, was found to be d = 0.562 for the one-way table value by selecting the t-test and comparison of two independent groups mean difference method. The sample size was calculated as 55 for each of the PCa and prostatitis groups, with a power value of 90% and a margin of error of 5%.
RESULTS
This study included 111 patients, comprising 57 diagnosed with PCa and 54 with prostatitis. The clinical characteristics, prostate-specific antigen density (PSAD), histopathological diagnoses, Gleason and PI-RADS score details, and the LGER, LGER-I, and ADC measurements of the patients are summarised in Table I.
Intra-observer measurements and inter-observer agreement values were found to be quite high. The intra-observer ICC for all measurements ranged from 0.81 to 0.985 for the first observer and from 0.843 to 0.997 for the second observer. The inter-observer ICC ranged from 0.803 to 0.918.
Lesion LGER values were found to be significantly higher in patients with prostatitis (103.40 ± 31.54) than PCa (79.71 ± 27.39, p<0.001, Figure 2). No significant difference was determined between the groups in respect of the normal parenchymal LGER values. There was no significant difference between the LGER values of pathologically proven 20 Prostatitis lesions (93.69 ± 20.96) and the LGER values of 34 clinically diagnosed Prostatitis patients (108.98 ± 35.31, p=0.7).
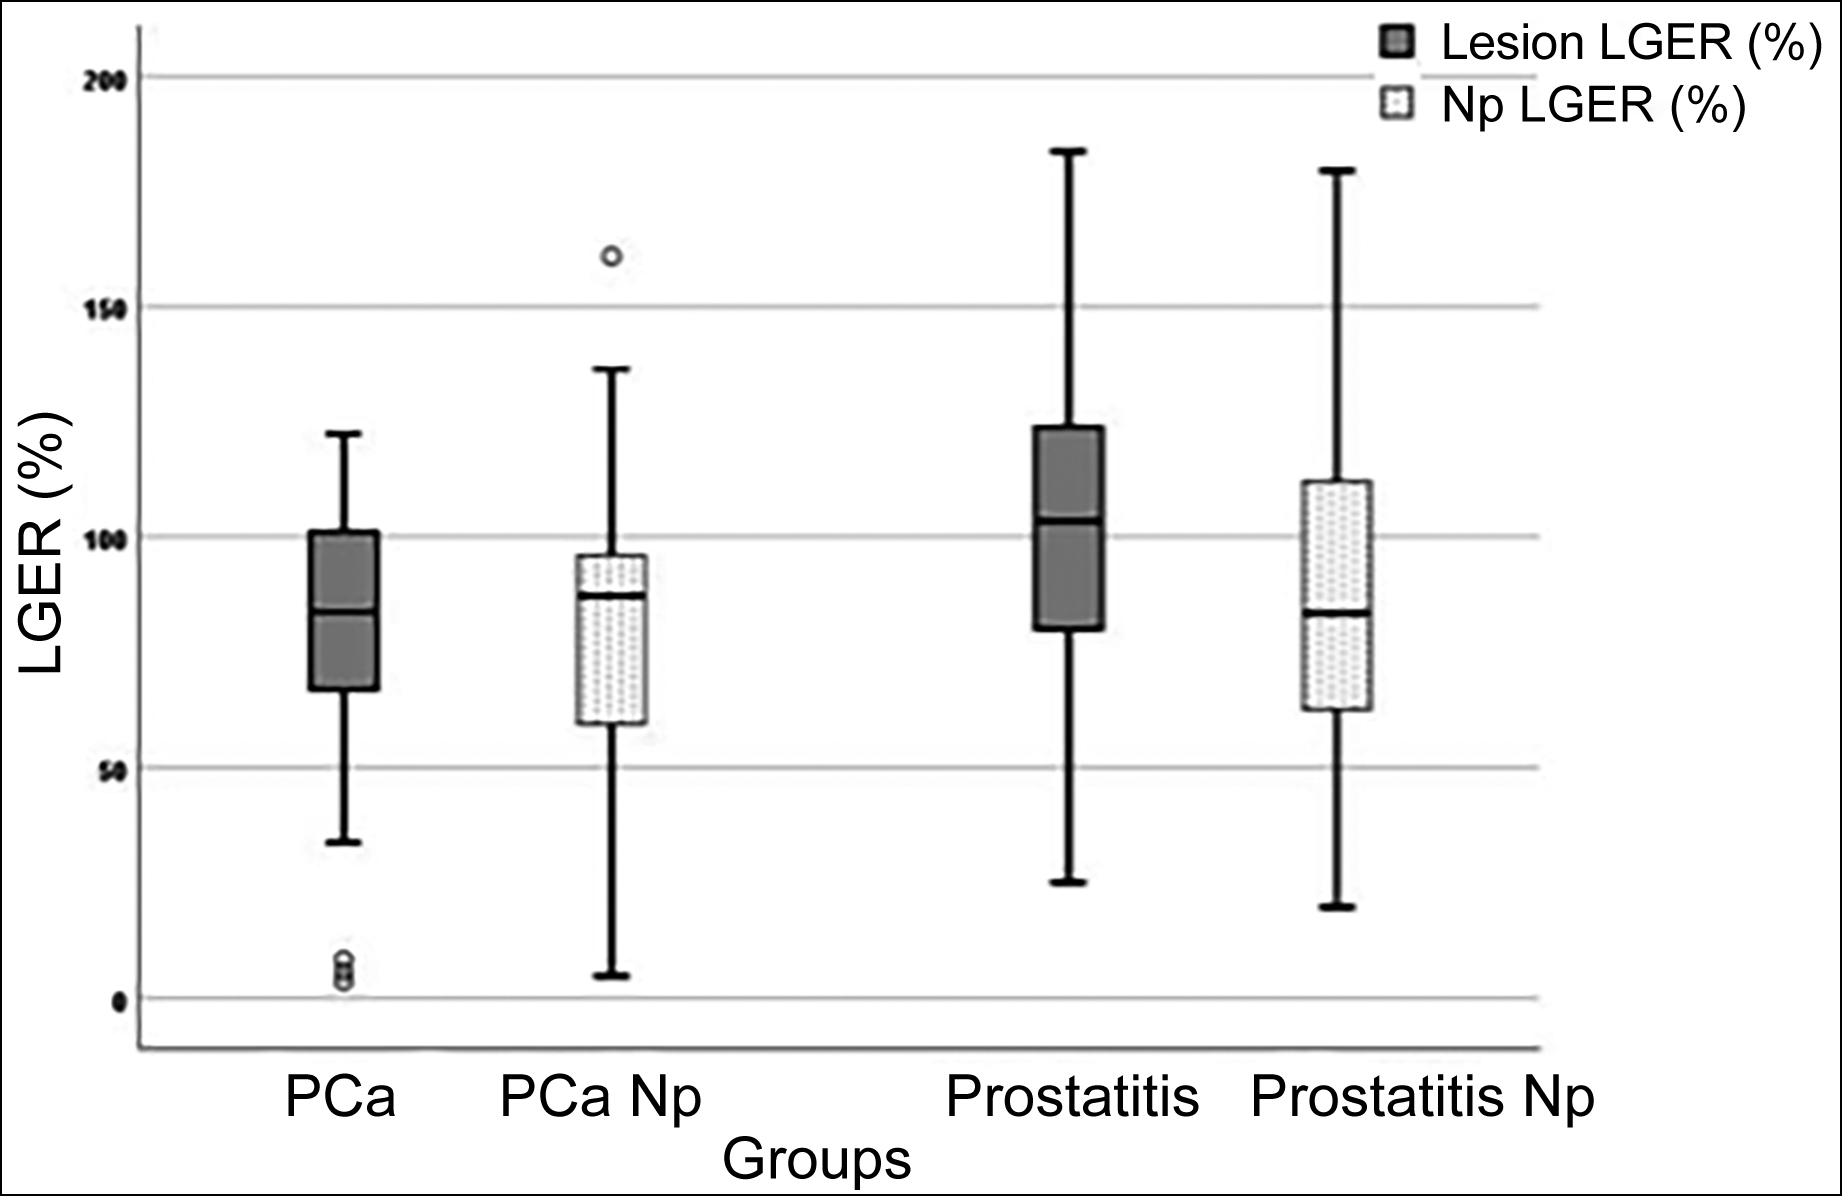 Figure 2: The box plot shows the distribution of LGER according to prostate cancer (PCa), prostatitis, and normal parenchyma of PCa/prostatitis (PCa-Np and Prostatitis-Np).
The LGER and LGER-I cut-off values in patients with prostatitis and PCa are summarised in Table II.
The parenchymal LGER values according to the PI-RADS scores in the patient groups are presented in Table III. No patient was evaluated as PI-RADS-2 in the prostate cancer group. The LGER values in PI-RADS-3 PCa lesions were found to be significantly lower than those in PI-RADS-4 and PI-RADS-5 lesions (p = 0.001). Normal parenchymal LGER values of PI-RADS-3 PCa patients showed a tendency to decrease compared to PI-RADS-4 and PI-RADS5 (p = 0.054). The LGER values of PI-RADS-4 and PI-RADS-5 PCa lesions were close to each other. There was no significant difference between PI-RADS groups in both lesion and normal tissue LGER measurements in prostatitis patients (p > 0.05, Table III).
Table I: Comparisons of various parameters between prostate cancer and chronic prostatitis patients.
|
n |
All patients |
Prostate cancer |
Chronic prostatitis |
p |
|
111 |
57 |
54 |
||
|
Pathological diagnosis |
77/111 |
57/57 |
20/54 |
<0.001** |
|
Age (year)
|
64.77±8.85 (min-max: 33-85) |
67.77±7.49 |
61.92±9.17 |
0.078 |
|
Prostate volume (mm3) |
51.50±25.22 (min-max:8.6-171.8) |
55.60±28.63 |
47.17±20.42 |
0.078 |
|
PSAD |
0.43±0.97 |
0.74±1.32 |
0.15±0.14 |
0.002* |
|
Location (%) PZ TZ |
72.1 27.9 |
71.9 28.1 |
68.5 31.5 |
|
|
ADC (mm2/sn) PZ TZ |
|
0.74±0.17 0.85±0.21 |
1.49±0.34 1.18±0.44 |
<0.001* 0.015* |
|
Gleason Score (n) |
<7 (10) |
≥7 (47) |
|
|
|
Lesion-LGER Np-LGER |
58.14±34.94 59.57±30.72 |
85.39±23.48 85.49±31.05 |
|
0.004* 0.020* |
|
Lesion-LGER (%) |
|
79.71±27.39 |
103.40±31.54 |
<0.001* |
|
Np-LGER (%) |
|
81.10±32.53 |
86.88±33.42 |
0.361 |
|
LGER-I |
|
1.016±0.182 |
1.095±0.170 |
0.020* |
|
LGER in PI-RADS groups (n) (%) |
|
|
|
|
|
2(35) Lesion Np |
|
32.07±32.80 43.70±44.27 |
98.56±29.40 94.05±35.65 |
0.002* 0.033* |
|
3(17) Lesion Np |
|
32.07±32.80 43.70±44.27 |
98.56±29.40 94.05±35.65 |
0.002* 0.033* |
|
4(12) Lesion Np |
|
84.80±12.10 81.68±10.69 |
74.45±21.00 97.55±26.79 |
0.428 0.610 |
|
5(47) Lesion Np |
|
83.38±24.38 84.36±31.51 |
95.95±22.47 96.82±29.02 |
0.326 0.450 |
|
4+5(59) Lesion |
|
83.52±23.36 |
88.78±22.68 |
0.604 |
|
*: Significant at 0.05 level according to the Student’s t-test, **: Significant at 0.05 level according to the Chi-square test. ADC: Apparent diffusion coefficient, LGER: Late contrast enhancement ratio, LGER-I: Late contrast enhancement ratio index, Np: Normal parenchyma, PI-RADS: Prostate imaging reporting and data system, PSAD: Prostate specific antigen density, AUC: Area under the curve, PZ: Peripheral zone, TZ: Transitional zone. |
||||
Table II: ROC characteristics of lesion parameters.
|
|
Prostate cancer |
Chronic prostatitis |
p |
AUC |
Cut-off |
|
LGER (%) |
79.71±27.39 |
103.80±31.40 |
<0.001* |
0.716 (p<0.001) |
108.85 |
|
|
|
|
|
Sensitivity:46% |
Accuracy: 68.5% |
|
|
|
|
|
Specificity: 91% |
|
|
LGER-I |
1.016±0.182 |
1.095±0.170 |
0.020* |
0.651 (p=0.006) |
1.071 |
|
|
|
|
|
Sensitivity:55% Specificity: 71% |
Accuracy: 63% |
|
ADC (mm2/sn) PZ TZ
|
0.74±0.17 0.85±0.21
|
1.49±0.34 1.18±0.44
|
<0.001* 0.015*
|
In PZ lesions: 0.92 (p<0.001) Sensitivity: 89.2% Specificity: 97.4 |
1.052 Accuracy: 93.3% |
|
*: Significant at 0.05 level according to the Student's t-test: Late contrast-enhenced ratio. LGER-I: Late contrast-enhenced ratio index. AUC: Area under the curve. Np: Normal parenchyma. PZ: Peripheral zone. TZ: Transitional zone. |
|||||
Table III. LGER measurements of lesions and normal parenchyma in the patient groups according to PI-RADS scores.
|
|
PI-RADS-3 (n=4) |
PI-RADS-4 (n=8) |
PI-RADS-5 (n=45) |
p |
|
Prostate cancer |
|
|
||
|
Lesion LGER(%) |
32.07±32.80a.b |
84.80±12.10a |
83.38±24.38b |
0.001* |
|
Np-LGER(%) |
43.70±44.27 |
81.68±10.69 |
84.36±31.51 |
0.054 |
|
Chronic prostatitis |
|
PI-RADS 3 (n=13) |
PI-RADS 4+5 (n=4+2) |
|
|
Lesion LGER(%) |
|
98.56±29.40 |
88.78±22.68 |
0.521 |
|
Np LGER(%) |
|
94.05±35.65 |
97.06±25.48 |
>0.99 |
|
|
|
PI-RADS 3 (n=13) Median (Q1-Q3) |
PI-RADS 2 (n=35) Median (Q1-Q3) |
|
|
Lesion LGER(%) |
|
103.3 (72.9-123.5) |
112.6 (84.9-126.1) |
0.348 |
|
Np-LGER(%) |
|
101.3 (59.0-123.7) |
82.4 (62.4-112.1) |
0.472 |
|
*: Significant at the 0.05 level according to the Kruskal-Wallis test. a.b: The same exponential letters indicate significant posthoc results at the 0.05 level. LGER: Late contrast-enhanced ratio. AUC: Area under the curve. Np: Normal parenchyma. |
||||
The LGER values of PI-RADS-3 lesions were found to be significantly lower in PCa than in chronic prostatitis in both lesions and normal parenchyma (p = 0.002 and p = 0.033, respectively). The LGER values of PI-RADS-4 and 5 lesions did not differ significantly between PCa and prostatitis lesions (Table I).
The prostate cancer patients were divided into two groups according to the Gleason scores. The first group included patients with a Gleason score <7 (n = 12) and the second group included those with a Gleason score ≥7 (n = 45) (clinically significant cancers). The contrast enhancement values between these two groups were compared. The measurements of the first group were found to be lower in both the lesion and normal parenchyma compared to those of the second group (p=0.004, p =0.02, respectively) (Table I).
A positive and significant correlation was found between ADC and LGER in peripheral zone PCa lesions (r: 0.388, p=0.016).
DISCUSSION
This study focused on evaluating the enhancement rates of PCa and prostatitis lesions in delayed contrast imaging. Therefore, the contribution of late enhancement rates of lesions with a known diagnosis to the differential diagnosis of the lesion was investigated. It is known that the contrast agent dose and infusion rate used in the examination and patient-related differences such as weight and renal functions, may impair signal measurement standardisation among patients.16 In order to minimise the measurement errors that may arise from these differences, the index LGER (LGER-I) was obtained.14,16
The results of this study demonstrated that the gadolinium enhancement values of chronic prostatitis lesions in the mpMRI late contrast phase were found to be significantly higher than those in PCa, and quantitative measurements of LGE were also seen to contribute to the identification of PCa stages. When the cut-off value is taken as 108.85% in the late contrast phase, prostatitis can be distinguished from PCa with 46% sensitivity and 91% specificity. When the LGER-I cut-off value is taken as 1.071, PCA/prostatitis discrimination can be made with 55% sensitivity and 71% specificity. Another finding in this study was that quantitative measurements of LGE also contribute to the identification of PCa stages. These findings demonstrate the potential contribution of quantitative LGE measurements to the differential diagnosis of PCa and chronic prostatitis. It may not always be possible to make a differential diagnosis between prostate cancer and chronic prostatitis lesions via mpMRI. In both entities, there is a low T2W signal, decreased ADC values, and early arterial enhancement (particularly in PZ prostatitis) due to increased vascular permeability can be seen. Moreover, chronic prostatitis often accompanies PCa.8 This results in heterogeneity in the enhancement pattern in PCa patients.8,9
On mpMRI, early enhancement is related to the vascular density and permeability of tissues due to the high vascularity of cancer, while enhancement in the late phases is related to the size of extracellular spaces due to fibrosis.9 To assess myocardial viability, cardiac MRI studies use increased contrast, which is characterised in the late phase of fibrosis-predominant tissues.12 Similarly, in chronic prostatitis, there is an increase in contrast agent uptake in late contrast imaging due to fibrosis causing increased myofibroblastic activity and enlargement of the extracellular space.9 A recent prostate mpMRI study stated that two-thirds of the lesions that showed a qualitative increase in LGE were chronic prostatitis, whereas the remaining third of LGE positive lesions were pathologically diagnosed as significant PCa (Gleason score ≥7). In particular, late contrast-enhancement (LCE)+ was detected in 27 of 54 lesions defined as PI-RADS-3 and 85% of these were found to be histopathologically diagnosed as prostatitis/Gleason <7 tumours. However, in one-third of LCE+ patients, histopathologically clinically significant cancer (Gleason≥7) is detected and this might be attributed to the interstitial stromal reaction, which is similar to wound healing mechanisms in PCa and remodelling of the extracellular matrix.10 In line with this, 4 of the 17 PI-RADS-3 lesions in the current study were PCa and had very low LGER (32.07±32.8) values. The LGER values of the other 14 PI-RADS-3 lesions (98.56±29.4) were significantly higher and were diagnosed as prostatitis (p=0.017). These results indicate that the quantitative measurements of LGE may help to ascertain whether PI-RADS-3 lesions are malignant. However, this interpretation may not be entirely correct since more than half of the prostatitis patients do not have a pathological diagnosis.
Another finding in this study was that quantitative measurements of LGE also contribute to the identification of PCa stages. In PCa patients, the LGER values of PI-RADS-3 lesions were significantly lower than those of PI-RADS-4 and PI-RADS-5 lesions. In other words, as the PI-RADS score increased in PCa, the LGER values increased and approached the LGER values in prostatitis. Moreover, patients with a Gleason score ≥7 (clinically significant cancer) (n = 45) had higher LGER values than those with a Gleason score <7 (n = 10). As mentioned above, these findings may be associated with interstitial stromal reactions because PCa usually shows slow biological behaviour, and high PI-RADS scores indicate a long disease period, which results in increased fibrosis due to interstitial stromal repair responses and expansion of extracellular spaces. In addition, in most PCa patients, the presence of concomitant chronic prostatitis and fibrotic processes associated with the benign disease can contribute to contrast agent retention in the late phase. This finding supports the idea that low LGE values may contribute to the detection of especially early-stage Pca lesions, as suggested by Cristel et al. In the study by Cristel et al., clinically significant cancer lesions with LCE+ overlapping chronic prostatitis probably correspond to the PI-RADS-4 and PI-RADS-5 groups in the current study.10 This is because the mean LGER values of PI-RADS-4 and PI-RADS-5 PCa lesions in the current study were found to be quite close to the PI-RADS-4 and PI-RADS-5 prostatitis LGER values. According to these findings, it can be said that LGER in PI-RADS-4 and PI-RADS-5 lesions do not make a significant contribution to the differentiation of prostatitis/PCa. However, PI-RADS-3 lesions with high LGER values excluded the presence of PCa.
A positive correlation between ADC and LGER was only determined in PCa lesions located in PZ (r = 0.388, p = 0.016). Accordingly, it can be said that the detection of low LGER values together with low ADC in PZ lesions increases the probability of the lesion being PCa.
This study has a few limitations. Due to the retrospective nature of the study, there may have been some bias in lesion selection. However, this bias can be ignored for this study, because the aim of this study was to analyse the Gd uptake rates in late contrast MR images of lesions with known pathological diagnosis. Another limitation is that biopsy is not routinely performed in all chronic prostatitis patients and the diagnosis is mostly made according to clinical and laboratory data, and response to treatment. Prostate biopsy is performed if there is no symptomatic response to treatment, no decrease in PSA values, or an increase in PSA values.13 Biopsy was not performed in patients who were clinically diagnosed with chronic prostatitis, since it is an invasive procedure and would not have been ethically appropriate. However, there was no statistically significant difference between LGER values in the prostatitis groups with and without biopsy confirmation (p>0.7); and LGER values were higher in patients with a clinical diagnosis of chronic prostatitis (in pathologically proven prostatitis lesions: 93.69±20.96%; in clinically diagnosed prostatitis lesions: 108.98±35.31%), so this limitation may be partially ignored. Since the lesions were selected by the joint decision of both observers, the inter-and intra-observer reliability of the measurements could not be evaluated as optimal. The low number of patients in the groups (especially in PI-RADS 3) in this study was another handicap to obtain reliable statistical analyses, so no definitive comments can be made regarding the accuracy of all these evaluations. In order to ensure accuracy, there is a need for further studies on this subject with PI-RADS groups that include a large number of patients.
CONCLUSION
The results of this study demonstrated that the LGER values of prostatitis lesions were significantly higher than those of PCa. In addition, the low LGER values measured in PI-RADS-3 lesions, the interpretation of which is the most problematic score, is a finding that indicates the presence of PCa. In conclusion, LGE quantitative signal intensity measurements performed in the late contrast phase of mpMRI examination may enable the differential diagnosis of PCa/prostatitis and a more accurate evaluation of PI-RADS scores in terms of malignancy. In addition, the LGER measurements can also be an important data source for artificial intelligence studies.
ETHICAL APPROVAL:
This study was performed in line with the principles of the Declaration of Helsinki. Approval was granted by the Ethics Committee of Suleyman Demirel University (Date and Decision No. 16 November 2021/322).
PATIENTS’ CONSENT:
In keeping with the policies for a retrospective review, the informed consent requirement was waived.
COMPETING INTERESTS:
The authors declared no competing interest.
AUTHORS’ CONTRIBUTION:
HA: Conception and design of study, acquisition, analysis, and interpretation of data, and drafting of the manuscript.
KT: Substantial contributions to the conception and design of the work and data analysis.
VAA: Contribution in acquisition and interpretation of the data.
HA: Contribution in drafting and revising the content. Critical revision of the manuscript and supervision.
AK: Statistical analysis, contribution in drafting, and revising the content.
All authors contributed to the study conception and design. All authors read and approved the final manuscript.
REFERENCES
- de Rooij M, Hamoen EHJ, Fütterer JJ, Barentsz JO, Rovers MM. Accuracy of multiparametric MRI for prostate cancer detection: a meta-analysis. Am J Roentgenol 2014; 202(2):3451.doi.org/10.2214/AJR.13.11046.
- Moldovan PC, Van den Broeck T, Sylvester R, Marconi L, Bellmunt J, van den Bergh RCN, et al. What is the negative predictive value of multiparametric magnetic resonance imaging in excluding prostate cancer at biopsy? A systematic review and meta-analysis from the european association of urology prostate cancer guidelines panel. Eur Urol 2017; 72(2):250-66. doi.org/10.1016/j.eururo. 2017.02.026.
- Ahmed HU, Bosaily AES, Brown LC, Gabe R, Kaplan R, Parmar MK, et al. Diagnostic accuracy of multi-parametric MRI and TRUS biopsy in prostate cancer (PROMIS): A paired validating confirmatory study. Lancet 2017; 389(10071): 815- 22. doi.org/10.1016/S0140-6736(16)32401-1.
- Johnson LM, Turkbey B, Figg WD, Choyke PL. Multiparametric MRI in prostate cancer management. Nat Rev Clin Oncol 2014; 11(6):346-53. doi.org/10.1038/nrclinonc. 2014.69.
- Padhani AR, Weinreb J, Rosenkrantz AB, Villeirs G, Turkbey B, Barentsz J. Prostate imaging-reporting and data system steering committee: PI-RADS v2 status update and future directions. Eur Urol 2019; 75(3):385-96. doi.org/10.1016/j. eururo.2018.05.035.
- Turkbey B, Rosenkrantz AB, Haider MA, Padhani AR, Villeirs G, Macura KJ, et al. Prostate imaging reporting and data system version 2.1: 2019 update of prostate imaging reporting and data system version 2. Eur Urol 2019; 76(3):340–51. doi.org/10.1016/j.eururo.2019.02.033.
- Czarniecki M. Commentary on: mpMRI of the prostate: Is there a role for semi-quantitative analysis of DCE-MRI and late gadolinium enhancement in the characterisation of prostate cancer? Clin Radiol 2019; 74(4):257–8. doi.org/10. 1016/j.crad.2019.01.002.
- Verma S, Turkbey B, Muradyan N, Rajesh A, Cornud F, Haider MA, et al. Overview of dynamic contrast-enhanced MRI in prostate cancer diagnosis and management. Am J Roentgenol. 2012; 198(6):1277-88. doi.org/10. 2214/AJR. 12.8510.
- Rodriguez-Nieves JA, Macoska JA. Prostatic fibrosis, lower urinary tract symptoms, and BPH. Nat Rev Urol 2013; 10(9):546-50. doi.org/10.1038/nrurol.2013.149.
- Cristel G, Esposito A, Briganti A, Damascelli A, Brembilla G, Freschi M, et al. MpMRI of the prostate: Is there a role for semi-quantitative analysis of DCE-MRI and late gadolinium enhancement in the characterisation of prostate cancer? Clin Radiol 2019; 74(4):259-67. doi.org/10.1016/j.crad. 2018.08.017.
- Kim RJ, Fieno DS, Parrish TB, Harris K, Chen EL, Simonetti O, et al. Relationship of MRI delayed contrast enhancement to irreversible injury, infarct age, and contractile function. Circulation 1999; 100(19):1992–2002. doi.org/10. 1161/01.CIR.100.19.1992.
- Kramer CM, Barkhausen J, Bucciarelli-Ducci C, Flamm SD, Kim RJ, Nagel E. Standardised cardiovascular magnetic resonance imaging (CMR) protocols: 2020 update. J Cardiovasc Magn Reson 2020; 22(1):1-18. doi.org/10.1186/s12968- 020-00607-1.
- Holt JD, Garrett WA, McCurry TK, Teichman JMH. Common questions about chronic prostatitis. Am Fam Physician 2016; 93(4):290-6.
- Uysal A, Karaosmanoğlu AD, Karcaaltıncaba M, Akata D, Akdogan B, Baydar DE, et al. Prostatitis, the great mimicker of prostate cancer: Can we differentiate them quanti-tatively with multiparametric MRI? Am J Roentgenol 2020; 215(5):1104-12. doi.org/10.2214/AJR.20.22843.
- Schieda N, Siegelman ES. Update on CT and MRI of adrenal nodules. Am J Roentgenol 2017; 208(6):1206-17. doi.org/10.2214/AJR.16.17758.
- Sureka B, Elhence P, Khera PS, Choudhary GR, Pandey H, Garg PK, et al. Quantitative contrast-enhanced perfusion kinetics in multiparametric MRI in differentiating prostate cancer from chronic prostatitis: results from a pilot study. Br J Radiol 2019; 92(1100):20190181. doi.org/10.1259/bjr. 20190181.