Predicting the Severity of Coronary Artery Disease: Can the Leukocyte Glucose Index be Used?
By Oguz Kilic1, Ipek Buber2, Fatih Kahraman3Affiliations
doi: 10.29271/jcpsp.2022.12.1519ABSTRACT
Objective: To investigate the usability of leuko-glycemic index (LGI) at chronic coronary syndromes (CCS) class 1 for determining the extent and severity of coronary artery disease (CAD).
Study Design: An observational study.
Place and Duration of Study: Department of Cardiology, University of Pamukkale University Hospital, Turkey, between September 2021 and January 2022.
Methodology: One hundred and thirty-four patients, whose myocardial perfusion scintigraphy (MPS) was requested due to CCS class 1, and on whom a coronary angiogram (CAG) was performed due to evidence of ischemia, were analysed. Blood samples were taken from the patients during their hospitalisation before CAG. LGI was calculated as mg/dl.mm3 by multiplying both values and dividing by a thousand. The patients were analysed in two groups according to the critical stenosis and non-critical stenosis detected in the coronary arteries.
Results: The LGI was recorded as 480 mg/dl.mm3 (407-603) vs. 572 mg/dl.mm3 (433-877), p=0.006, and the Gensini score (6 (3-10) vs 40 (23-60), p<0.001) was significantly higher in the critical CAD group. A significant relationship has detected the increase in LGI and the extensity and severity of CAD (Unadjusted; OR (95% CI); 1.003 (1.001 – 1.004) p=0.002, adjusted; OR (95% CI); 1.002 (1.001 – 1.004) p=0.004).
Conclusion: A high LGI was a predictor of CAD severity among CCS class 1 patients and was found to correlate with the Gensini score. The use of this simple and inexpensive index, together with other non-invasive tests before CAG, may provide some knowledge about the severity of CAD.
Key Words: Coronary artery disease, Leukocyte glucose index, Myocardial perfusion scintigraphy.
INTRODUCTION
Myocardial ischemia has many causes. The most common cause is stable coronary artery disease (SCAD). In 2019, the European Society of Cardiology guidelines for chronic coronary syndrome (CCS) was published. In this guide, CCS 1 is used instead of the term SCAD.1 According to this guideline, patients are divided into 5 groups. Patients with symptoms without known CAD are included in group 1. In this group of patients, an initial non-invasive diagnostic test is recommended at the clinical likelihood of CAD. While scores are defining the severity of CAD in acute coronary syndromes, they seem insufficient for CCS class 1.
Hyperglycemia can cause thrombosis and fibrinolysis, which lead to the formation of atherosclerotic plaques.2 Leukocytes are very important in inflammatory diseases. Increased leukocyte levels are significantly associated with atherosclerosis and cardiovascular disease. Therefore, leukocyte levels have been used as an important indicator for assessing cardiovascular disease risk.3-5 The leuko-glycemic index (LGI) is an easily calculated and non-invasive index that combines leukocyte count and blood glucose score. Previous studies have shown LGI to be a good clinical predictor of acute myocardial infarction and stroke.6-8 This study aimed to investigate the usability of LGI at CCS class 1 for determining the extent and severity of CAD.
METHODOLOGY
This study is a retrospective single-centre observational study, approved by the institutional review board and conducted according to the Declaration of Helsinki (Approval Number: 25.01.2022/02).
One hundred and thirty-four patients, whose myocardial perfusion scintigraphy (MPS) was requested due to CCS class 1, and on whom a coronary angiogram (CAG) was performed due to evidence of ischemia, were analysed. All the patients between September 2021 and January 2022 without exclusion criteria were analysed. Chronic inflammatory disease, previously diagnosed with CAD, thyroid disorders, hemolytic disease, malignancy, chronic lung diseases, liver diseases, rheumatic disease, chronic kidney failure and history of hemodialysis, non-regulated diabetes mellitus, and normal coronary arteries at CAG were excluded. Demographic data were obtained from the hospital registration system. The patients was evaluated with the Affiniti 50 echocardiography device before CAG. The left ventricular ejection fraction (LVEF) was calculated using the modified Simpson method. A resting blood pressure ≥140-90 mmHg in ≥2 measurements or taking antihypertensive medication was considered hypertensive (HT).9 Patients with fasting blood glucose ≥126 mg/dl or postprandial blood glucose ≥200 mg/dl or glycated haemoglobin (HbA1c) ≥6.5 or taking anti-diabetic drugs were considered as diabetes mellitus (DM).10 A low density lipoprotein cholesterol (LDL-C) level below the European Society of Cardiology Guideline threshold or patients who received an anti-lipidemic were considered to have dyslipidemia.11
Laboratory values of each patient were checked before CAG. Blood glucose was expressed as mg/dl and white blood cell count as the number of cells per mm3. LGI was calculated as mg/dl.mm3 by multiplying both values and dividing by a thousand.12
Coronary angiography was performed via the femoral or radial artery, depending on the operator's experience. A routine Judkins catheter was used in the diagnostic CAG. The left main coronary artery (LMCA), left anterior descending (LAD), and left circumflex artery (LCX) were evaluated from the left caudal, right caudal, left cranial, right cranial, and antero-posterior cranio-caudal poses. The right coronary artery (RCA) was evaluated in the left anterior oblique and left cranial poses. According to the results of the CAG, stenosis of ≥50% for the LMCA and ≥70% for other epicardial vessels was considered to be obstructive-severe CAD. The patients were analysed in two groups according to the critical stenosis (81 patients) and non-critical stenosis (53 patients) detected in the coronary arteries. Patients without obstructive CAD were labelled group 1; patients with ≥70% stenosis in ≥1 epicardial vessel or ≥50% stenosis in LMCA were labelled group 2. The extent and severity of atherosclerosis in coronary arteries were calculated with the Gensini score. According to the degree of angiographic stenosis, 1 point for 1-25% stenosis, 2 points for 26-50% stenosis, 4 points for 51-75% stenosis, 8 points for 76-90% stenosis, 16 points for 91-99% stenosis, and 32 points were awarded for 100 total lesions. The calculated scores were multiplied by the coefficient defined for each segment of the coronary arteries. The Gensini score was calculated by summing the results. Segment and coefficients: 5 for the LMCA, 2.5 for the LAD artery proximal, 1 for the mid1.5, apical 1, diagonal 1 and 0.5 for the diagonal; 2: 2.5 for the LCx artery, 1 for the distal, 1 for the obtuse margin, and 1 for the posterior descending artery (PDA); if left dominant, 0.5 for the posterolateral artery (PL): 1 for the RCA proximal, 1 for the mid1, distal 1 and PDA. A Gensini score between 1-20 was accepted as mild coronary atherosclerosis, and a score of >20 was considered to be severe coronary atherosclerosis.13
All the data were analysed using SPSS version 22.0 (SPSS, Inc., Chicago, Illinois). Continuous variables were expressed as mean ± standard deviation. Before the non-parametric test, the authors examined the normality of the variables with the Shapiro-Wilks test. For abnormally distributed continuous variables, the non-parametric Mann–Whitney U test was used. Categorical variables were expressed as percentages and numbers. The Chi-square test was used for categorical variables. Logistic regression analysis was used to find the association between LGI and CAD severity. The odds ratio (OR) and confidence interval (CI) were calculated with the noncritical CAD serving as a reference. The first, the unadjusted model, included only LGI for the prediction of CAD severity. In the adjusted model, the authors included age, HT, and DM for multivariate logistic regression analysis. The ROC curve was used to determine the cut-off for the P wave duration change. A p-value of <0.05 was considered statistically significant.
Table I: Baseline clinical, demographic and laboratory characteristics of the study.
|
|
Noncritical stenosis (n=53) |
Critical stenosis (n=81) |
p-value |
|
Age, years |
57 (50-61) |
60 (53-68) |
0.019 |
|
Gender, male (%) |
24 (45.28) |
48 (59.25) |
0.140 |
|
HT, n (%) |
25 (47.2) |
55 (67.9) |
0.020 |
|
DM, n (%) |
19 (35.8) |
51 (63) |
0.003 |
|
HL |
1 (1.9) |
8 (9.9) |
0.087 |
|
LVEF |
60 (55-60) |
60 (55-60) |
0.153 |
|
Platelet |
246,6±50,2 |
230,5±65.7 |
0.069 |
|
Hemoglobin |
14.3 (12.6-15.7) |
14.2 (13-15) |
0.537 |
|
Urea |
29 (24-33) |
31 (24-42) |
0.076 |
|
Creatinine |
0,96±0.2 |
1,0±0.2 |
0.210 |
|
GFR, ml/min |
81,2±10.9 |
77,0±18.8 |
0.117 |
|
Sodium |
140 (138-141) |
139 (137-140) |
0.124 |
|
Potassium |
4.1 (3.9-4.4) |
4.3 (4-4.5) |
0.067 |
|
CRP |
4.5 (3.6-8.9) |
5.6 (4.2-7.7) |
0.263 |
|
ALT |
19 (13-26.5) |
20 (14-27.5) |
0.600 |
|
AST |
18 (16-26) |
23 (18-31) |
0.072 |
|
Total cholesterol |
188,7±39.4 |
180,7±46.1 |
0.372 |
|
Triglyceride |
139 (118-188) |
138 (96-191) |
0.667 |
|
LDL |
114 (96-137) |
112 (79-141) |
0.285 |
|
HDL |
44.3±1.2 |
42.4±1.3 |
0.345 |
|
LGI |
480 (407-603) |
572 (433-877) |
0.006 |
|
Gensini score |
6 (3-10) |
40 (23-60) |
<0.001 |
|
HT: Hypertension, DM: Diabetes Mellitus, HL: Hyperlipidemia, LVEF: Left ventricular ejection fraction, GFR: Glomerular Filtration Rate, CRP: C-reactive Protein, ALT: Alanine aminotransferase AST: Aspartate Aminotransferase, LDL: Low density lipoprotein cholesterol, HDL: High-density lipoprotein cholesterol LGI: Leukocyte Glucose Index, Risk factors adjusted by age, HT and DM. CAD: Coronary artery disease, CI: Confidence interval, DM: Diabetes mellitus, HT: Hypertension. |
|||
RESULTS
One hundred and thirty-four patients were analysed. Seventy-two patients were male (53.2%) and 62 patients were female (46.8%). The age ranges were recorded as 57 (50-61) vs. 60 (53-68), p=0.019 (Table I). The present rate of HT was recorded as n=25 (47.17%) vs. n=55 (67.90%), p=0.020 and the DM as n=19 (35.8%) vs n=51 (63%), p=0.003 (Table I). The LGI was recorded as 480 mg/dl.mm3 (407-603) vs 572 mg/dl.mm3 (433-877), p=0.006, and the Gensini score (6 (3-10) vs 40 (23-60), p<0.001) was significantly higher in the critical CAD group (Table I). The relationship between the LGI and the severity of CAD was evaluated using logistic regression analysis. A significant relationship has detected the increase in LGI and the extensity and severity of CAD. Unadjusted logistic regression analysis showed that the increase in LGI was associated with the extent and severity of CAD (OR (95% CI); 1.003 (1.001 – 1.004) p=0.002, Table II). After adjusting the model for confounding factors (age, HT, and DM), multivariate logistic regression analysis showed that the increase in LGI was still associated with the extent and severity of CAD (OR (95% CI); 1.002 (1.001 – 1.004) p =0.004, Table II). The ROC curve of the LGI to estimate the severity of CAD is shown in Figure 1. The LGI AUC value was 0.641 (95% CI: 0.548-0.733, p=0.006, Figure 1). The cut-off value for LGI was 543.81, with a sensitivity of 54.3% and a specificity of 71.7%.
Table II: Logistic regression analysis regarding correlations between severity of CAD and leuko-glycemic index.
|
Variables |
Odds ratio (95% CI) |
p-value |
|
Leuko-glycemic index |
||
|
Unadjusted |
1.003 (1.001 – 1.004) |
0.002 |
|
Adjusted |
1.002 (1.001 – 1.004) |
0.004 |
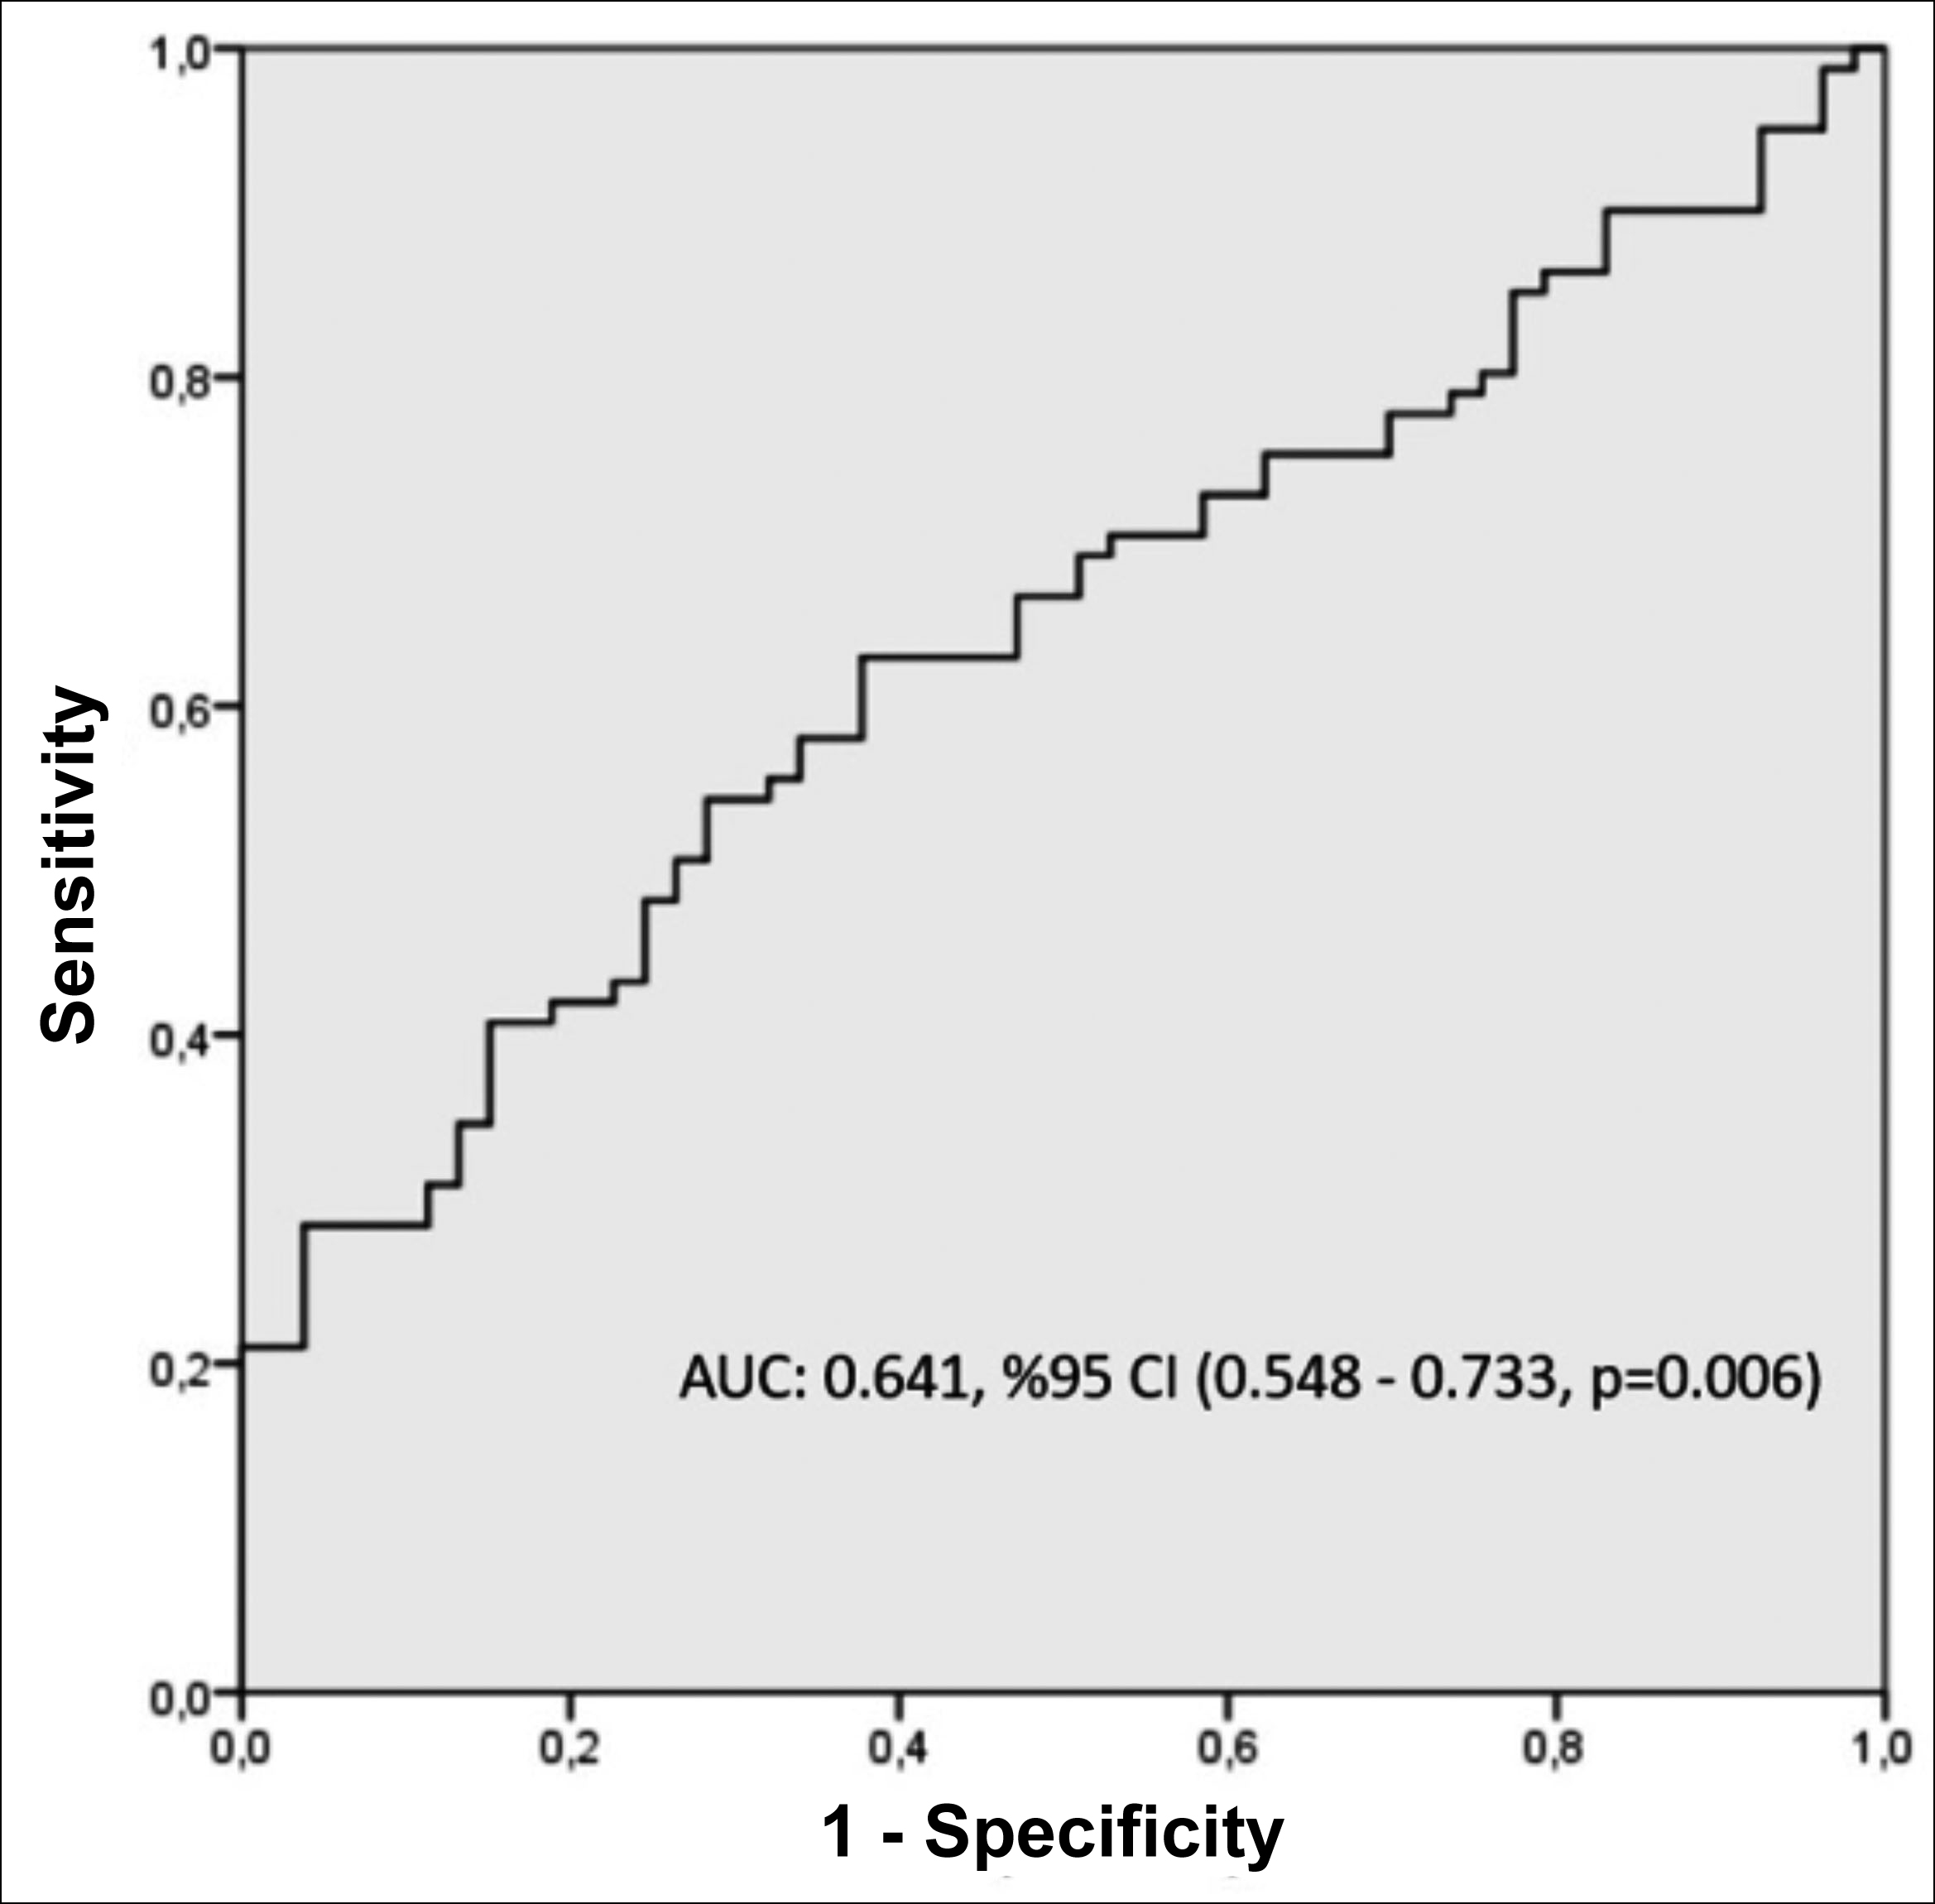 Figure 1: Receiver operating characteristics curve of leuko-glycemic index for predicting CAD severity.
DISCUSSION
This study showed that increased LGI was associated with more extended and severe CAD in patients who underwent CAG for CCS class 1. The LGI is an index calculated with the formula blood sugar x white blood cell/1000 (mg/dl.mm3).12 It was first defined by Castro et al., who used it in their study in 2010 to determine the prognostic value in patients presenting with acute myocardial infarction (AMI).12 According to this study, when the LGI was >1600 mg/dl.mm3, it was related with increased in-hospital complications. Prado et al. also showed that a high LGI value is a predictor of in-hospital, as is Killip 3-4 in patients presenting with AMI.6 Similarly, Leon Aliz et al. and Rodriguez-Jimenez et al. found that an increased LGI was associated with increased in-hospital mortality.7,14 Caldas et al. and Alvarez et al. showed that the LGI is a predictive marker for mortality at ischemic stroke.8,15 This study showed that LGI was a useful marker for the CAD severity among CCS group 1 patients.
Current CCS guidelines recommend CAD diagnosis through coronary computer tomography (CCT) for patients with suspected CAD.1 Although the reliability and efficiency of the new methods are acceptable, MPS is still the most preferred non-invasive test due to its cost-effectiveness and ease of application.16 In addition, CCT does not provide a hemodynamic answer if a fractional flow reserve is not available. Although MPS shows partial differences according to different techniques and application centres, it has 90% sensitivity and specificity at the same level.17,18 There are significant difficulties and limitations in detecting coronary ischemia in MPS performed with single-photon emission computerised tomography because patient incompatibility, high heart rate, image artifacts, and significant false-positive results reduce the diagnostic accuracy in detecting the presence of obstructive CAD.19,20 In this study, CAG was performed on 224 patients. The rate of occlusive CAD was 60.4% (134 patients). Considering these reasons, obtaining new data that can increase the sensitivity and specificity of non-invasive tests has great importance.
Logistic regression analysis revealed that LGI is strongly associated with CAD severity. But ROC analysis showed that LGI estimation is weak (AUC: 0.641). İt has high specificity but low sensitivity. So, the authors should comment on these results carefully and need further studies to support these findings. As expected, the severity of CAD increased with age and the incidence of HT and DM was higher among these patients. LGI in the logistic regression analysis. It was observed that age is an independent predictor of CAD severity and is prevalent independent of DM and HT. This result may show us, especially among older patients, that LGI may be a more beneficial marker for the prediction of CAD severity.
The Gensini scoring system was developed by Gensini et al.13 Points are given according to the location and severity of the stenosis. The stenosis severity coefficient for each lesion is multiplied by the values determined according to the location of the lesion. The Gensini score is obtained by summing the values found.21 As the prevalence and severity of CAD increase, the Gensini score increases.22 In a study comparing atherosclerosis predictors and angiographic scoring systems, when both the prevalence of CAD and its relationship with atherosclerotic predictors were examined, a positive correlation was found in both the Gensini score and the syntax score.23 In the study by Amin et al., a significant positive correlation was found between the duration of DM and the Gensini score, and this correlation was shown to be stronger in elderly and male patients.24 In the present study, the authors found the mean Gensini score to be 40 in the group with obstructive CAD and six in the group with non-obstructive CAD. When the relationship between the Gensini score and LGI was examined, a positive correlation was found. The correlation of LGI with proven scores such as the Gensini score can increase its reliability in use.
There are some limitations to the generalisation of this study’s results. It is a retrospective, cross-sectional and single-centre study. Considering the number of patients and their data, the results cannot be generalised.
Although LGI was found as a predictor of CAD severity, its sensitivity is low. So, further and larger studies are needed. Finally, the study design does not provide with prognostic knowledge.
CONCLUSION
A high LGI was a predictor of CAD severity among CCS class 1 patients and was found to correlate with the Gensini score. The use of this simple and inexpensive index, together with other non-invasive tests before CAG, may provide some knowledge about the severity of CAD. Prospective studies are needed to clarify the LGI and CAD severity prognostic relationship in terms of future cardiovascular events.
ETHICAL APPROVAL:
This study was approved by the Pamukkale University ethics committee (Approval Number: 25.01.2022/02).
PATIENTS’ CONSENT:
Written informed consent were obtained from all patients.
COMPETING INTEREST:
The authors declared no competing interest.
AUTHORS’ CONTRIBUTION:
OK: Research design and manuscript writing.
IB: Data collection.
FK: Statistical analysis and manuscript writing.
All the authors have approved the final version of the manuscript to be published.
REFERENCES
- Knuuti J, Wijns W, Saraste A, Capodanno D, Barbato E, Funck-Brentano C, et al. ESC Scientific Document Group. 2019 ESC Guidelines for the diagnosis and management of chronic coronary syndromes. Eur Heart J 2020; 41(3): 407-77. doi: 10.1093/eurheartj/ehz425.
- Laakso M, Kuusisto J. Insulin resistance and hyperglycaemia in cardiovascular disease development. Nat Rev Endocrinol 2014; 10(5):293-302. doi: 10.1038/nrendo.2014.29.
- Elkind MS, Sciacca R, Boden-Albala B, Homma S, Di Tullio M. Leukocyte count is associated with aortic arch plaque thickness. Stroke 2002; 33(11):2587-92. doi: 10.1161/01.str.0000034400.71491.10.
- Chen S, Zhang S, Luan H, Zeng X, Li Y, Yuan H. Correlation between extended leukocyte differential count and coronary artery disease. J Cardiovasc Pharmacol 2018; 71(6):359-66. doi: 10.1097/FJC.0000000000000582.
- Hirschson Prado A, Higa C, Merlo P, Domine E, Blanco P, Vazquez GA, et al. Prognostic value of the leuko-glycemic index in acute myocardial infarction. Results from the SCAr multicenter registry. Rev Argent Cardiol 2014; 82:500-5. doi.org/10.7775.rac.v85.i1.10232.
- León-Aliz E, Moreno-Martínez FL, Pérez-Fernández GA, Vega-Fleites LF, Rabassa-López-Calleja MA. [Leuko-glycemic index as an in-hospital prognostic marker in patients with ST-segment elevation myocardial infarction]. Clin Investig Arterioscler 2014; 26(4):168-75. doi: 10. 1016/j.arteri.2014.01.002.
- Caldas FA, Iaconis Campbell JD. Valor pronóstico del índice leucoglucémico en el stroke isquémico agudo. Buenos Aires (AR): Asociación Médica Argentina 2012; [cited2021Apr19].
- Ettehad D, Emdin CA, Kiran A, Anderson SG, Callender T, Emberson J, et al. Blood pressure lowering for prevention of cardiovascular disease and death: A systematic review and meta-analysis. Lancet 2016; 387:957-67. doi: 10.1016/ S0140-6736(15)01225-8.
- American Diabetes Association. 2. Classification and diagnosis of diabetes: Standards of medical care in diabetes-2021. Diabetes Care 2021; 44 (Suppl 1):S15-33. doi: 10.2337/dc21-ad09.
- Catapano AL, Graham I, De Backer G, Wiklund O, Chapman MJ, Drexel H, et al. ESC scientific document group. 2016 ESC/EAS guidelines for the management of dyslipidaemias. Eur Heart J 2016; 37:2999-3058. doi: 10.1093/eurheartj/ ehw272.
- Quiroga Castro W, Conci E, Zelaya F, Isa M, Pacheco G, Sala J, et al. Risk stratification in acute myocardial infarction according to the leukoglycemic index. The laboratory "Killip-Kimball"? Rev Fed Arg Cardiol 2010; 39(1):29-34. doi: 10.21470/1678-9741-2020-0349.
- Gensini GG. A more meaningful scoring system for determining the severity of coronary heart disease. Am J Cardiol 1983; 51:606. doi: 10.1016/s0002-9149(83) 80105-2.
- Rodriguez-Jiménez A, Fardales-Rodríguez R, Toledo-Rodríguez E, Quintana Cañizares. Índice leuco-glucémico como factor pronóstico tras un infarto agudo de miocardio con elevación del segmento ST. Revista Finlay 2019; 9(2):97-107.
- García Alvarez PJ, García Albero AP, Santana Alvarez CJ. Índice leuco glucémico como predictor a corto plazo de mortalidad en el ictus isquémico. Rev. Arc Med Camaguey. 2018; 22(2):163-70.
- Hesse B, Tagil K, Cuocolo A, Anagnostopoulos C, Bardies M, Bax J, et al. EANM/ESC procedural guidelines for myocardial perfusion imaging in nuclear cardiology. Eur J Nucl Med Mol Imaging 2005; 32:855-97. doi: 10.1007/ s00259-005-1779-y.
- Rigo P, Braat S. Radiopharmaceuticals for the study of heart. In: Murray IPC, Ell PJ, Strauss HW (Eds). Nuclear medicine in clinical diagnosis and treatment. Hong Kong: Churchill Livingstone1994; p.1059-68.
- Van Train KF, Garcia EV, Cooke CD, Areeda J. Quantitative analysis of SPECT myocardial perfusion: 99mTc-sestamibi SPECT. In DePuey EG, Berman DS, Garcia EV, eds. Cardiac SPECT imaging. Hong Kong: Lippincott-Raven Publisher 1996; p 121-46.
- Notghi A, Low CS. Myocardial perfusion scintigraphy: Past, present and future. Br J Radiol 2011; 84 Spec No 3 (Spec Iss 3):S229-36. doi: 10.1259/bjr/14625142.
- Fathala A. Myocardial perfusion scintigraphy: Techniques, interpretation, indications and reporting. Ann Saudi Med 2011; 31(6):625-34. doi: 10.4103/0256- 4947.87101.
- Ian J. Neeland, Rıyaz S. Patel, Parham Eshtehardı. Coronary angiographic scoring systems. Am Heart J 2012; 164(4): 547-552. doi: 10.1016/j.ahj.2012.07.007.
- Montorsi P, Ravagnani PM, Galli S. Association between erectile dysfunction and coronary artery disease. Role of coronary clinical presentation and extent of coronary vessels involvement: The COBRA trial. Eur Heart J 2006; 27(22):2632-9. doi: 10.1093/eurheartj/ehl142.
- Kalkan K, Hamur H, Yildirim E. The comparison of angiographic scoring systems with the predictors of atherosclerosis. Angiology 2018; 69(2):158-63. doi: 10. 1177/0003319717712118.
- Amin RUI, Ahmedani MAM, Karim M. Correlation between gensini score and duration of diabetes in patients undergoing coronary angiography. Cureus 2019; 11(2): e4010. doi: 10.7759/cureus.4010.
- Yarnell JW, Baker IA, Sweetnam PM, Bainton D, O’Brien JR, Whitehead PJ, et al. Fibrinogen, viscosity, and white blood cell count are major risk factors for ischemic heart disease. The caerphilly and speedwell collaborative heart disease studies. Circulation 1991; 83(3):836-44. doi: 10.1161/01.cir.83.3.836.