Pleth Variability Index Guided Volume Optimisation in Major Gynaecologic Surgery
By Ummahan Dalkilinc Hokenek1, Harika Kosluk Gurler1, Ayten Saracoglu2, Ahmet Kale3, Kemal Tolga Saracoglu1Affiliations
doi: 10.29271/jcpsp.2022.08.980ABSTRACT
Objective: To compare conventional fluid management (CFM) with pleth variability index (PVI) guided goal-directed fluid management (GDFM) during elective total abdominal hysterectomy and bilateral salpingo-oophorectomy (TAH+BSO) operations.
Study Design: Randomised controlled trial.
Place and Duration of Study: Department of Anaesthesiology and Reanimation, Faculty of Medicine, Health Sciences University, Kartal Dr. Lutfi Kirdar City Hospital, Istanbul, Turkey, from February to July 2021.
Methodology: This trial included 78 patients aged 18-65 years with ASA I-III who would undergo elective TAH-BSO under general anaesthesia. Following randomisation with the closed envelope method, standard monitoring, and 250 ml crystalloid infusion during anaesthesia induction, maintenance fluid therapy was administered at 8-10 ml/Kg/hour to the control group and 2-3 ml/Kg/hour to the PVI group. If the mean arterial pressure (MAP) was ≤65 mmHg and/or the MAP was decreased by more than 20%, and the PVI was >13%, a 250 ml colloid bolus was given. When there was no response, a vasoactive agent was administered. Vital signs, laboratory findings, and postoperative complications were evaluated.
Results: Age, weight, BMI, urine output, bleeding, hospital stay, comorbidities, intraoperative use of blood products, and complication rates were not significantly different between the PVI and CFM groups (p>0.05). The PVI group had shorter operational times and used less crystalloid than the control group (p=0.033 and p<0.001, respectively). The PVI group's postoperative base excess (BE) levels changed significantly less than the control group's (p<0.001). In both pre- and postoperative haemoglobin, haematocrit, urea, creatinine, electrolytes, and lactate measurements, there were no statistically significant differences between the groups (p>0.05).
Conclusion: PVI-GDFM is equally safe as CFM for intraoperative fluid management during elective complete abdominal hysterectomy and bilateral salpingo-oophorectomy procedures.
Key Words: Pleth variability index, Fluid management, Base excess.
INTRODUCTION
Fluid management is critical to maintaining organ perfusion and avoiding postoperative problems. In addition to pulmonary edema and pneumonia, hypervolemia has been associated with gastrointestinal problems. Hypervolemia can also damage the endothelium glycocalyx, increase intravascular hydrostatic pressure, and trigger ANP release.
Intraoperative hypovolemia can cause hypotension, arrhythmia, and acute renal damage due to diminished tissue perfusion. Hyper/hypovolemia-related issues may lengthen hospital stays.1 Intraoperative fluid management should therefore strive to maintain central euvolemia and fluid and electrolyte balance.1 The Enhanced Recovery After Surgery (ERAS) regimen also aims to increase tissue perfusion and fluid therapy. The only approaches to do this are to maintain central euvolemia and prevent excessive fluid loss.1
The American Society of Anaesthetists (ASA) recommend that patients have continuous blood circulation throughout anesthesia.2 The same guidelines advocate monitoring all the patients' intraoperative heart rate, blood pressure, and ECG every five minutes.2 Pulses checking is done by palpation, auscultation, monitoring intra-arterial pressure, ultrasonography, plethysmography, or oximetry.2
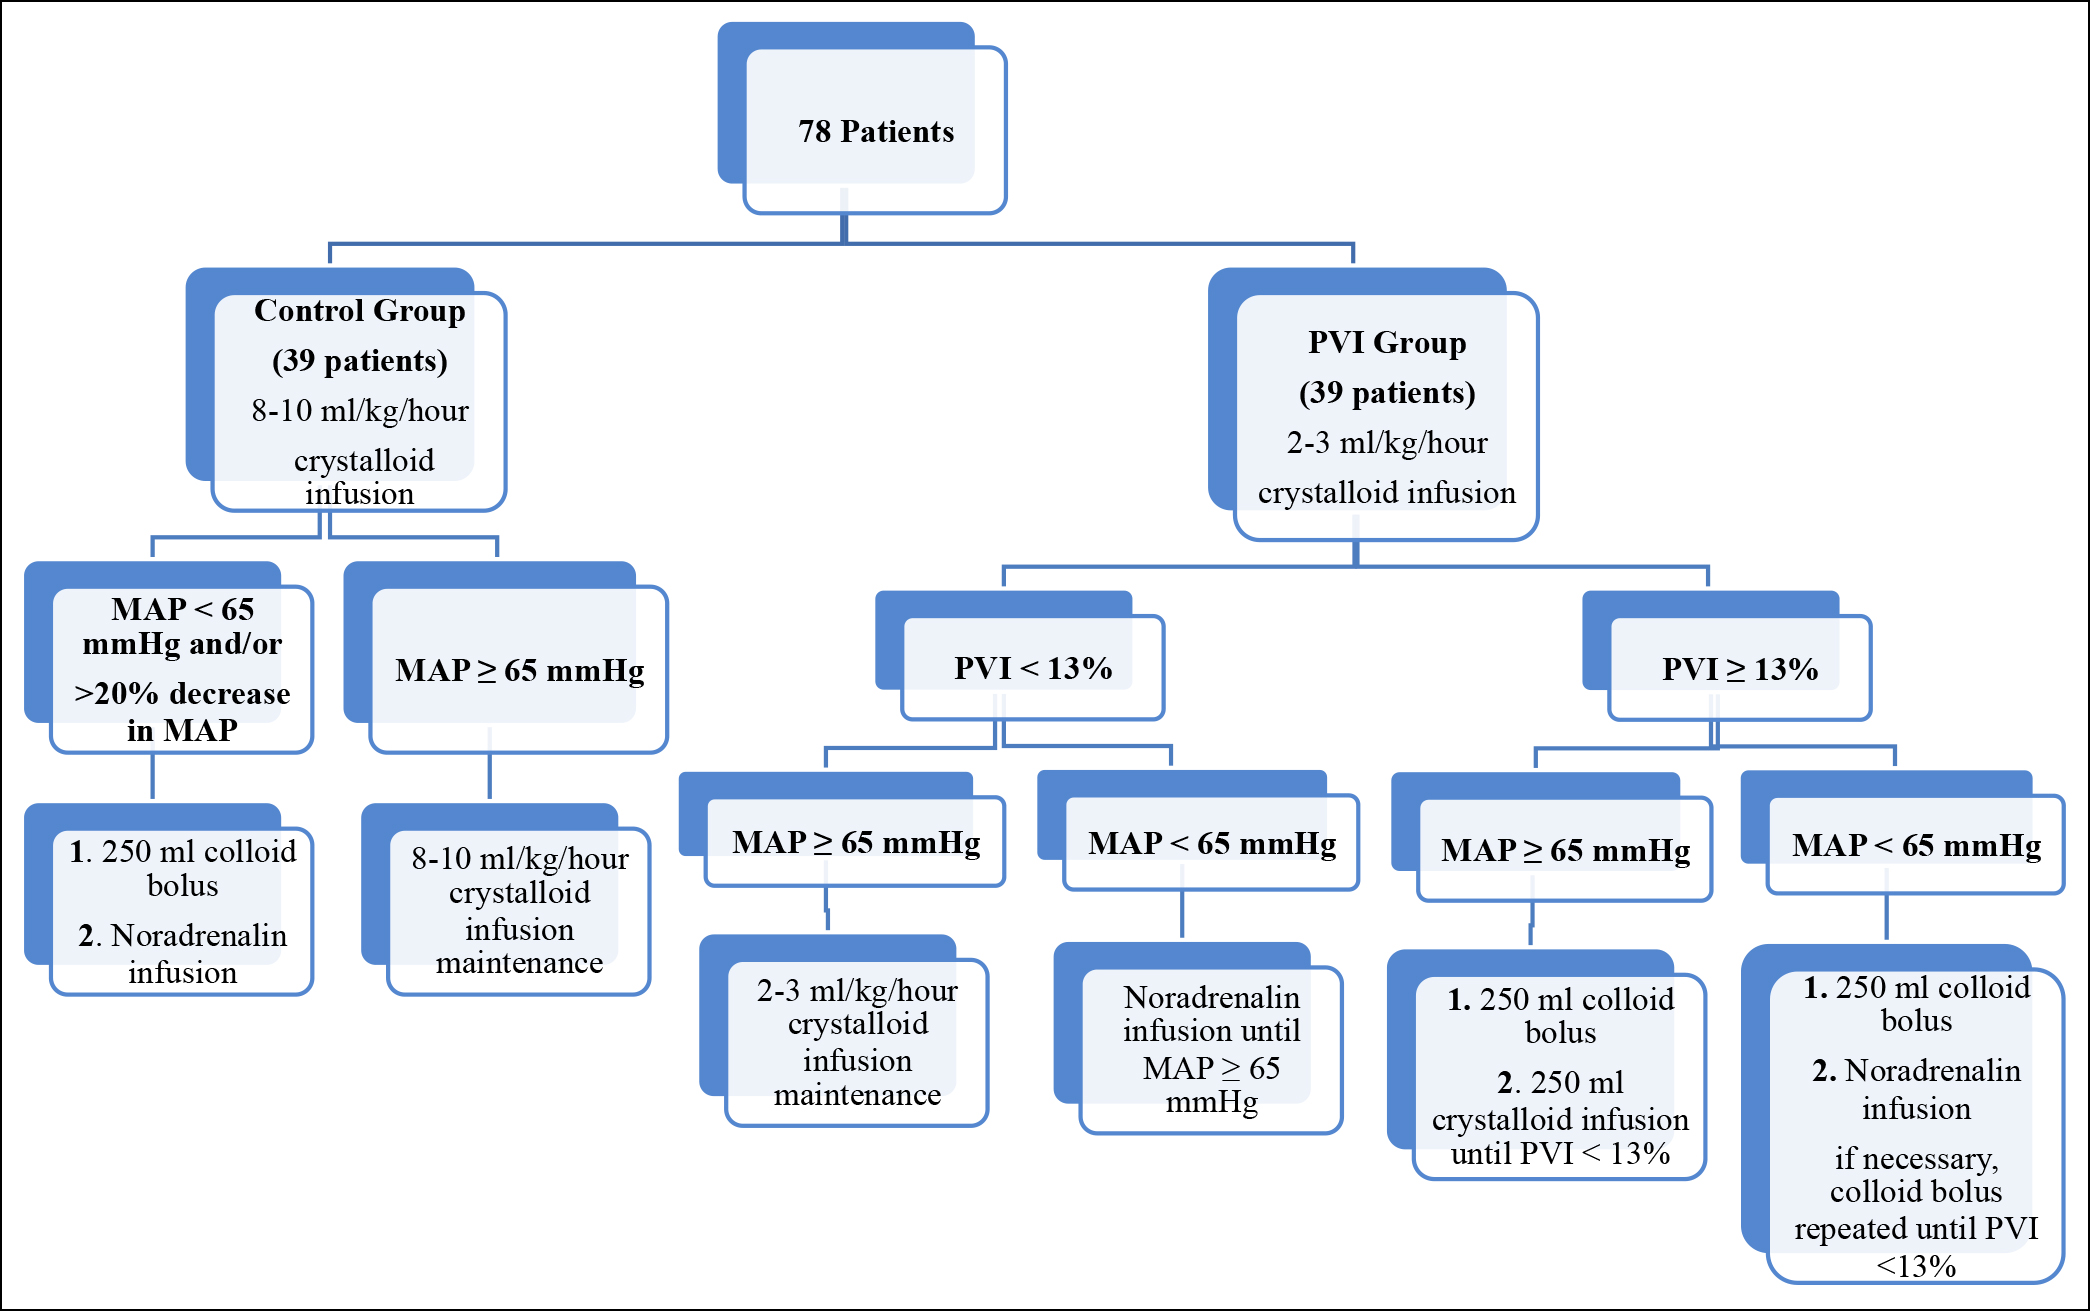 Figure 1: Decision steps of fluid therapy applied to the patients.17
For intraoperative fluid management, either the CFM protocol or the GDFM protocol is often used.1,3 CFM has a distinguished history.4 The intraoperative fluid requirements can be approximated using the patient's pulse, blood pressure, and urine output. The CFM's fluid therapy evaluation standards are inadequate.4
GDFM can now be used for intraoperative fluid treatment.1,3 PVI, pulse pressure variation, and stroke volume fluctuation are the examples of dynamic parameters that can be used in GDFM.5 These dynamic measurements better indicate patient’s reaction to the fluid treatment. GDFM fluid loading regimens are tailored to each patient's needs. These techniques use fluids and inotropic drugs to increase tissue oxygenation and perfusion.6 The GDFM algorithms are still not conventional in clinical practice.7 Thus, intraoperative fluid therapy applications have emerged.8
The PVI is calculated using the peripheral perfusion index (PI) which is the amplitude difference between infrared signals.9 PVI takes into consideration PI changes during inhalation and exhalation. PVI = [(PImax. PImin)] /100.9 Because PVI is non-invasive and dynamic, clinicians can utilize its numerical value to guide treatment.10 By offering the patient optimal fluid management, both hypervolemia and hypovolemia can be avoided. PVI-guided GDFM has been studied extensively.10 There is no study showing the use of PVI during total abdominal hysterectomy and bilateral salpingo-oophorectomy yet.
In this study, the primary aim was to compare the amount of fluid given between CFM and PVI-guided GDFM protocols during elective TAH + BSO in a randomised controlled manner. The secondary aim was to evaluate the postoperative effects of these two protocols.
METHODOLOGY
The Ethics Committee at Kartal Dr. Lutfi Kirdar City Hospital (IRB: 2020/514/172/4) approved the study as a prospective, single-centred, and randomised controlled clinical experiment. The study was also registered at www.clinicaltrials.gov vide. NCT04775576. The study enrolled 78 patients between the ages of 18 and 65 years with ASA levels of 1, 2, or 3 who were scheduled for elective TAH + BSO. Under 18-year patients with severe cardiac arrhythmias, as well as those with advanced heart failure (ejection fraction under 30 percent), acute and/or chronic renal failure, or extensive lung diseases, were not included in the trial. Detailed instructions were given to the patients before the procedure. All the patients, who agreed to participate in the trial, gave written informed consent.
At the time of their arrival in the operating room, all the patients had electrocardiography, non-invasive blood pressure monitorisation, and pulse oximetry measures. Following the administration of 1 mg of midazolam as a premedication, the non-dominant hand radial arterial cannulation was performed and blood pressure was continuously monitored. Also, for the PVI group, PVI and continuous haemoglobin (SpHb) were measured utilising pulse oximetry probe readings through the index finger on the side without arterial cannulation (Masimo Rainbow SET; Masimo Corp, Irvine, CA, ABD Radical 7, software version 7.6.2.2; Masimo Corp). After the two minutes of preoxygenation, 2 mg/Kg propofol, 0.6 mg/Kg rocuronium, and 2 μg/Kg fentanyl were administered intravenously for anaesthesia induction. After tracheal intubation, anaesthesia was maintained with sevoflurane. Mechanical ventilator settings were adjusted as follows: tidal volume 6-8 ml/Kg, inspiratory: expiratory ratio ½, and frequency 35-40 mmHg to maintain normocapnia.
The fluid treatment was used in the study in accordance with a previous randomised controlled trial.11 In many researches, a PVI reference value of 7% to 20% has been recognised.12 For the purposes of this investigation, the PVI cut-off value of 13 percent was adopted as it has been in prior studies based on the comorbidities and operation of each patient.11 Patients were given 250 milliliters of 0.9 percent NaCl during induction, followed by 2-3 milliliters/Kg 0.9 percent NaCl of maintenance fluid (Isolin balanced, Polifarma Co) every two to three hours after that. Following up fluid therapy was continued if PVI was 13% and the mean arterial pressure (MAP) was 65 mmHg. IV colloid (Gelofusine®, B. Braun) was given if the patient's blood pressure (MAP) was less than 65 mmHg and the patient's PVI was more than 13 percent during the five-minute checks. When PVI was greater than 13% and MAP was less than 65 mmHg, an IV colloid infusion of 250 ml was administered to those individuals. An IV colloid and noradrenaline infusion were started and repeated until MAP 65 mmHg, and PVI 13 percent were achieved during 5-minute intervals of monitoring (Figure 1). An anaesthetic infusion of 250 ml crystalloid (NaCl 0.9 percent or Isolin balanced, Polifarma Co) was administered during the induction of anaesthesia in the control group followed by an 8-10 ml/Kg/hour fluid resuscitation. A 250 ml IV colloid bolus was given if MAP was 65 mmHg or if the drop in MAP was greater than 20%. Noradrenaline was administered if the drop in MAP did not improve following the colloid injection or when the patient's MAP was less than 65 millimeters of mercury (Figure 1). The European Society of Anaesthesiology’s perioperative bleeding treatment standards were followed in both groups.13 Laboratory haemoglobin values in the control group, and SpHb and laboratory haemoglobin values in the PVI group were used to monitor bleeding status.
Anaesthesiologists in both groups documented the pulse, SpO2, MAP, urine output, amount of bleeding, and the amount of crystalloid and colloid utilised on a standard data form during the procedure. Additionally, the SpHb and PVI values were recorded in the same format for the patients in the PVI group. Anaesthesia induction and end-of-operation blood samples were collected. Haemoglobin (Hgb), haematocrit (HCT), blood urea (BU), creatinine (CR), sodium (Na), potassium (K), and chloride (Cl) were all measured in the samples taken from the patient. Complications following surgery, such as haemorrhage, hypo/hypertension, and respiratory distress as well as the length of hospitalisation were also noted. Patients were randomised into two groups during the procedure (control group: 40, PVI group: 40). Randomisation.com's automated technology was used for this purpose. The patients were separated into two groups i.e. the CFM group and the PVI group, based on the information found on this website
Statistical analysis was performed using Statistical Package for the Social Sciences (SPSS) software, version 20.0. The study's results were summarised using a variety of numerical measures, including the mean, median, mode, range, and percentages. The analyses based on the Shapiro-Wilk test and graphs were used to determine whether or not the numerical data was normally distributed. Also, normality of the variables are not only assessed with normality tests but also with exploring respective histograms, q-q plots, and box-plots. A sample size bigger than 30 is another indication of normality according to central limit theorem. By taking all of these into consideration, parametric tests were used for all the variables. This study utilised the independent and paired t-tests while evaluating normally distributed variables between the two groups. To compare qualitative data, we used Pearson chi-square and Fisher's exact tests. As long as the p-value was below 0.05, it was considered statistically significant.
RESULTS
There were a total of 92 patients who were eligible to participate in the trial. A total of 78 patients, who met the criteria for the study, took part in it over the course of six months, from February to July 2021. Due to a modification in intra-operative surgical procedure, one patient was omitted and another patient was lost to follow-up. As a consequence, a total of 78 individuals were studied; 39 patients were assigned to each group.
Patient ages ranged widely with an average age of 48.78±5.76 years. Table I summarises the demographics of all the patients. No statistically significant differences in the age, weight, BMI, urine output, bleeding, length of hospital stay, presence of comorbidities, usage of blood products, and complications were found between the control and PVI groups according to the study (p >0.05, Table II). In terms of the total amount of crystalloid and total colloid used, there was a statistically significant difference (p <0.001 for both) between the PVI group and the control group (Table II). PVI patients needed less time in surgery than control patients according to the study's statistical analysis (p = 0.033). There was no significant difference in the changes in haemoglobin, haematocrit, urea, creatinine, potassium, PO2, PCO2, HCO3, lactate, and SpO2 between the preoperative and postoperative blood and the arterial blood gas values of the groups (p >0.05, Table III). Preoperative sodium, chloride, and base excess were significantly different amongst the groups (p = 0.015, p = 0.012, and p = 0.005, respectively). The p-values of 0.011 for pH and 0.024 for chlorine were found to be statistically and significantly different between the two groups following the surgery. The PVI patients showed statistically significant changes in haemoglobin, haematocrit, Na, K, pH, and PO2 values following the surgery (p <0.001 for all, Table III).
Table I: Demographic and clinical data of the patients and comparison between the groups.
|
|
Min-max |
Mean ± SD |
|
|
Age (years) |
39-67 |
48.78 ± 5.76 |
|
|
Weight (kg) |
55-116 |
79.69 ± 13.29 |
|
|
Height (cm) |
155-172 |
161.74 ± 3.67 |
|
|
BMI (Kg/cm2) |
21.6-44.92 |
30.49 ± 5.16 |
|
|
Comorbidities, n (%) |
54 |
69.2 |
|
|
Hypertension |
23 |
29.5 |
|
|
Hypothyroidism |
14 |
17.9 |
|
|
Asthma |
11 |
14.1 |
|
|
Diabetes mellitus |
11 |
14.1 |
|
|
Smoking |
7 |
9.0 |
|
|
Anemia |
3 |
3.8 |
|
|
Migraine |
2 |
2.6 |
|
|
Breast cancer |
2 |
2.6 |
|
|
HCV (+) |
2 |
2.6 |
|
|
CAD |
2 |
2.6 |
|
|
MI |
1 |
1.3 |
|
|
|
Control group |
PVI group |
p |
|
Mean ± SD |
Mean ± SD |
||
|
Age |
48.77 ± 6.12 |
48.79 ± 5.45 |
a0.984 |
|
Weight (Kg) |
78.31 ± 12.58 |
81.08 ± 13.98 |
a0.361 |
|
Height (cm) |
161.51 ± 3.56 |
161.97 ± 3.81 |
a0.582 |
|
BMI (kg/cm2) |
30.01 ± 4.71 |
30.96 ± 5.6 |
a0.419 |
|
Comorbidities, n (%) |
29 (74.4) |
25 (64.1) |
b0.326 |
|
BMI: Body mass index, HCV: Hepatitis c virus, CAD: Coronary artery disease, MI: Myocardial infarction.. aIndependent-samples t-test, bPearson’s chi-square test, cFisher’s exact test, *p <0.05. PVI: Pleth variability index, HCV: Hepatitis C virus, CAD: Coronary artery disease, MI: Myocardial infarction. |
|||
Table II: Comparison of operative and treatment-related characteristics between the groups.
|
|
Control |
PVI |
p |
|
Mean ± SD |
Mean ± SD |
||
|
Total crystalloid |
1508.97 ± 371.14 |
654.87 ± 146.91 |
a<0.001* |
|
Total colloid |
12.82 ± 80.06 |
417.95 ± 244.54 |
a<0.001* |
|
Diuresis |
260.13 ± 167.59 |
218.72 ± 142.16 |
a0.243 |
|
Blood product, n (%) |
3 (7.7) |
2 (5.1) |
c0.999 |
|
Operative time |
105.38 ± 30.23 |
92.56 ± 20.8 |
a0.033* |
|
Bleeding |
272.69 ± 274.92 |
193.97 ± 132.09 |
a0.113 |
|
Length of hospital stay (days) |
2 ± 0.46 |
2.03 ± 0.78 |
a0.860 |
|
Perioperative complication, n (%) |
1 (2.6) |
4 (10.3) |
c0.358 |
|
aIndependent-samples t-test, bPearson’s chi-square test, cFisher’s exact test, *p <0.05. PVI: Pleth variability index. |
|||
In terms of preoperative to postoperative changes in arterial blood gas parameters, the intergroup comparison of haemoglobin, haematocrit, pH, PCO2, and BE showed a significant difference (Table III). Although there was a significant difference in the postoperative pH values between the groups (p = 0.011), no statistically significant difference was detected in relation to the rate of patients with an intraoperative pH value of <7.35 in both groups (p = 0.999) (Table III). Analysing both groups' levels of tachycardia (pulse >100 beats per minute, 4 vs. 5 in controls vs. PVI group respectively) and hypotension (MAP <65 millimeters of mercury, 5 in both groups) after surgery revealed no statistically significant differences (p >0.05). One patient was removed from the study due to a surgical problem that was discovered throughout the course of the research. Fluid treatment was shown to have no other negative affects or complications in either group.
DISCUSSION
In this study, PVI-guided GDFM and CFM fluid therapy techniques were evaluated in elective major gynaecological surgery for the first time, to the best of the authors’ knowledge. The PVI (GDFM) group consumed less fluid than the control (CFM) group, indicating appropriate fluid therapy (p <0.001). Neither restricted nor non-restrictive fluid treatment caused hypovolemia. Postoperative pH changes in both PVI and control groups were significant (p <0.001 and 0.011, respectively). However, when the difference in the pH change between the groups was examined, a higher change was detected in the PVI group in which the pH values never fell below the physiological lower limit of 7.35. This result may suggest that restrictive fluid therapy to be applied in PVI-guided GDFM is as safe as CFM in maintaining body pH. GDFM is less likely than CFM to generate more fluid changes. Tachycardia and hypotension are expected findings in restrictive fluid treatment. According to the results of this study, there was no significant difference between the control and PVI groups in terms of these two hemodynamic conditions (p = 0.999 for both). A meta-analysis on GDFM reported that this approach reduced the arrhythmia rate and did not cause a difference in terms of myocardial infarction and cardiac arrest which is consistent with this study.14
Acute renal failure (ARF) is a common complication after surgery.15 It has also been associated with in-hospital mortality and morbidity.16 It has been reported that GDFM reduces mortality in the patients with ARF or at risk of ARF, and its use is strongly recommended.17 In this study, no statistically significant change was found in the creatinine values of the patients in the control or PVI group (p=0.600 and p=0.445, respectively). The urea value of the patients in the control group decreased postoperatively (p=0.008). This result can be associated with the provision of a higher volume of the fluids for the control group than the PVI group. However, in the PVI group, there was no laboratory result or evidence of impaired renal function such as high urea, high creatinine, or decreased urine output in any of the patients postoperatively.
Table III: Comparison of the changes in the preoperative and postoperative blood and blood gas values between the groups.
|
|
Control |
PVI |
ap |
|
|
Mean ± SD |
Mean ± SD |
|||
|
Hemoglobin |
Preoperative |
12.1 ± 1.78 |
12.21 ± 1.91 |
0.788 |
|
|
Postoperative |
10.7 ± 1.48 |
11.09 ± 1.56 |
0.259 |
|
|
Difference (post-pre) |
-1.39 ± 1.02 |
-1.12 ± 1.17 |
0.266 |
|
|
dp |
<0.001* |
<0.001* |
|
|
Hematocrit |
Preoperative |
37.8 ± 4.77 |
39.02 ± 4.74 |
0.262 |
|
|
Postoperative |
33.3 ± 3.98 |
34.42 ± 4.15 |
0.230 |
|
|
Difference (post-pre) |
-4.5 ± 3.23 |
-4.6 ± 3.59 |
0.897 |
|
|
dp |
<0.001* |
<0.001* |
|
|
Urea |
Preoperative |
26.49 ± 7.01 |
25 ± 6.96 |
0.350 |
|
|
Postoperative |
24.03 ± 6.07 |
23.87 ± 9.79 |
0.934 |
|
|
Difference (post-pre) |
-2.46 ± 5.52 |
-1.13 ± 9.13 |
0.438 |
|
|
dp |
0.008* |
0.445 |
|
|
Creatinine |
Preoperative |
0.66 ± 0.13 |
0.64 ± 0.16 |
0.434 |
|
|
Postoperative |
0.65 ± 0.18 |
0.64 ± 0.14 |
0.731 |
|
|
Difference (post-pre) |
-0.01 ± 0.12 |
0 ± 0.07 |
0.529 |
|
|
dp |
0.600 |
0.730 |
|
|
Sodium |
Preoperative |
138.26 ± 2.35 |
139.54 ± 2.2 |
0.015* |
|
|
Postoperative |
137.15 ± 2.08 |
137.49 ± 2.13 |
0.487 |
|
|
Difference (post-pre) |
-1.1 ± 2.56 |
-2.05 ± 2.36 |
0.093 |
|
|
dp |
0.011* |
<0.001* |
|
|
Potassium |
Preoperative |
4.41 ± 0.45 |
4.4 ± 0.35 |
0.982 |
|
|
Postoperative |
4.05 ± 0.48 |
4.1 ± 0.41 |
0.617 |
|
|
Difference (post-pre) |
-0.36 ± 0.37 |
-0.3 ± 0.36 |
0.526 |
|
|
dp |
<0.001* |
<0.001* |
|
|
Chlorine |
Preoperative |
102.51 ± 2.04 |
103.9 ± 2.68 |
0.012* |
|
|
Postoperative |
102.41 ± 2.53 |
103.79 ± 2.76 |
0.024* |
|
|
Difference (post-pre) |
-0.1 ± 2.58 |
-0.1 ± 3.65 |
0.999 |
|
|
dp |
0.806 |
0.862 |
|
|
pH |
Preoperative |
7.42 ± 0.04 |
7.42 ± 0.04 |
0.576 |
|
|
Postoperative |
7.41 ± 0.04 |
7.39 ± 0.04 |
0.011* |
|
|
Difference (post-pre) |
-0.01 ± 0.03 |
-0.03 ± 0.05 |
0.040* |
|
|
dp |
0.011* |
<0.001* |
|
|
PO2 |
Preoperative |
180.36 ± 31.75 |
182.96 ± 35.12 |
0.733 |
|
|
Postoperative |
162.72 ± 35.91 |
159.48 ± 34.09 |
0.684 |
|
|
Difference (post-pre) |
-17.64 ± 43.92 |
-23.48 ± 32.83 |
0.508 |
|
|
dp |
0.017* |
<0.001* |
|
|
PCO2 |
Preoperative |
36.83 ± 3.54 |
35.16 ± 3.96 |
0.054 |
|
|
Postoperative |
35.4 ± 3.9 |
35.7 ± 4.29 |
0.745 |
|
|
Difference (post-pre) |
-1.43 ± 4.01 |
0.54 ± 4.23 |
0.038* |
|
|
dp |
0.032* |
0.431 |
|
|
HCO3 |
Preoperative |
24.32 ± 2.05 |
23.61 ± 2.74 |
0.197 |
|
|
Postoperative |
23.49 ± 3.42 |
22.86 ± 2.58 |
0.355 |
|
|
Difference (post-pre) |
-0.83 ± 2.85 |
-0.75 ± 2.45 |
0.901 |
|
|
dp |
0.078 |
0.063 |
|
|
BE |
Preoperative |
-0.12 ± 2.21 |
-1.38 ± 1.65 |
0.005* |
|
|
Postoperative |
-1.45 ± 2.08 |
-1.45 ± 1.21 |
0.999 |
|
|
Difference (post-pre) |
-1.34 ± 1.38 |
-0.07 ± 1.51 |
<0.001* |
|
|
dp |
<0.001* |
0.775 |
|
|
Lactate |
Preoperative |
1.38 ± 0.55 |
1.44 ± 0.53 |
0.631 |
|
|
Postoperative |
1.49 ± 0.5 |
1.42 ± 0.71 |
0.620 |
|
|
Difference (post-pre) |
0.12 ± 0.44 |
-0.01 ± 0.59 |
0.282 |
|
|
dp |
0.113 |
0.893 |
|
| Cont… | ||||
|
SPO2 |
Preoperative |
99.04 ± 0.88 |
99.09 ± 0.95 |
0.809 |
|
|
Postoperative |
99.04 ± 0.81 |
98.85 ± 1.19 |
0.407 |
|
|
Difference (post-pre) |
0 ± 0.66 |
-0.24 ± 1.44 |
0.344 |
|
|
dp |
0.999 |
0.300 |
|
|
Hemoglobin |
Preoperative |
11.53 ± 1.91 |
12.14 ± 1.95 |
0.165 |
|
|
Postoperative |
10.67 ± 1.73 |
10.69 ± 1.8 |
0.964 |
|
|
Difference (post-pre) |
-0.86 ± 0.95 |
-1.45 ± 1.96 |
0.093 |
|
|
dp |
<0.001* |
<0.001* |
|
|
Hematocrit |
Preoperative |
35.47 ± 5.64 |
37.48 ± 5.88 |
0.127 |
|
|
Postoperative |
32.96 ± 5.17 |
33.59 ± 5.18 |
0.595 |
|
|
Difference (post-pre) |
-2.51 ± 2.82 |
-3.89 ± 6.26 |
0.213 |
|
|
dp |
<0.001* |
<0.001* |
|
|
aIndependent samples t test, dPaired-samples t test, *p<0.05. PVI: Pleth variability index, PO2: Partial oxygen pressure, PCO2: Partial carbon dioxide pressure, HCO3: Bicarbonate, BE: Base excess, SPO2: Oxygen saturation. |
||||
Blood lactate level provides indirect information about organ perfusion. Lactate concentrations can rise due to hypoperfusion.18 In particular, lactate levels have been associated with postoperative complications and length of hospital stay. In this study, no statistically significant difference was found in the lactate changes from the preoperative to postoperative period in the Control and PVI groups (p = 0.113 and p = 0.893 respectively). In a study comparing PVI-guided GDFM and CFM in elective colorectal surgery, the first-hour lactate change was found to be higher in the former, but no statistically significant result was found postoperatively.19
The PVI group had a considerably shorter operational duration (p = 0.033). PVI-guided GDFM appears to be more successful due to lower postoperative mortality and morbidity rates. No one in either group developed pulmonary edema, sepsis, or delirium. Length of stay in hospital did not differ between the groups (p = 0.860). During PVI-guided GDFM, no intraoperative fluid management complications were reported.
The study has some flaws, the most notable being the small patient population. Also, the long-term effects of PVI-guided hydration therapy were not studied, therefore patient mortality could not be compared. These factors limit authors’ findings' generalisation. The future research using different PVI values and evaluating many patient groups throughout time can contribute to the literature and provide more detailed results on mortality and morbidity.
CONCLUSION
PVI-guided GDFM is at least as safe as CFM in elective TAH + BSO. The shorter operative time, lower-volume fluid replacement, and less changes in arterial blood gas parameters are the advantages of GDFM under PVI guidance.
FUNDING:
This research did not receive any specific grant from funding agencies in the public, commercial, or not-for-profit sectors.
PATIENTS’ CONSENT:
Written informed consent was obtained from all the patients participating in the study.
COMPETING INTEREST:
The authors declared no competing interest.
AUTHORS’ CONTRIBUTION:
UDH, AS, KTS: Conceptualisation and methodology.
UDH, AS, HKG, AK, KTS: Investigation.
HKG, AK: Validation.
UDH, HKG, AK, KTS: Resources.
UDH: Wrote original draft.
UDH, AS, KTS: Manuscript writing, review, and editing.
AS, KTS: Supervision.
All the authors have approved the final version of the manuscript to be published.
REFERENCES
- Miller TE, Roche AM, Mythen M. Fluid management and goal-directed therapy as an adjunct to enhanced recovery after surgery (ERAS). Can J Anaesth 2015; 62(2):158-68. doi: 10.1007/s12630-014-0266-y.
- Standards, Committee PP. American society of anesthesiologists. Standards for basic anesthetic monitoring. July 1, 2011. 2012.
- Rollins KE, Lobo DN. Intraoperative goal-directed fluid therapy in elective major abdominal surgery: A meta-analysis of randomised controlled trials. Ann Surg 2016; 263(3):465. doi: 10.1097/SLA.0000000000001366.
- Kumar A, Anel R, Bunnell E, Habet K, Zanotti S, Marshall S, et al. Pulmonary artery occlusion pressure and central venous pressure fail to predict ventricular filling volume, cardiac performance, or the response to volume infusion in normal subjects. Crit Care Med 2004; 32(3):691-9. doi: 10.1097/01.ccm.0000114996.68110.c9.
- Grocott M, Dushianthan A, Hamilton M, Mythen M, Harrison D, Rowan K, et al. Perioperative increase in global blood flow to explicit defined goals and outcomes after surgery: A cochrane systematic review. Br J Anaesth 2013; 111(4): 535-48. doi: 10.1093/bja/aet155.
- Michard F. The burden of high-risk surgery and the potential benefit of goal-directed strategies. Crit Care 2011; 15(5): 1-2. doi: 10.1186/cc10473.
- Doherty M, Buggy D. Intraoperative fluids: How much is too much? Br J Anaesth 2012; 109(1):69-79. doi: 10.1093/ bja/aes171. E.
- Lilot M, Ehrenfeld J, Lee C, Harrington B, Cannesson M, Rinehart J. Variability in practice and factors predictive of total crystalloid administration during abdominal surgery: Retrospective two-centre analysis. Br J Anaesth 2015; 114(5): 767-6. doi: 10.1093/bja/aeu452.
- Cannesson M, Desebbe O, Rosamel P, Delannoy B, Robin J, Bastien O, et al. Pleth variability index to monitor the respiratory variations in the pulse oximeter plethysmographic waveform amplitude and predict fluid responsiveness in the operating theatre. Br J Anaesth 2008; 101(2):200-6. doi: 10.1093/bja/aen133.
- Ramsingh D, Staab J, Flynn B. Application of perioperative hemodynamics today and potentials for tomorrow. Best Prac Res Clin Anaesthesiol 2021; 35(4):551-64. doi.org/ 10.1016/j.bpa.2021.01.005.
- Yu Y, Dong J, Xu Z, Shen H, Zheng J. Pleth variability index-directed fluid management in abdominal surgery under combined general and epidural anaesthesia. J Clin Monit Comput 2015; 29(1):47-52. doi: 10.1007/s10877-014- 9567-5.
- Liu T, Xu C, Wang M, Niu Z, Qi D. Reliability of pleth variability index in predicting preload responsiveness of mechanically ventilated patients under various conditions: A systematic review and meta-analysis. BMC Anesthesiol 2019; 19(1):1-7. doi: 10.1186/s12871-019-0744-4.
- Kozek-Langenecker SA, Ahmed AB, Afshari A, Albaladejo P, Aldecoa C, Barauskas G, et al. Management of severe perioperative bleeding: Guidelines from the European society of anaesthesiology: First update 2016. Eur J Anaesthesiol 2017; 34(6):332-95. doi: 10.1097/EJA.0000 000000000630.
- Chong MA, Wang Y, Berbenetz NM, McConachie I. Does goal-directed haemodynamic and fluid therapy improve peri-operative outcomes? A systematic review and meta-analysis. Eur J Anaesthesiol 2018; 35(7):469-83. doi: 10. 1097/EJA.0000000000000778.
- Zarbock A, Koyner JL, Hoste EA, Kellum JA. Update on perioperative acute kidney injury. Anesth Analg 2018; 127(5):1236-45. doi: 10.1213/ANE.0000000000003741.
- Deng Y, Yuan J, Chi R, Ye H, Zhou D, Wang S, et al. The incidence, risk factors and outcomes of postoperative acute kidney injury in neurosurgical critically ill patients. Sci Rep 2017; 7(1):1-9. doi: 10.1038/s41598-017-04627-3.
- Landoni G, Bove T, Szekely A, Comis M, Rodseth RN, Pasero D, et al. Reducing mortality in acute kidney injury patients: Systematic review and international web-based survey. J Cardiothorac Vasc Anesth 2013; 27(6):1384-98. doi: 10.1053/j.jvca.2013.06.028.
- Bakker J, Nijsten MW, Jansen TC. Clinical use of lactate monitoring in critically ill patients. Ann Intensive Care 2013; 3(1):1-8. doi: 10.1186/2110-5820-3-12.
- Cesur S, Cardakozu T, Kus A, Turkyilmaz N, Yavuz O. Comparison of conventional fluid management with PVI-based goal-directed fluid management in elective colorectal surgery. J Clin Monit Comput 2019; 33(2): 249-57. doi: 10.1007/s10877-018-0163-y.