m6A RNA, FTO, ALKBH5 Expression in Type 2 Diabetic and Obesity Patients
By Erhan Onalan1, Burkay Yakar2, Ebru Etem Onalan3, Koray Karakulak1, Tugce Kaymaz3, Emir Donder1Affiliations
doi: 10.29271/jcpsp.2022.09.1143ABSTRACT
Objective: To investigate whether m6A content changes in type 2 diabetes mellitus (T2DM) and obese individuals and whether the relationship of m6A content with the mRNA expression levels of FTO and ALKBH5 genes.
Study Design: Cross-sectional study.
Place and Duration of Study: Department of Internal Medicine, Firat University, Medical School, Elazig, Turkey, between January 2019 and January 2022.
Methodology: The study included 34 newly diagnosed patients with type 2 diabetes mellitus, 34 obese individuals, and 33 healthy individuals without any chronic and metabolic disease matched for age and gender. The global m6A RNA methylation, FTO, and ALKBH5 gene analyses of all the participants were performed. Total cholesterol, triglyceride, LDL, HDL, HbA1c, and insulin and glucose levels were measured.
Results: The median percentages of m6A RNA methylation in the control group, obese, and T2DM participants were 5.62%, 4.20%, and 5.21% respectively (p=0.004). The m6A RNA methylation percentage of the obese participants was significantly lower than controls (p=0.021). The FTO and ALKBH5 mRNA levels were significantly lower in obese and T2DM participants than in controls. There was a negative significant correlation between m6A RNA level and FTO i.e. (r=-0.291, p=0.003) and ALKBH5 (r=-0.321. p=0.001) levels.
Conclusion: m6A RNA expression levels of obese individuals were lower than healthy controls. The FTO and ALKBH5 mRNA expressions were lower in both obese and T2DM participants compared to the healthy controls. There was no significant difference between obese and T2DM individuals in terms of m6A RNA expression, FTO and ALKBH5 mRNA expression. m6A RNA expression, FTO, and ALKBH5 levels have a potential role in obesity and diabetes mellitus.
Key Words: m6A RNA methylation, Epigenesis, Genetic, FTO, ALKBH5.
INTRODUCTION
Obesity and type 2 diabetes mellitus (T2DM) combination is being called “diabesity” recently. The reason for this new naming is that obesity starts before type 2 diabetes, and obesity is the most important risk factor for type 2 diabetes increase.1 It is estimated that around 1.5 billion people worldwide are in the grip of overweight and obesity.2 As a result of this serious increase in obesity, it is estimated that 366 million people worldwide affected by the T2DM in 2011 will increase to 552 million by 2030.3
The increasing prevalence of T2DM in children, along with increasing obesity during childhood, has drawn attention to the relationship between obesity and T2DM. Previous studies have emphasised that the most important way to reduce the risk of type 2 diabetes is to prevent obesity.4
Epidemiological studies have shown that the prevalence of obesity and type 2 diabetes mellitus is affected by the race, ethnicity, lifestyle, and socio-economic status. An American study showed that the Alaskans, Native Americans, Asian Americans, Native Hawaiians, Pacific Islanders, non-Hispanic Blacks, and Hispanic adults are at higher risk than non-Hispanic Whites.5 When traditional risk factors such as diet, physical activity, and lifestyle are excluded, genetic diversity and the differences in obesity and type 2 diabetes risk among ethnic populations have led to research on the role of epigenetic factors in diabetes and obesity. Recent studies suggest that the epigenetic factors, particularly DNA methylation, may play a central role in obesity and T2DM.6 Feinberg et al. suggested that the individuals with obesity and T2DM had methylated regions in their DNA analysis; therefore, DNA methylation may play a role in the pathogenesis of obesity and T2DM.7 In addition to epigenetic changes in DNA and histones, RNA methylation has played a critical role in many biological processes, including stem cell regeneration, spermatogenesis, adipogenesis, carcinogenesis, blood sugar regulation, and metabolic diseases.8 Previous studies have shown that m6A methylation on RNA is negatively correlated with fasting blood glucose, and the level of m6A modification in RNAs, isolated from the blood of T2DM patients, is reduced compared to the healthy controls.9,10
The potential relationship between T2DM and obesity and the m6A RNA expression has been mentioned above. Although current studies focus on the relationship between m6A RNA modification and metabolic diseases, the mechanism is still unclear. The aim of this study was to investigate the m6A RNA modification in T2DM and obese individuals with the healthy control group and whether the relationship of m6A content with the mRNA expression levels of FTO and ALKBH5 genes.
METHODOLOGY
This cross-sectional study was conducted at the Internal Medicine Clinic and Department of Family Medicine, Firat University, Medical School, Elazig, Turkey, between January 2019 and January 2022. The open access statistics program i.e. http://biostatapps.inonu.edu.tr/WSSPAS/ip was used to calculate the sample size. The minimum sample size required to detect a significant difference using independent samples; One-Way ANOVA test should be at least 17 in each group, (51 in total), considering type I error (alfa) of 0.05, power (1-beta) of 0.8, and effect size of 0.46. The study included 34 newly diagnosed patients with type 2 diabetes mellitus, 34 obese individuals, and 33 healthy individuals without any chronic and metabolic disease matched for age and gender. Before the study, all the participants were informed about the study. Written consent were obtained from all participants. The study was approved by local Ethics Committee of Firat University Non-invasive Research Ethics Committee (Ethics committee date: 22.11.2018 No. 19/10). Inclusion criteria were: T2DM; obesity; and volunteers over the age of 18 years. Exclusion criteria were: any genetic diseases; pregnancy and lactation; cognitive impairments; autoimmune diseases; systemic infection; terminal illness; malignancy; diabetes type other than T2DM, steroid treatment; and metabolic and endocrine diseases which can affect glucose metabolism.
The diagnoses of Type 2 diabetes mellitus and obesity for the participants, included in the study population, were made by the specialist physicians in charge of the follow-up and treatment of the endocrinological and metabolic diseases in the internal medicine clinic. For the diagnosis of T2DM, It was necessary to have at least one of the following; fasting plasma glucose level ≥126 mg/dl, oral glucose tolerance test 2nd hour plasma glucose level ≥200 mg/dl, glycosylated haemoglobin A (HbA1c) ≥6.5% or random plasma glucose level ≥200 mg/dl accompanying diabetes symptoms.11 Obesity diagnosis and grading were evaluated using the formula “BMI=Weight (Kg)/Height (m2)” based on the body mass index (BMI). BMI ≥30.00 Kg/m2 was taken as a reference for the diagnosis of obesity.12
Demographic characteristics such as age and gender were recorded. Five ml fasting venous blood samples from all the participants were taken for biochemical analysis and 5 ml fasting venous blood samples were taken for RNA methylation analyses. One of the blood samples was sent to the laboratory for the measurement of total cholesterol, triglyceride, LDL, HDL, HbA1c, insulin, and glucose. All the biochemical analyses were analysed in the same laboratory using an automated biochemical analyser (FUJI DRI-CHEM 4000i, Fuji, Japan). Haemoglobin A1c (HbA1c) concentration was measured using the VARIANT II system (Bio-Rad Laboratories, Inc., Hercules, CA, USA). The serum insulin levels were determined using UniCel DxI 800 Access Immunoassay System (Beckman Coulter, Inc., Brea, CA, USA). After measuring the fasting glucose and fasting insulin levels, the researchers calculated insulin resistance for each participant with the formula [HOMA-IR (mg/dl) = Fasting insulin (/mL) × Fasting glucose (mg/dl)/405]. The blood samples taken for RNA methylation analysis were centrifuged and stored at –80°C until the study day. The heights and weights of all the participants were measured and recorded with a regularly calibrated scale and wall-mounted height meter available in the examination room.
RNA was purified by using TRI Reagent (Cat#: T9424, Lot#: BCCB1794, Sigma, St. Louis, MO, USA) from the blood samples according to the standard trizol protocol. The isolated total RNA concentrations were measured by a nanodrop instrument. The samples were stored at -80°C until their use.
Complementary DNA (cDNA) was prepared by using high capacity cDNA synthesis kit with Rnase inhibitor (Cat#: C03-01-20, Lot#: W4F0121-C4, A. B. T., Ankara, TURKEY). According to the kit’s protocol, a run method was as follows: 42 cycles for 60 min at stage 1; 70 cycles for 10 min at stage 2, and 4 cycles at infinity at stage 3.
Complete sequences of ALKBH5, FTO, and METTL3 genes were done using the web address www.ensembl.org. Primers were designed using a free designation program for primers (http://frodo.wi.mit.edu/cgi-bin/primer3/primer3_www.cgi). The nucleotide sequences of the purchased primers (Sentebiolab, Ankara, Turkey) are as follows:
ALKBH5 forward (F) (5-GCCTATTCGGGTGTCGGAAC-3).
ALKBH5 reverse (R) (5-CTGAGGCCGTATGCAGTGAG-3).
FTO forward (F) (5-ACTTGGCTCCCTTATCTGACC-3).
FTO reverse (F) (5′-TGTGCAGTGTGAGAAAGGCTT-3) (Jin, 2020; Zhuo-Xian Rong, 2019). The oligonucleotides in the qRT-PCR experiment were used to perform amplification of the appropriate gene region on human cDNA. GAPDH gene was used as a control. The qRT-PCR process was carried out by using the kit. The qRT-PCR conditions were determined according to the kit’s protocol. The PCR was performed by using 2 μl of cDNA, 2.5 μl 2X Magic SYBR Mix (SKU: PCCSKU1107, PROCOMCURE Biotech GmbH, Thalgau, Salzburg, AUSTRIA), 0.1 μl forward primer (10 μM), and 0.1 μl reverse primer (10 μM), 0.01 μl ROX dye (50X) (Cat#: Q03-02-05/2, Lot#: W2C0221-Q4, A. B. T., Ankara, TURKEY). The total volume was completed with nuclease-free water (Cat#: RT-0, Lot#: 0194844832001, abm, Richmond, BC, Canada) to 5 μl. PCR process was carried out step by step as initial denaturation process at 95°C for 5 min (1 cycle); amplification at 95°C for 10 sec, 55-60°C for 15 sec, 72°C for 20 sec (40 cycles), and final elongation at 60°C for 1 min (1 cycle).
The global m6A RNA methylation level was measured by using the m6A A RNA methylation quantification kit (colorimetric) (ab185912- m6A A, Abcam, Cambridge, UK), following the manufacturer’s protocol. Before the methylation process, RNA samples stored at -80oC are thawed and kept at room temperature for a while. 200 ng RNA (approximately, 1-8 µl of the sample) was added into every single designated well and incubated with the captured antibody solution in a suitable diluted concentration. Absorbance was read on a microplate reader within 2-10 minutes at 450 nm wavelength.
SPSS version 22 package program was used for the statistical analysis. The distribution of continuous data was analysed using the Shapiro-Wilk test. Study data were presented as numbers and percentages for the categorical variables, mean ± tandard deviation for normally distributed continuous variables, and median (Q1-Q3) for non-normally distributed data. Pearson chi-square test was used for the analysis of categorical data. ANOVA test was used for the analysis of normally distributed continuous variables, and the Kruskall-Wallis test was used for the analysis of non-normally distributed variables. Spearman or Pearson correlation analyses were used for the analysis of the relationship among the continuous variables according to the distributions of variables. A p<0.05 was considered statistically significant.
RESULTS
A total of 101 participants, including gender-matched (p = 0.781), 33 healthy controls, 34 obese without any endocrine disorder, and 34 newly diagnosed T2DM patients, were included in the study. The mean age of the obese participants was statistically and significantly lower than the healthy controls and participants with T2DM (p<0.001). The demographic and biochemical parameters of the participants are presented in Table I.
In total, m6A RNA methylation level was studied from 101 RNA samples (33 control, 34 T2DM, and 34 Obese). The median percentages of m6A RNA methylation in the control group, obese, and T2DM participants included in the study were 5.62%, 4.20%, and 5.21%, respectively (p=0.004). The m6A RNA methylation percentage of the obese participants was statistically lower than the control group (p=0.021, Figure 1).
FTO m6A is one of the RNA methylation modifications. In the current study, FTO methylation percentages were 0.02%, 0.075%, and 0.97% in the obese, T2DM, and control groups, respectively, and the difference was statistically significant (p<0.001). The percentage of FTO methylation was found to be statistically and significantly decreased in obese (p=0.001) and T2DM (p=0.002) individuals compared to the control group (Figure 2).
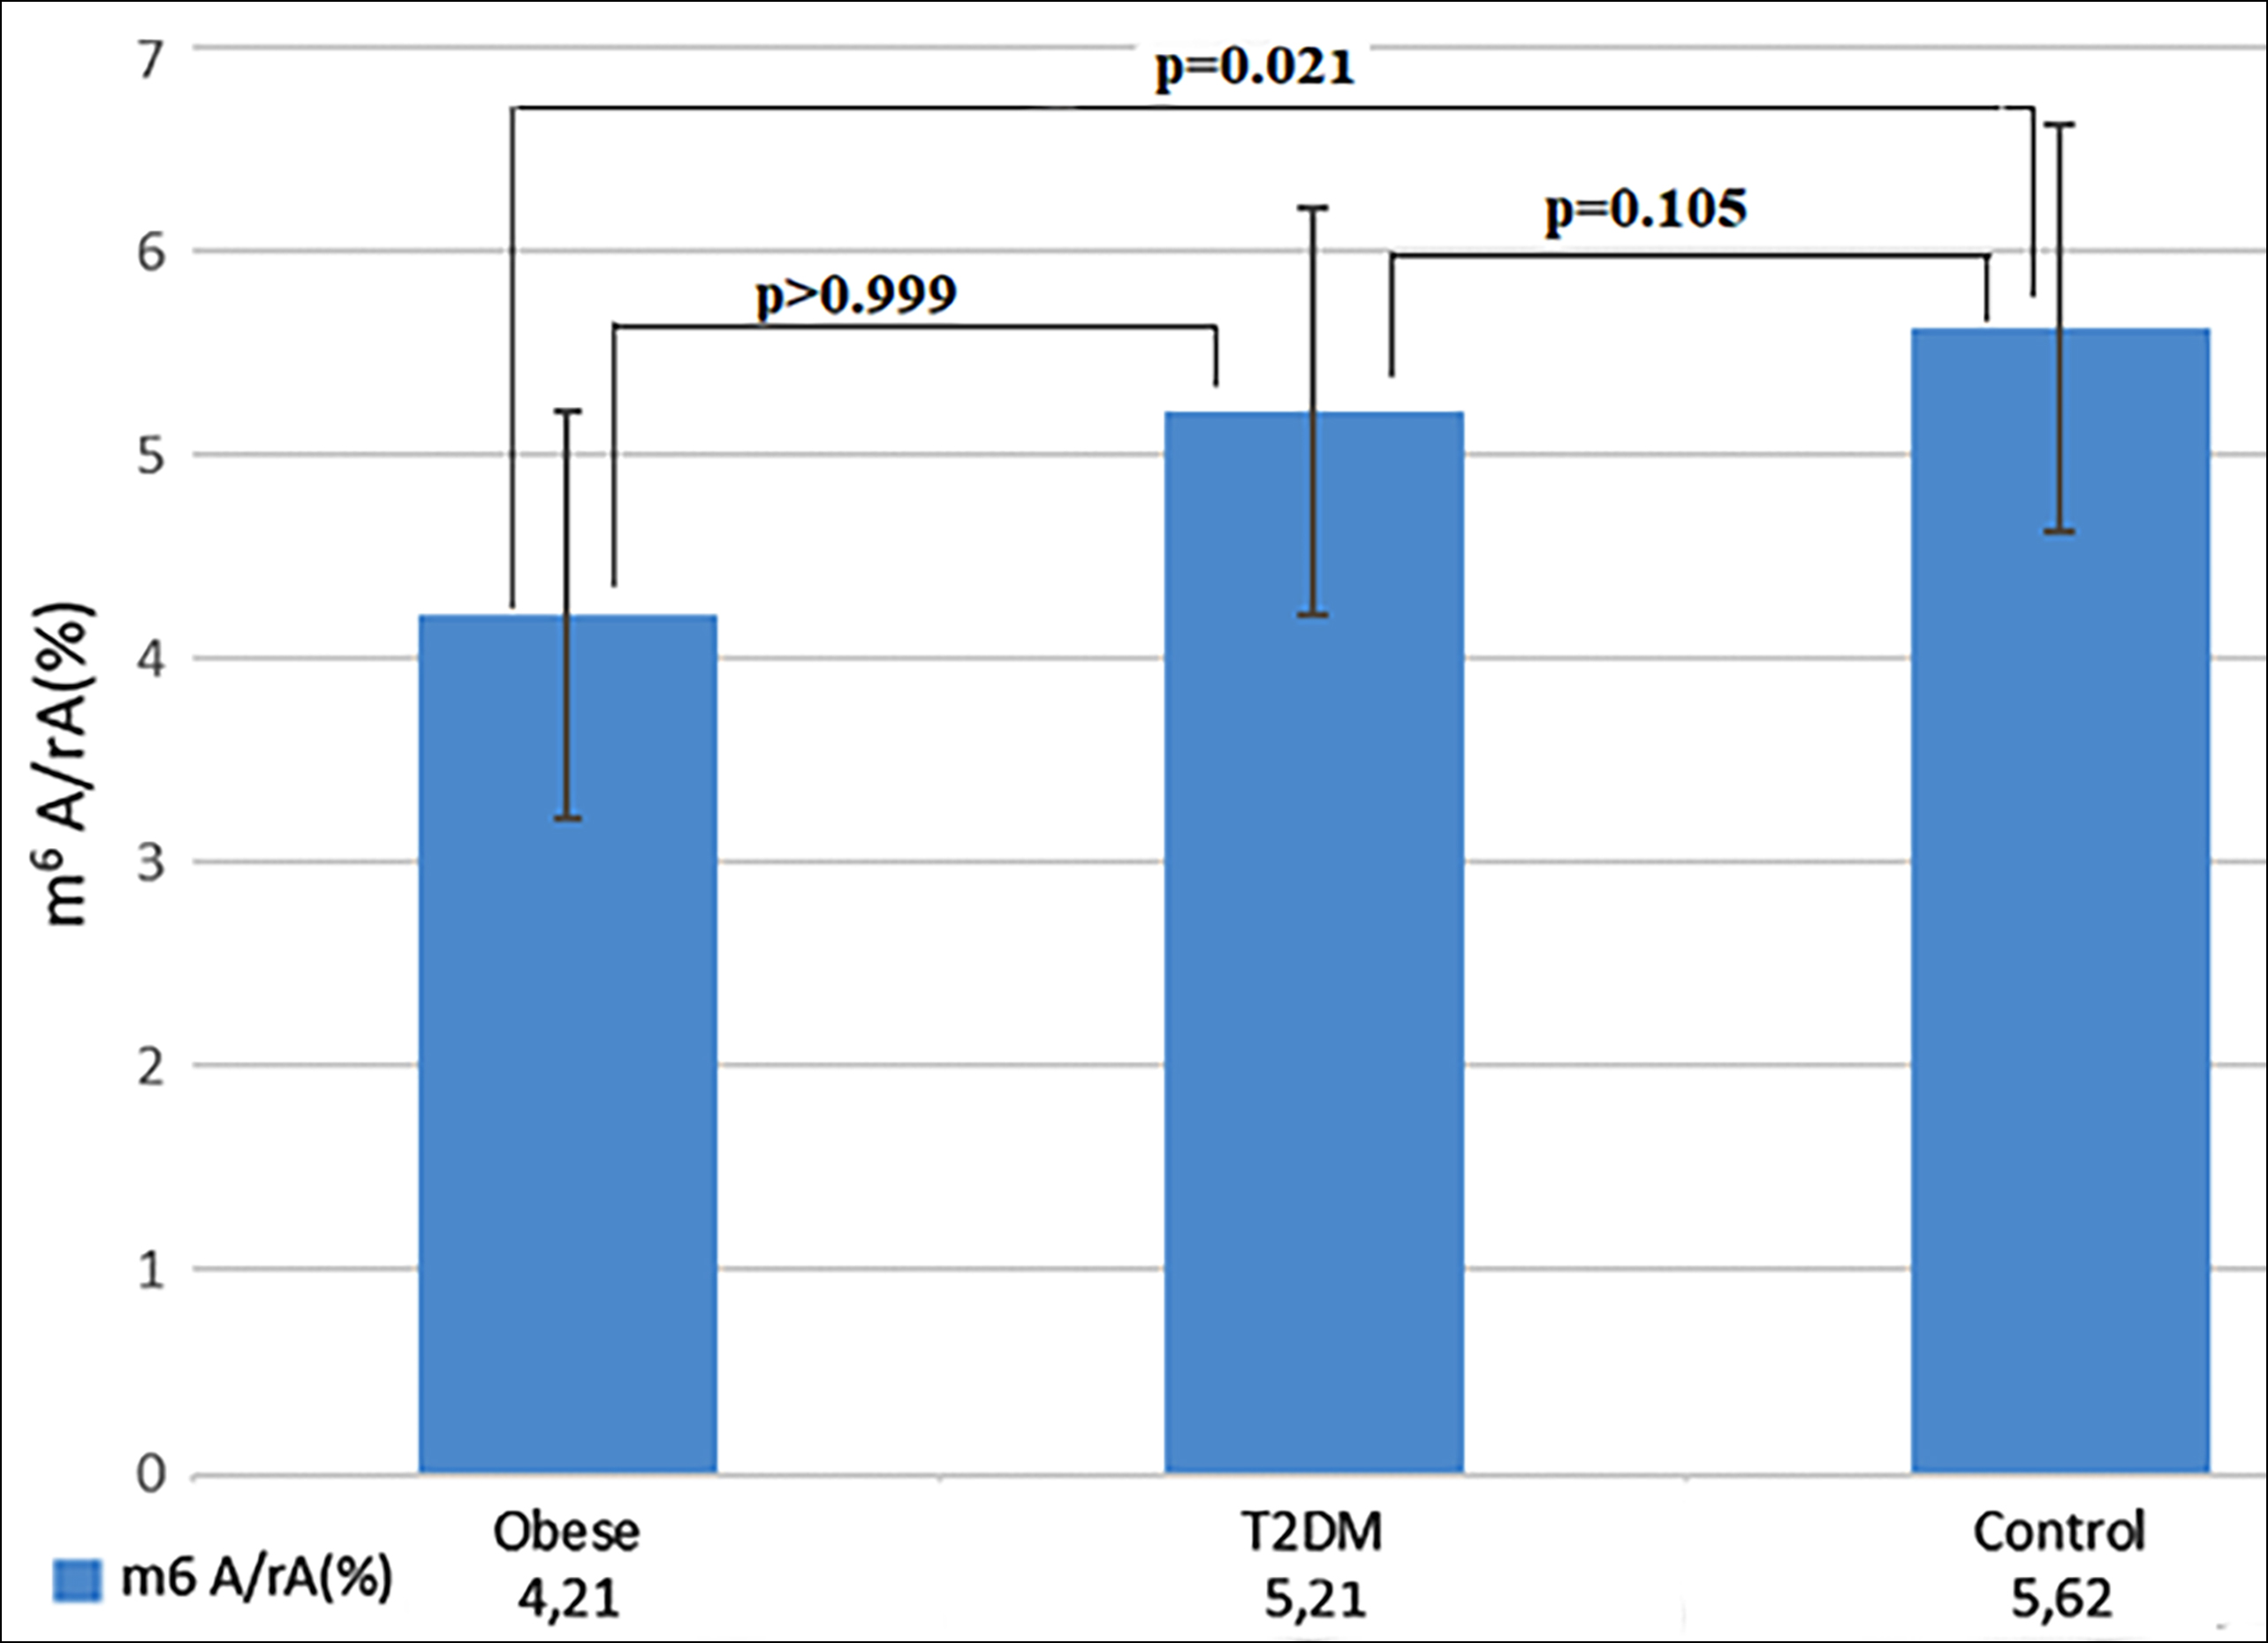 Figure 1: Quantification and statistical analysis of m6A RNA expression. The median contents of m6A RNA expression from obese (n=34), T2DM (n=34), and healty control (n=33). Kruskal- Wallis test was used to assess difference between the groups (p=0.004). Bonferroni post-hoc test was used for pairwise comparisons.
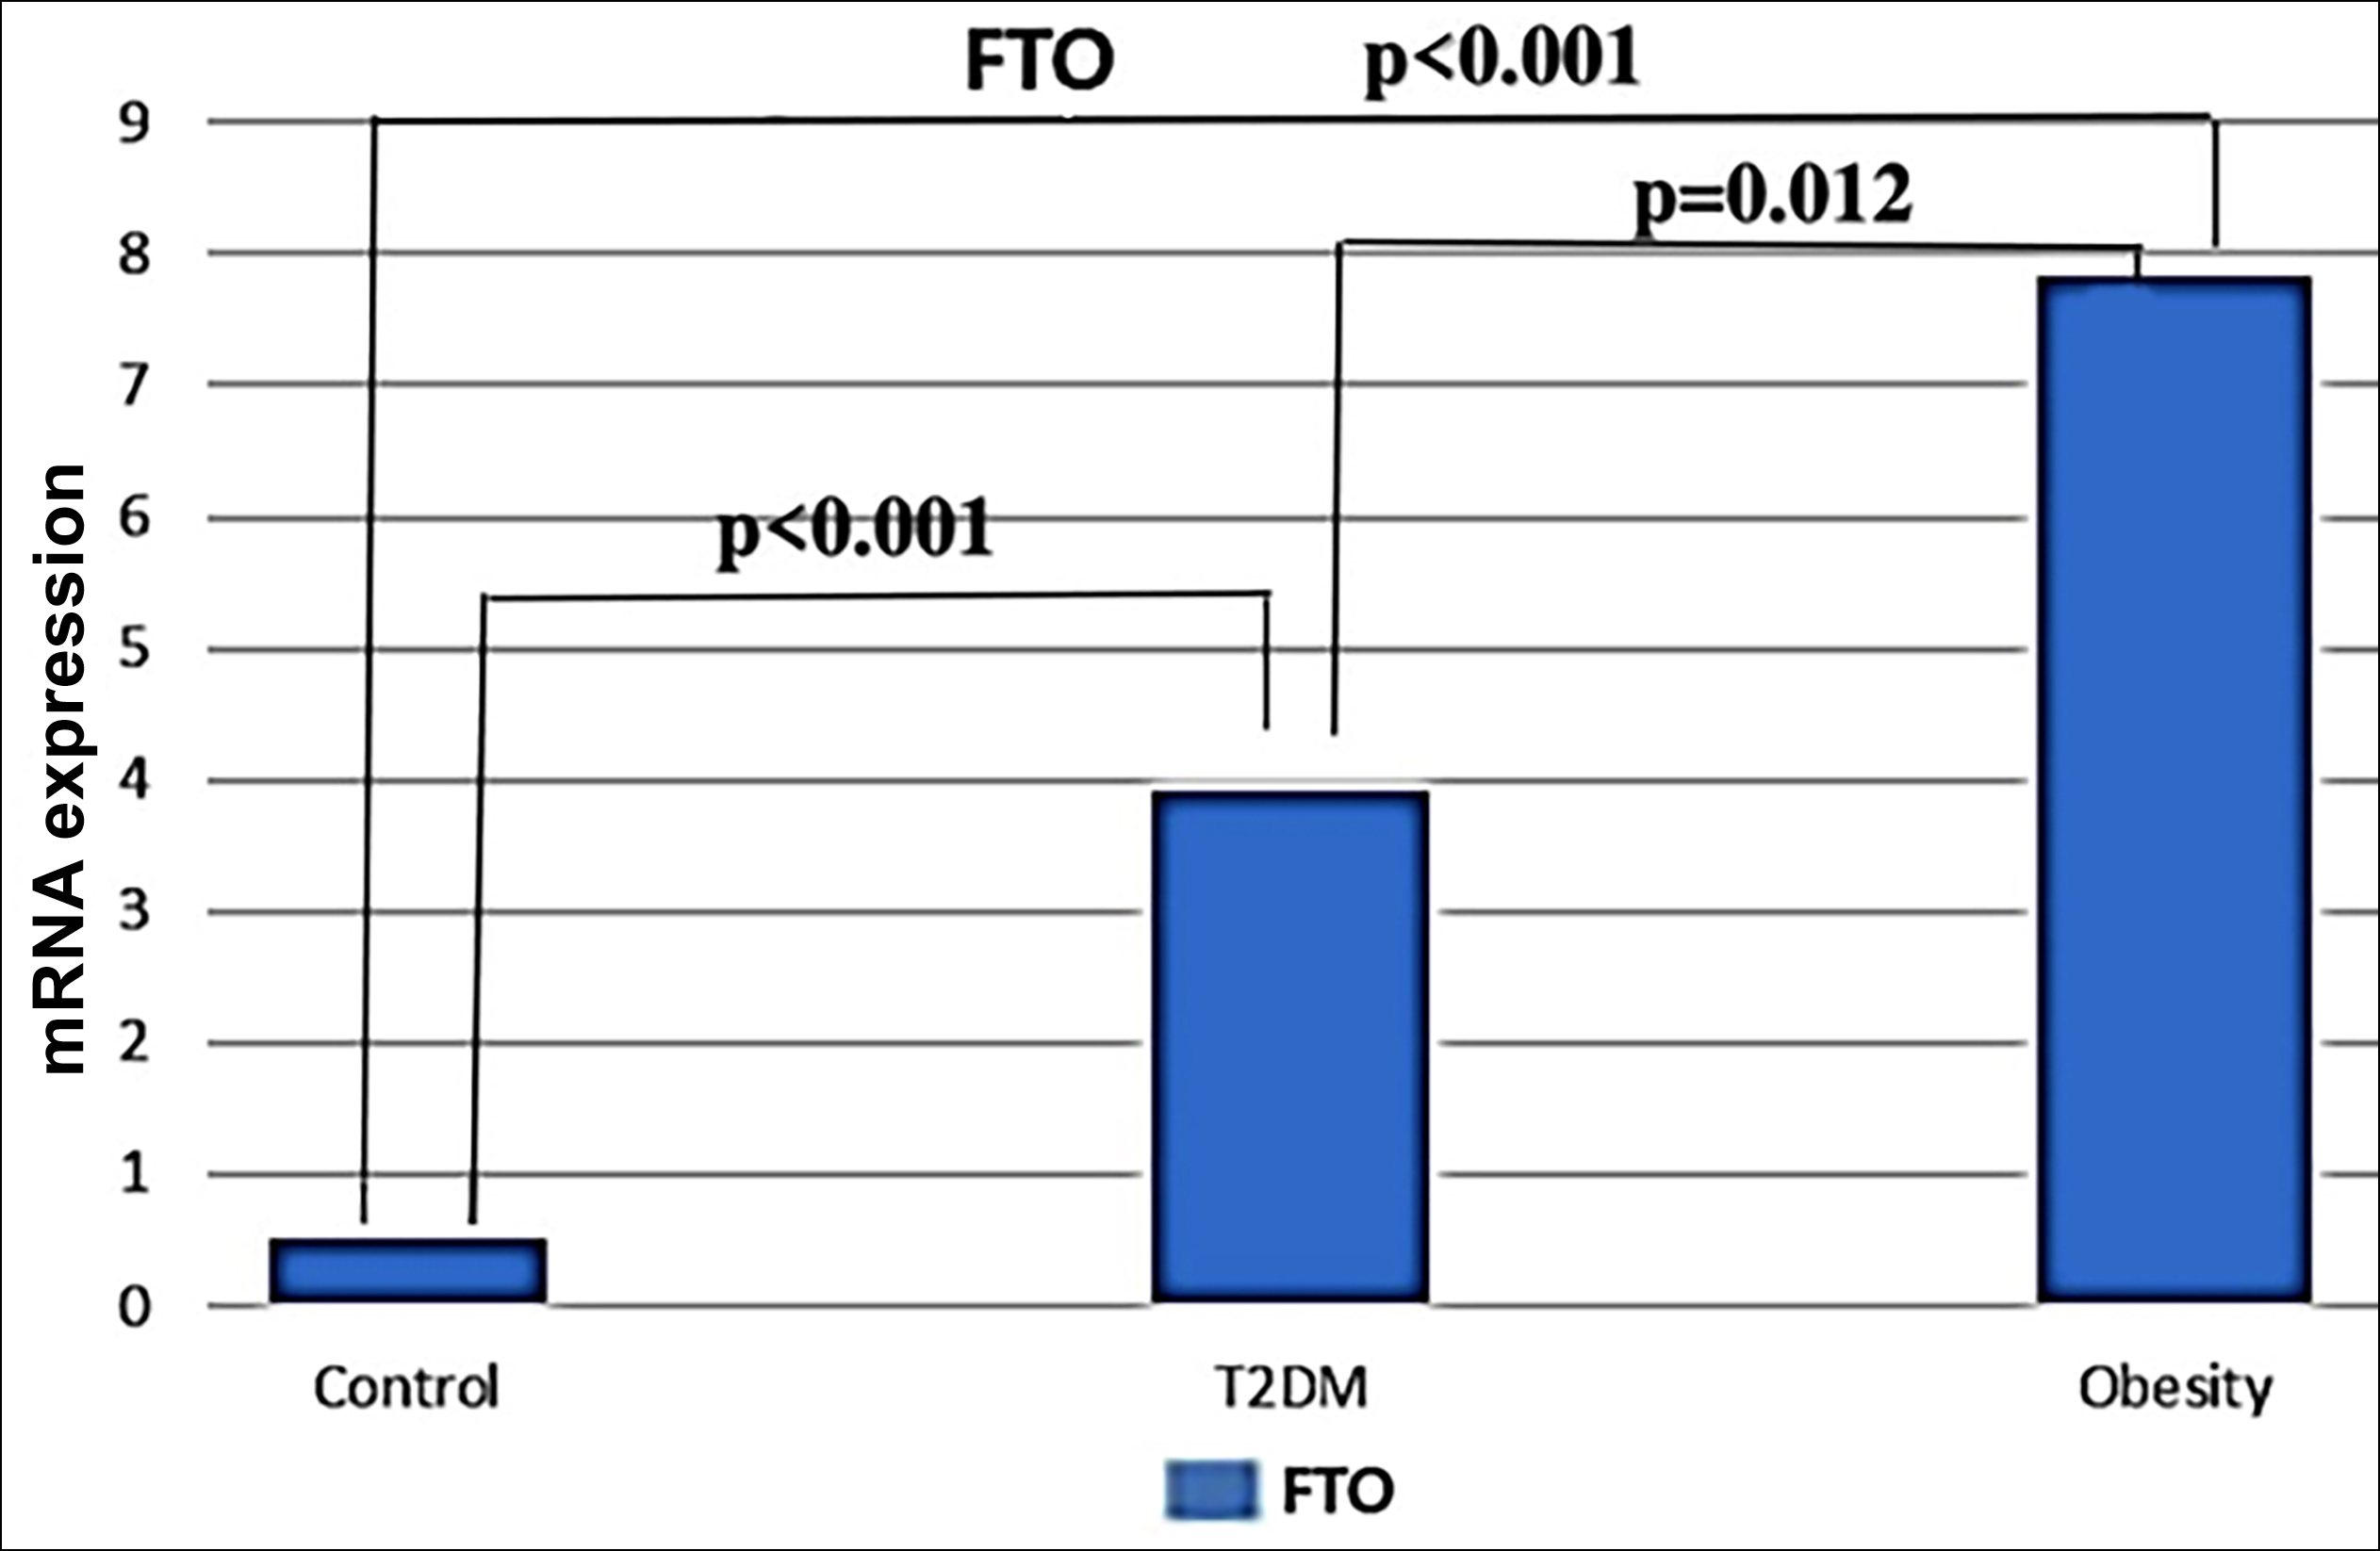 Figure 2: Quantitative real-time PCR analysis of FTO mRNA expression levels. The median contents of FTO mRNA from Obese (n=34), T2DM (n=34), and healty control (n=33). Kruskal- Wallis test was used to assess difference between the groups (p<0.001). Bonferroni post-hoc test was used for the pairwise comparisons.
In the study, ALKBH5 mRNA levels showed statistically significant differences between the groups (p<0.001) and were 0.02%, 0.01%, and 4.45% in the obese, T2DM, and control groups, respectively. ALKBH5 mRNA levels were found to be statistically and significantly lower in obese (p<0.001) and T2DM (p<0.001) participants (Figure 3).
There was a negative significant correlation among the m6A RNA level and triglyceride (r=-0.213, p=0.037), FTO (r=-0.291, p=0.003), and ALKBH5 (r=-0.321. p=0.001) levels. FTO level showed a positive and significant correlation with BMI, Glucose, HbA1c levels, and HOMA score. A positive significant correlation was found between ALKBH5 level and glucose, HbA1c, T cholesterol, LDL, and HOMA scores (Table II).
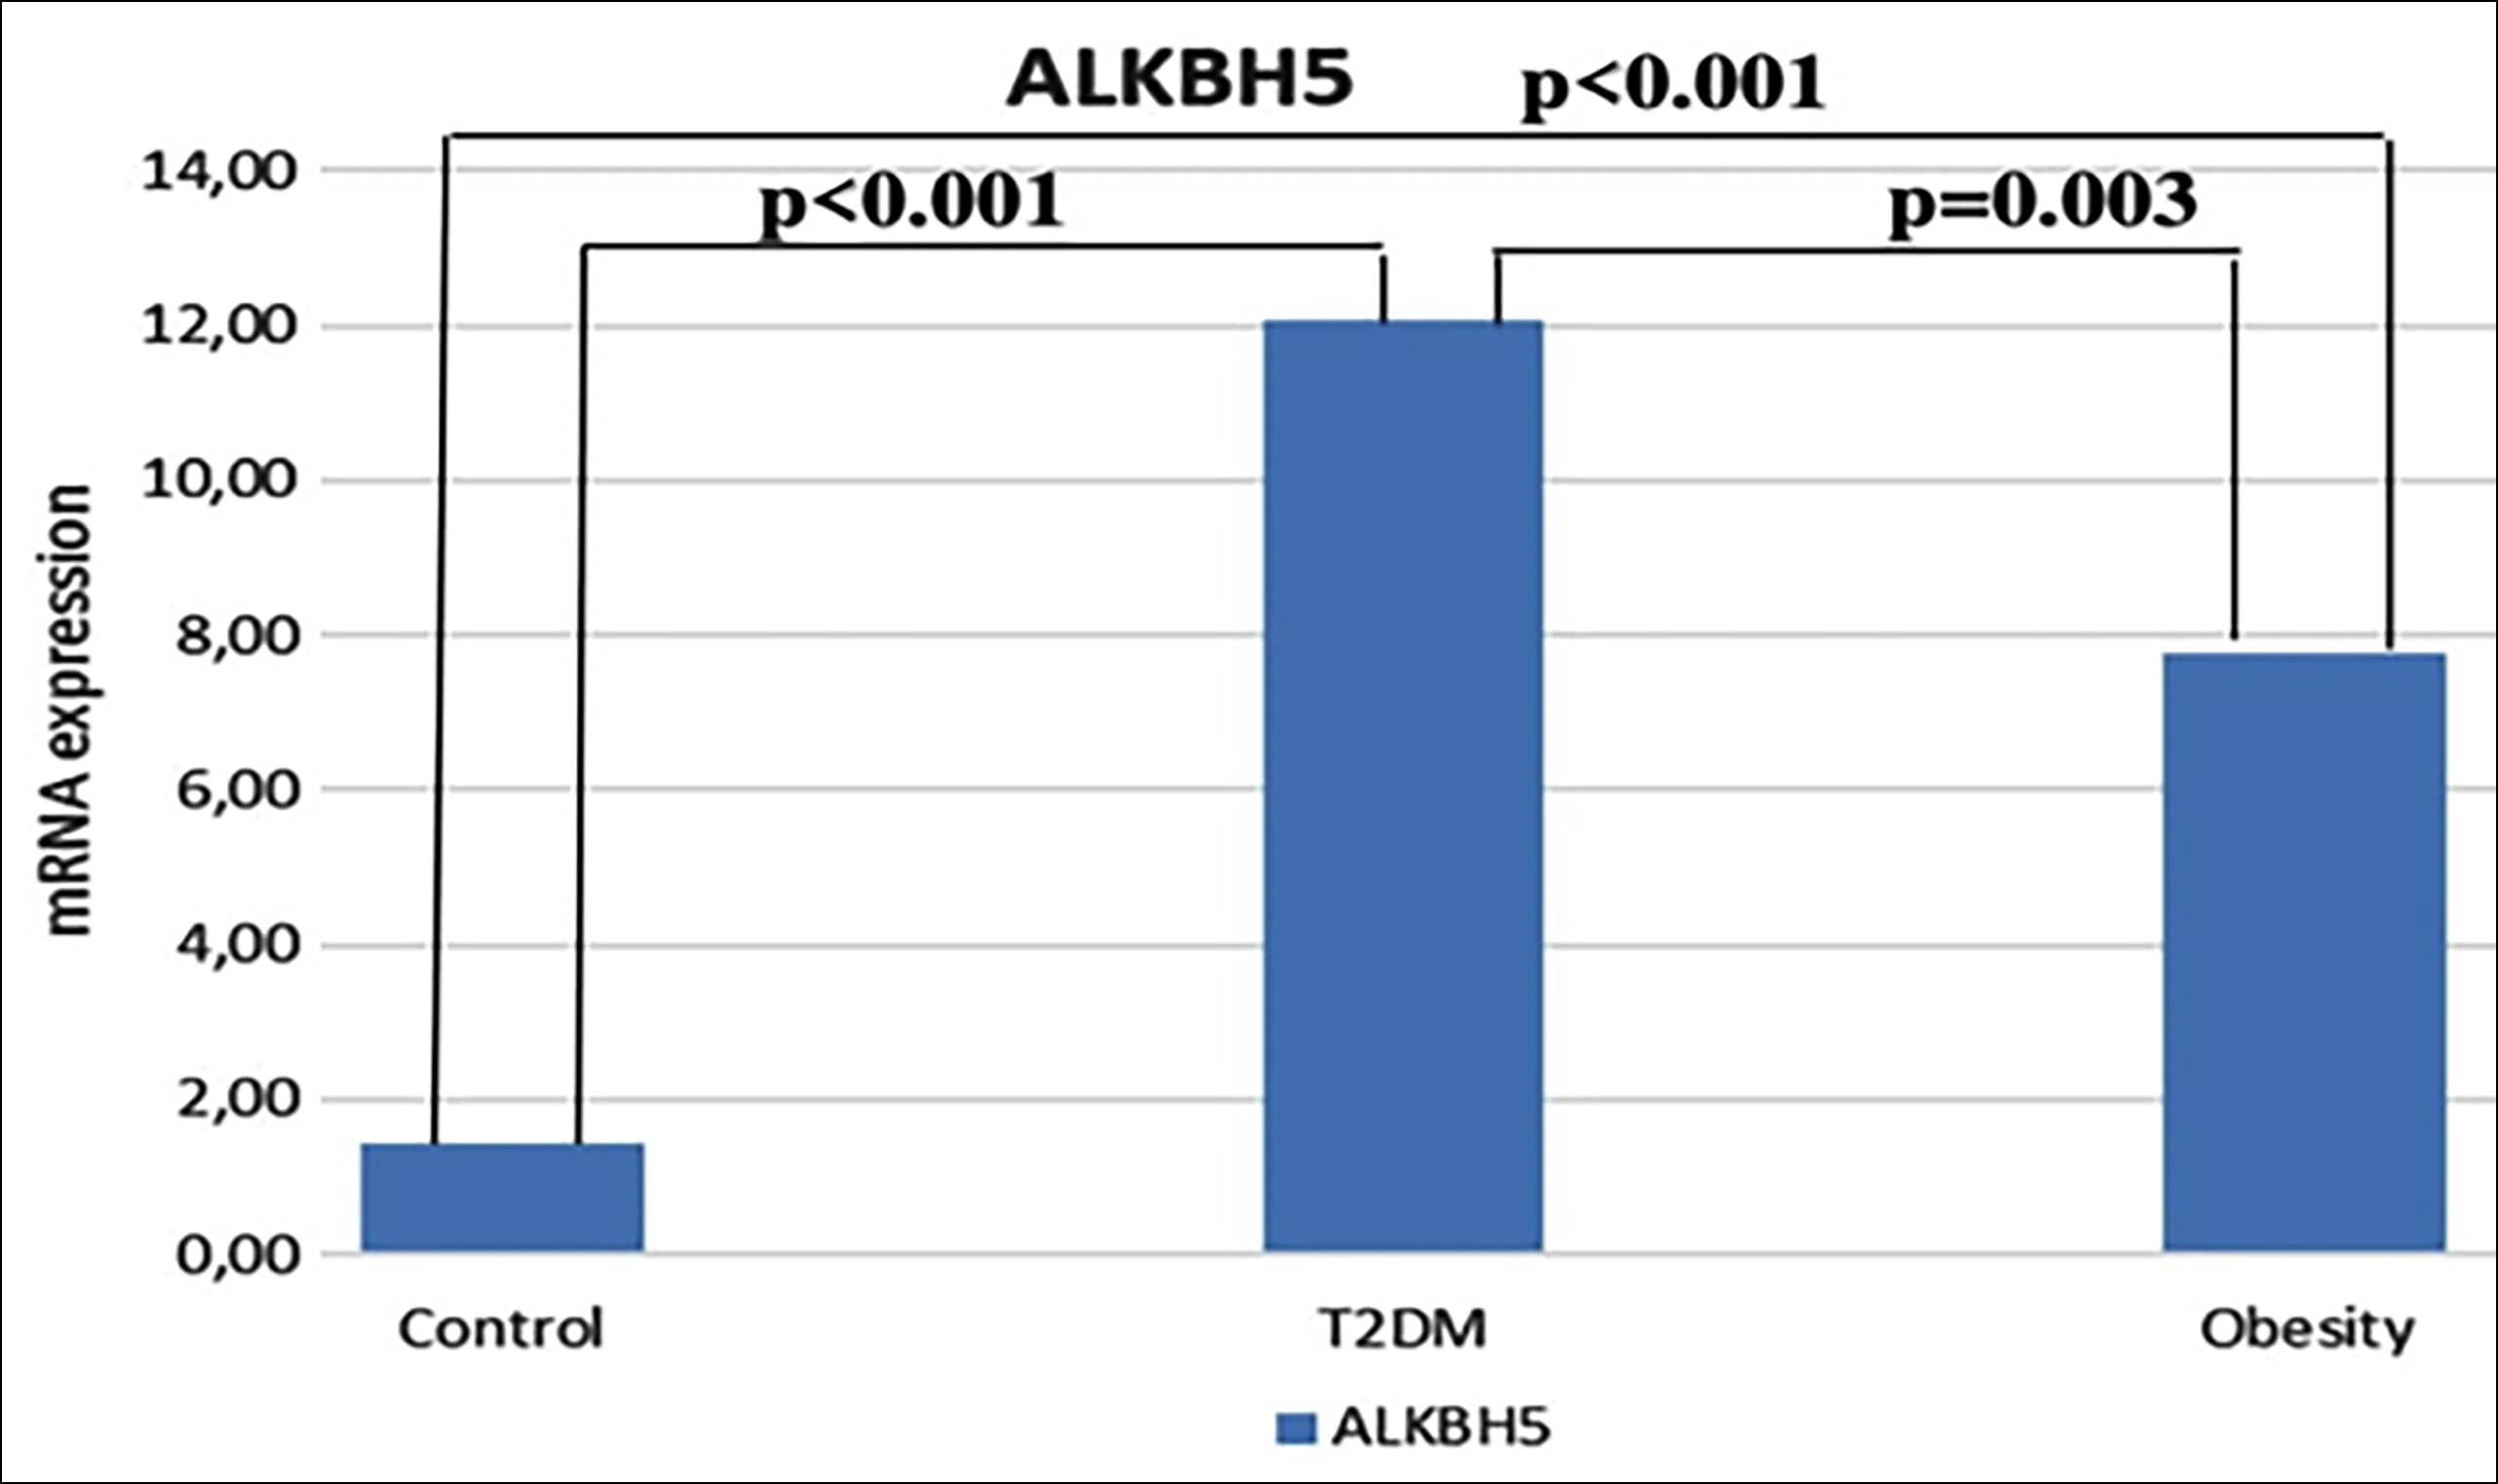 Figure 3: Quantitative real-time PCR analysis of ALKBH5 mRNA expression levels. The median contents of ALKBH5 mRNA from obese (n=34), T2DM (n=34), and healty controls (n=33). Kruskal-Wallis test was used to assess difference between the groups (p<0.001). Bonferroni post-hoc test was used for the pairwise comparisons.
DISCUSSION
The studies on the role of epigenetic factors in the development of obesity and type 2 diabetes mellitus suggest that DNA and RNA methylation may play an epigenetic regulatory role in basic biological processes. Reversible m6A modification on RNA may lead to disturbances in RNA function and may pave the way for endocrine diseases such as obesity and diabetes mellitus.13 Despite this hypothesis, studies investigating the role of RNA methylation in the aetiology of obesity and type2 diabetes mellitus are limited in the literature. The present study firstly showed that m6A RNA methylation median values in obese and diabetic individuals were statistically and significantly decreased compared to the control group. There was no significant difference between the median RNA methylation values of obese and T2DM patients. Borneque et al. reported decreased m6A methylation in pancreatic islet samples from obese and diabetic rats.14 Similarly, it has been reported that m6A methylation is reduced in samples taken from pancreatic islets of diabetic patients.15 Shen et al. reported that m6A methylation decreased in the placentas of obese pregnant women compared to those with normal weight.16 Another study reported that m6A RNA methylation was lower in samples taken from both diabetic humans and rats with diabetes at the same time, compared to the control group.10 In addition to the data mentioned above, Wang et al. reported that m6A levels were significantly decreased in Gestational diabetes mellitus.17 The present results and the previous literature data suggested that m6A RNA methylation was decreased in diabetic and obese individuals and might play a role in etiopathogenesis.
In the current study, the relationship between the expression of ALKBH5 and FTO, which are the main genes that play a role in m6A methylation modification, with the diabetes and obesity was investigated. It was found that the expression of ALKBH5 and FTO in peripheral blood taken from the diabetic and obese patients was statistically higher than in the control group.
A previous study suggest that increased FTO expression causes increased BMI and obesity, and subsequently, plays an important role in the initiation and progression of T2DM.18 Similar studies in the literature have shown that FTO expression is increased in obese and T2DM.10,19
It has been reported that ALKBH5, another RNA demethylase, causes a decrease in m6A RNA level and causes similar effects with FTO.9 Shen et al. reported that FTO expression increased in diabetic patients compared to the healthy controls, but there was no significant difference in the ALKBH5 levels.10 Although FTO and ALKBH5 are known as RNA methylases and have similar effects, there is very little research on examining the level of ALKBH5 in obesity and T2DM. The literature searches have focused more on FTO in the aetiology of metabolic diseases. In the current study, the authors found both FTO and ALKBH5 levels increased in the obese and diabetic patients. The increased ALKBH5 level in obesity and T2DM in the current study is inconsistent with the findings of Shen et al.10
Duman et al. reported that FTO levels did not differ between obese and morbidly-obese, and their data were not sufficient to illuminate the role of FTO in the obesity.20
Another study had reported that both FTO and ALKBH5 levels decreased in patients with rheumatoid arthritis and these two demethylases might play a role in the etiopathogenesis of rheumatoid arthritis.21 The present data and the literature findings suggest that new studies with large samples are needed to elucidate the role of FTO and ALKBH5 levels in diabetes and obesity.
The current study showed a negatively significant correlation between m6A RNA methylation levels and FTO and ALKBH5 levels. Previous studies reported that the increase of demethylases (FTO and ALKBH5) may cause a decrease in m6A RNA expression and thus obesity.22 Shen et al. reported that increased FTO caused a decrease in m6A RNA expression, but there was no significant relationship between ALKBH5 and m6A RNA expression.10 In a recent study, it was reported that FTO and ALKBH5 affected m6A RNA levels, similar to this study findings.23 In the current study, there was a positive significant correlation between FTO and ALKBH5 levels and metabolic parameters (BMI, glucose, HbA1c, Cholesterol, and LDL). In particular, a positive significant correlation was found between FTO and BMI. Previous studies have reported that the FTO plays an important role in the formation and progression of T2DM by causing an increase in BMI values and obesity.18 In addition, studies in the literature have reported that FTO and ALKBH5 negatively affected diabetes by affecting energy metabolism.24,25 Wang et al. reported that FTO protein level was significantly associated with waist circumference, hip circumference, BMI and blood sugar indices (FPG, FCP, HbA1c).17 In the same study, it was shown that the FTO expression levels were significantly reduced in the diabetic patients whose blood sugar regulation was achieved within 12 weeks of treatment. This data were compatible with the literature data, and it was shown that BMI, glucose, and HbA1c levels increased especially with the increase of FTO level.
Table I: Clinical and demographic characteristics of the participants.|
Characteristics |
Control (n=33) |
Obese (n=34) |
T2DM (n=34) |
p-value |
|
Gender (F/M) |
22 (66.7) / 11 (33.3) |
21 (62.8) / 13 (37.3) |
23 (67.6) / 11 (32.4) |
0.781a |
|
Age(years) mean±SD |
50.77±12.51 |
38.73±10.21* |
52.56±12.98 |
<0.001b |
|
BMI(Kg/m2) mean±SD |
23.53 (23.55-28.48) |
41.50 (38.21-46.46)* |
29.50 (25.70-33.75)* |
0.004c |
|
T-Cholesterol (mg/dL) |
171.50±32.32 |
198.89±40.07* |
197.85±38.46* |
0.004b |
|
LDL(mg/dL) |
103.49±25.83 |
128.59±35.94* |
127.06±37.56* |
<0.001b |
|
Triglyceride(mg/dL) |
110.50 (90.75-138.25) |
155.50 (113.25-207.25)* |
161.50 (106.75-238.50)* |
0.004c |
|
FBG (mg/dL) |
92.50 (89.00-97.25) |
105.00 (101.50-109.50) |
128.00 (113.00-191.75)* |
<0.001c |
|
HbA1c (%) |
5.25 (5.08-5.50) |
5.80 (5.60-6.05) |
6.95 (6.30-9.50)* |
<0.001c |
|
HOMA_IR(mg/dl) |
1.47 (1.17-1.79) |
4.54 (3.38-6.61) |
5.69 (2.44-15.18)* |
<0.001c |
|
a Pearson’s chi-square test, b ANOVA test, c Kruskal-Wallis test, * Cases of statistical significance in pairwise comparison with the control group. |
||||
Table II: Correlation between m6A RNA and continuous variables.
|
Characteristic |
m6A RNA |
FTO |
ALKBH5 |
|
BMI(Kg/m2) mean±SD |
r=-0.903, p=0.353 |
r=0.401, p<0.001 |
r=0.183, p=0.067 |
|
FBG (mg/dL) |
r=-0.151, p=0.139 |
r=0.449. p<0.001 |
r=0.576, p<0.001 |
|
HbA1c (%) |
r=-0.154, p=0.132 |
r=0.363, p<0.001 |
r=0.610, p<0.001 |
|
T-Cholesterol (mg/dL) |
r=-0.125, p=0.223 |
r=0.185, p=0.069 |
r=0.343, p<0.001 |
|
LDL (mg/dL) |
r=-0.082, p=0.425 |
r=0.165, p=0.107 |
r=0.222, p=0.029 |
|
Triglyceride (mg/dL) |
r=-0.213, p=0.037 |
r=0.164, p=0.110 |
r=0.111, p=0.280 |
|
HOMA_IR(mg/dl) |
r=-0.156, p=0.126 |
r=0.447, p<0.001 |
r=0.431, p<0.001 |
|
FTO |
r=-0.291, p=0.003 |
|
|
|
ALKBH5 |
r=-0.321. p=0.001 |
|
|
The present study has some limitations including individuals diagnosed with the diabetes and obesity may be insufficient to explain the effects of m6A RNA, FTO and ALKBH5 on the formation of diabetes and obesity. In addition, although individuals with newly diagnosed diabetes are included in the study, ignoring the years spent on both diabetes and obesity may affect the results. However, the absence of any other study in the literature investigating m6A RNA, FTO and ALKBH5 levels in both obesity and diabetic populations may be the strength of this research. These findings can be evaluated with the future studies on larger populations.
CONCLUSION
In the current study, m6A RNA expression decreased and FTO and ALKBH5 levels increased when diabetic and obese individuals were compared with the healthy control group. Decreased m6A RNA expression correlated negatively with the increased FTO and ALKBH5. Diabetes and obesity parameters such as BMI, glucose, and HbA1c were positively correlated with the increase in FTO and ALKBH5. As a result, while m6A RNA expression decreased in diabetes and obesity, FTO and ALKBH5 expressions were increased. Increased expression of FTO and ALKBH5 may play a role in the pathogenesis of obesity and subsequent diabetes mellitus.
ETHICAL APPROVAL:
The study was approved by the local Ethics Committee of Firat University Non-invasive Research Ethics Committee. (Ethics committee date: 22.11.2018 No. 19/10).
PATIENTS’ CONSENT:
The informed consents were obtained from all the patients.
COMPETING INTEREST:
The authors declared no competing interest.
AUTHORS’ CONTRIBUTION:
EO, KK, BY, EEO: Study conception and design.
KK, EEO, TK, ED: Acquisition of data.
EO, BY, EEO: Analysis and interpretation of data.
ED, BY, EEO: Drafting of the manuscript.
EO, BY, KK, EEO, TK, ED: Critical revision.
All the authors have approved the final version of the manuscript to be published.
REFERENCES
- Toplak H, Leitner DR, Harreiter J, Hoppichler F, Wascher TC, Schindler K, et al. Diabesity – adipositas und Typ-2-diabetes (Update 2019). Wien Klin Wochenschr 2019; 131(1):71-6. doi.org/10.1007/s00508-018-1418-9.
- Hruby A, Manson JE, Qi L, Malik VS, Rimm EB, Sun Q, et al. Determinants and consequences of obesity. Am J Public Health 2016; 106(9):1656-62. doi.org/10.2105/ajph.2016. 303326.
- Whiting DR, Guariguata L, Weil C, Shaw J. IDF diabetes atlas: Global estimates of the prevalence of diabetes for 2011 and 2030. Diabetes Res Clin Pract 2011; 94(3): 311-21. doi.org/10.1016/j.diabres.2011.10.0297.
- Lee J, Kim JH. Endocrine comorbidities of pediatric obesity. Clin Exp Pediatr 2021; 64(12):619-27. doi.org/10.3345/ cep.2021.00213.
- Bullard KM, Cowie CC, Lessem SE, Saydah SH, Menke A, Geiss LS, et al. Prevalence of diagnosed diabetes in adults by diabetes Type - United States, 2016. MMWR Morb Mortal Wkly Rep 2018; 67(12):359-61. doi.org/10.15585/mmwr.m m6A 712a2.
- Loh M, Zhou L, Ng HK, Chambers JC. Epigenetic disturbances in obesity and diabetes : Epidemiological and functional insights. Mol Metab 2019; 27S(Suppl):33-41. dx.doi.org/10.1016%2Fj.molmet.2019.06.011.
- Feinberg AP, Irizarry RA, Fradin D, Aryee MJ, Murakami P, Aspelund T, et al. Personalised epigenomic signatures that are stable over time and covary with body mass index. Sci Transl Med 2010; 2(49):49ra67. doi.org/10.1126/ scitranslmed.3001262.
- Niu Y, Zhao X, Wu YS, Li MM, Wang XJ, Yang YG. N6-methyl-adenosine (m6A) in RNA: An old modification with a novel epigenetic function. Genomics Proteomics Bioinformatics 2013; 11(1):8-17. oi.org/10.1016/j.gpb.2012.12.002.
- Zhong H, Tang HF, Kai Y. N6-methyladenine RNA Modification (m6A): An emerging regulator of metabolic diseases. Current Drug Targets 2020; 21(11):1056-67. doi.org/10. 2174/1389450121666200210125247.
- Shen F, Huang W, Huang JT, Xiong J, Yang Y, Wu K, et al. Decreased N(6)-methyladenosine in peripheral blood RNA from diabetic patients is associated with FTO expression rather than ALKBH5. J Clin Endocrinol Metab 2015; 100(1):E148-54. doi.org/10.1210/jc.2014-1893.
- American diabetes association. 2. Classification and diagnosis of diabetes: Standards of medical care in diabetes -2020. Diabetes Care 2020; 43(Suppl1):14-31. doi.org/10. 2337/dc20-s002.
- World health organisation. Obesity and overweight. [cited 2022 15 February]. Available from: www.who.int/news- room/fact-sheets/detail/obesity-and-overweight.
- Jia G, Fu Y, He C. Reversible RNA adenosine methylation in biological regulation. Trends Genet 2013; 29(2):108-15. doi.org/10.1016/j.tig.2012.11.003.
- Bornaque F, Delannoy CP, Courty E, Rabhi N, Carney C, Rolland L, et al. Glucose regulates m6A methylation of RNA in pancreatic Islets. Cells 2022; 11(2):291. doi.org/10. 3390/cells11020291.
- Yang Y, Shen F, Huang W, Qin S, Huang JT, Sergi C, et al. Glucose ıs ınvolved in the dynamic regulation of m6A A in patients with Type 2 diabetes. J Clin Endocrinol Metab 2019; 104(3):665-73. doi.org/10.1210/jc.2018-00619.
- Shen WB, Ni J, Yao R, Goetzinger KR, Harman C, Reece EA, et al. Maternal obesity increases DNA methylation and decreases RNA methylation in the human placenta. Reprod Toxicol 2022; 107:90-6. doi.org/10.1016/j.reprotox.2021. 12.002.
- Wang J, Wang K, Liu W, Cai Y, Jin H. m6A mRNA methylation regulates the development of gestational diabetes mellitus in Han Chinese women. Genomics 2021; 113(3):1048-56. doi.org/10.1016/j.ygeno.2021.02.016.
- Freathy RM, Timpson NJ, Lawlor DA, Pouta A, Ben-Shlomo Y, Ruokonen A, et al. Common variation in the FTO gene alters diabetes -related metabolic traits to the extent expected given its effect on BMI. Diabetes 2008; 57(5): 1419-26. doi.org/10.2337/db07-1466.
- Wang Q, Wang J, Lin H, Huo X, Zhu Q, Zhang M. Relationship between fat mass and obesity-associated gene expression and type 2 diabetes mellitus severity. Exp Ther Med 2018; 15(3):2917-21. doi.org/10.3892/etm. 2018.5752.
- Susleyici-Duman B, Zengin K, Kayhan FE, Koldemir M, Dagistanli FK, Cagatay P, et al. FTO mRNA expression in extremely obese and type 2 diabetic human omental and subcutaneous adipose tissues. Obes Surg 2011; 21(11):1766-73. doi.org/10.1007/s11695-011-0446-6.
- Luo Q, Gao Y, Zhang L, Rao J, Guo Y, Huang Z, et al. Decreased ALKBH5, FTO, and YTHDF2 in peripheral blood are as risk factors for rheumatoid arthritis. Biomed Res Int 2020; 2020:5735279. doi.org/10.1155/2020/5735279.
- Church C, Moir L, McMurray F, Girard C, Banks GT, Teboul L, et al. Overexpression of Fto leads to increased food intake and results in obesity. Nat Genet 2010; 42(12):1086-92. doi.org/10.1038/ng.713.
- Kim J, Lee G. Metabolic control of m6A RNA modification. Metabolites 2021; 11(2):80. doi.org/10.3390/metabo 11020080.
- Speakman JR, Rance KA, Johnstone AM. Polymorphisms of the FTO gene are associated with variation in energy intake, but not energy expenditure. Obesity (Silver Spring) 2008; 16(8):1961-5. doi.org/10.1038/oby.2008.318.
- Wahlen K, Sjolin E, Hoffstedt J. The common rs9939609 gene variant of the fat mass- and obesity-associated gene FTO is related to fat cell lipolysis. J Lipid Res 2008; 49(3):607-11. doi.org/10.1194/jlr.m700448-jlr200.