Low HDL-C and the Risk of Hospitalisation in Children with COVID-19
By Nurhan Kasap1, Onur Incealtin2, Velat Celik3, Mehmet Agirbasli4Affiliations
doi: 10.29271/jcpsp.2024.04.451ABSTRACT
Objective: To investigate high-density lipoprotein cholesterol (HDL-C) levels in children with COVID-19.
Study Design: Descriptive study.
Place and Duration of the Study: Goztepe Professor Suleyman Yalcin City Hospital, Istanbul, Turkiye, between 2020 and 2022.
Methodology: The hospital data were examined to find children (<18 years) who presented with COVID-19. The associations between HDL-C, inflammatory biomarkers, hospital admission requirements, and prolonged hospital stays in children with COVID-19 were analysed.
Results: During the study period, 1,056 children were diagnosed with COVID-19. Lipid levels were measured in 193 patients during outpatient clinic visits from the same hospital records. One hundred and twenty-seven (65.5%) patients displayed low HDL-C levels. One hundred and nine (86.5%) of the patients with low HDL-C and 33 (50.0%) of the patients with normal HDL-C were hospitalised (p=0.012). Patients with lower HDL-C exhibited higher triglyceride (median 124 vs. 81 mg/dl, p<0.001), glucose (median 116 vs. 101 mg/dl, p=0.001), lactate dehydrogenase (LDH) (median 343 vs. 251 mg/dl, p<0.001), C-reactive protein (CRP) (median 0.6 vs. 0.5 mg/L, p=0.009), D-dimer (median 1.3 vs. 0.3 mcg/mL, p<0.001), ferritin (median 127 vs. 40 µg/L, p<0.001), and uric acid (median 5.5 vs. 4.5 mg/dL, p=0.002) levels compared to children with normal HDL-C. Logistic regression (LR) analysis showed that age (OR = 0.87, CI for OR 0.80-0.94, p < 0.001), ferritin (OR = 1.004, CI for OR 1.001-1.006, p = 0.003), and D-dimer (OR = 2.171, CI for OR 1.183-3.984, p = 0.012) were associated with lower HDL-C level in children with COVID-19.
Conclusion: Low HDL-C levels were common in children with COVID-19. Children with COVID-19 and low HDL-C were more frequently hospitalised and had higher inflammatory biomarkers of COVID-19 than children with COVID-19 and normal HDL-C levels.
Key Words: HDL-C, HDL-C levels in children, COVID-19, Children with COVID-19.
INTRODUCTION
The coronavirus disease 2019 (COVID-19) is a result of the Severe Acute Respiratory Syndrome Coronavirus 2 (SARS-CoV-2) infection. Global reports from more than 80 countries reported that COVID-19 did not cause excess mortality among children.1 However, caution is needed that the available COVID-19 data disproportionally represents high-income countries. The COVID-19 outcomes in developing countries are underrepresented in the literature. Poor health services, populational differences, and lack of immunisation can confound the mortality and morbidity from COVID-19 in children. In Turkiye, from 44 intensive care units, 335 childhood mortality has been reported in chıldren.2 The predictors of poor prognosis and death from COVID-19 in children remain obscure.
The COVID-19 pandemic in children has often been asympto-matic or mildly symptomatic. However, there have been reports of severe COVID-19 cases in children.3 Patients under 21 are diagnosed with multisystemic inflammatory syndrome (MIS-C). MIS-C is characterised by severely elevated fever even before the onset of symptoms and elevated biomarkers of inflamma-tion.4
Various studies in adults examine changes in the lipid profile during SARS-CoV-2 infection. Reports indicate that reduced high-density lipoprotein cholesterol (HDL-C) levels correlate with a worse prognosis.5 Apolipoprotein A1 (apo A1), a component of HDL-C, is also known to be antithrombotic. In a large case-control study, Morelli et al. observed that the probability of venous thrombosis was significantly increased with low HDL-C and LDL levels.6 Low HDL-C and LDL levels have been related to disease severity and progression7 and increased hospital stay.8 Wang et al. reported that HDL-C was significantly lower among those who developed severe events in a cohort of 228 adult COVID-19 patients.7 However, the causes of COVID-19 disease severity in children differ from adults. Challenges exist in studying HDL-C levels in children. First, 'normal' levels of HDL-C in children are population, gender, and age-specific. Ethnic differences exist. Secondly, percentile nomograms are only available for some world populations. Thirdly, the regional endemic of low HDL-C has been reported in countries and regions such as Turkiye.9
This study discusses the HDL-C levels in children with COVID-19 from a large COVID-19 centre in Turkiye. The objective of the study was to examine the association between HDL-C levels and COVID-19 outcomes in children.
METHODOLOGY
This research was performed at the Goztepe Professor Suleyman Yalcin City Hospital after obtaining approval from the institutional review board (IRB) with the protocol number 2022/0156. Paediatric patients under the age of 18 years, who visted the hospital between 2020 and 2022 and were diagnosed with COVID-19 infection, were retrospectively identified from hospital records. HDL-C levels of 193 patients were obtained during outpatient clinic visits within their COVID-19 infection period. Out of these patients, 66 exhibited normal HDL-C levels, while 127 had low HDL-C levels, as defined by the National Heart Lung and Blood Institute Growth and Health Study (NGHS) paediatric guidelines (Figure 1).10
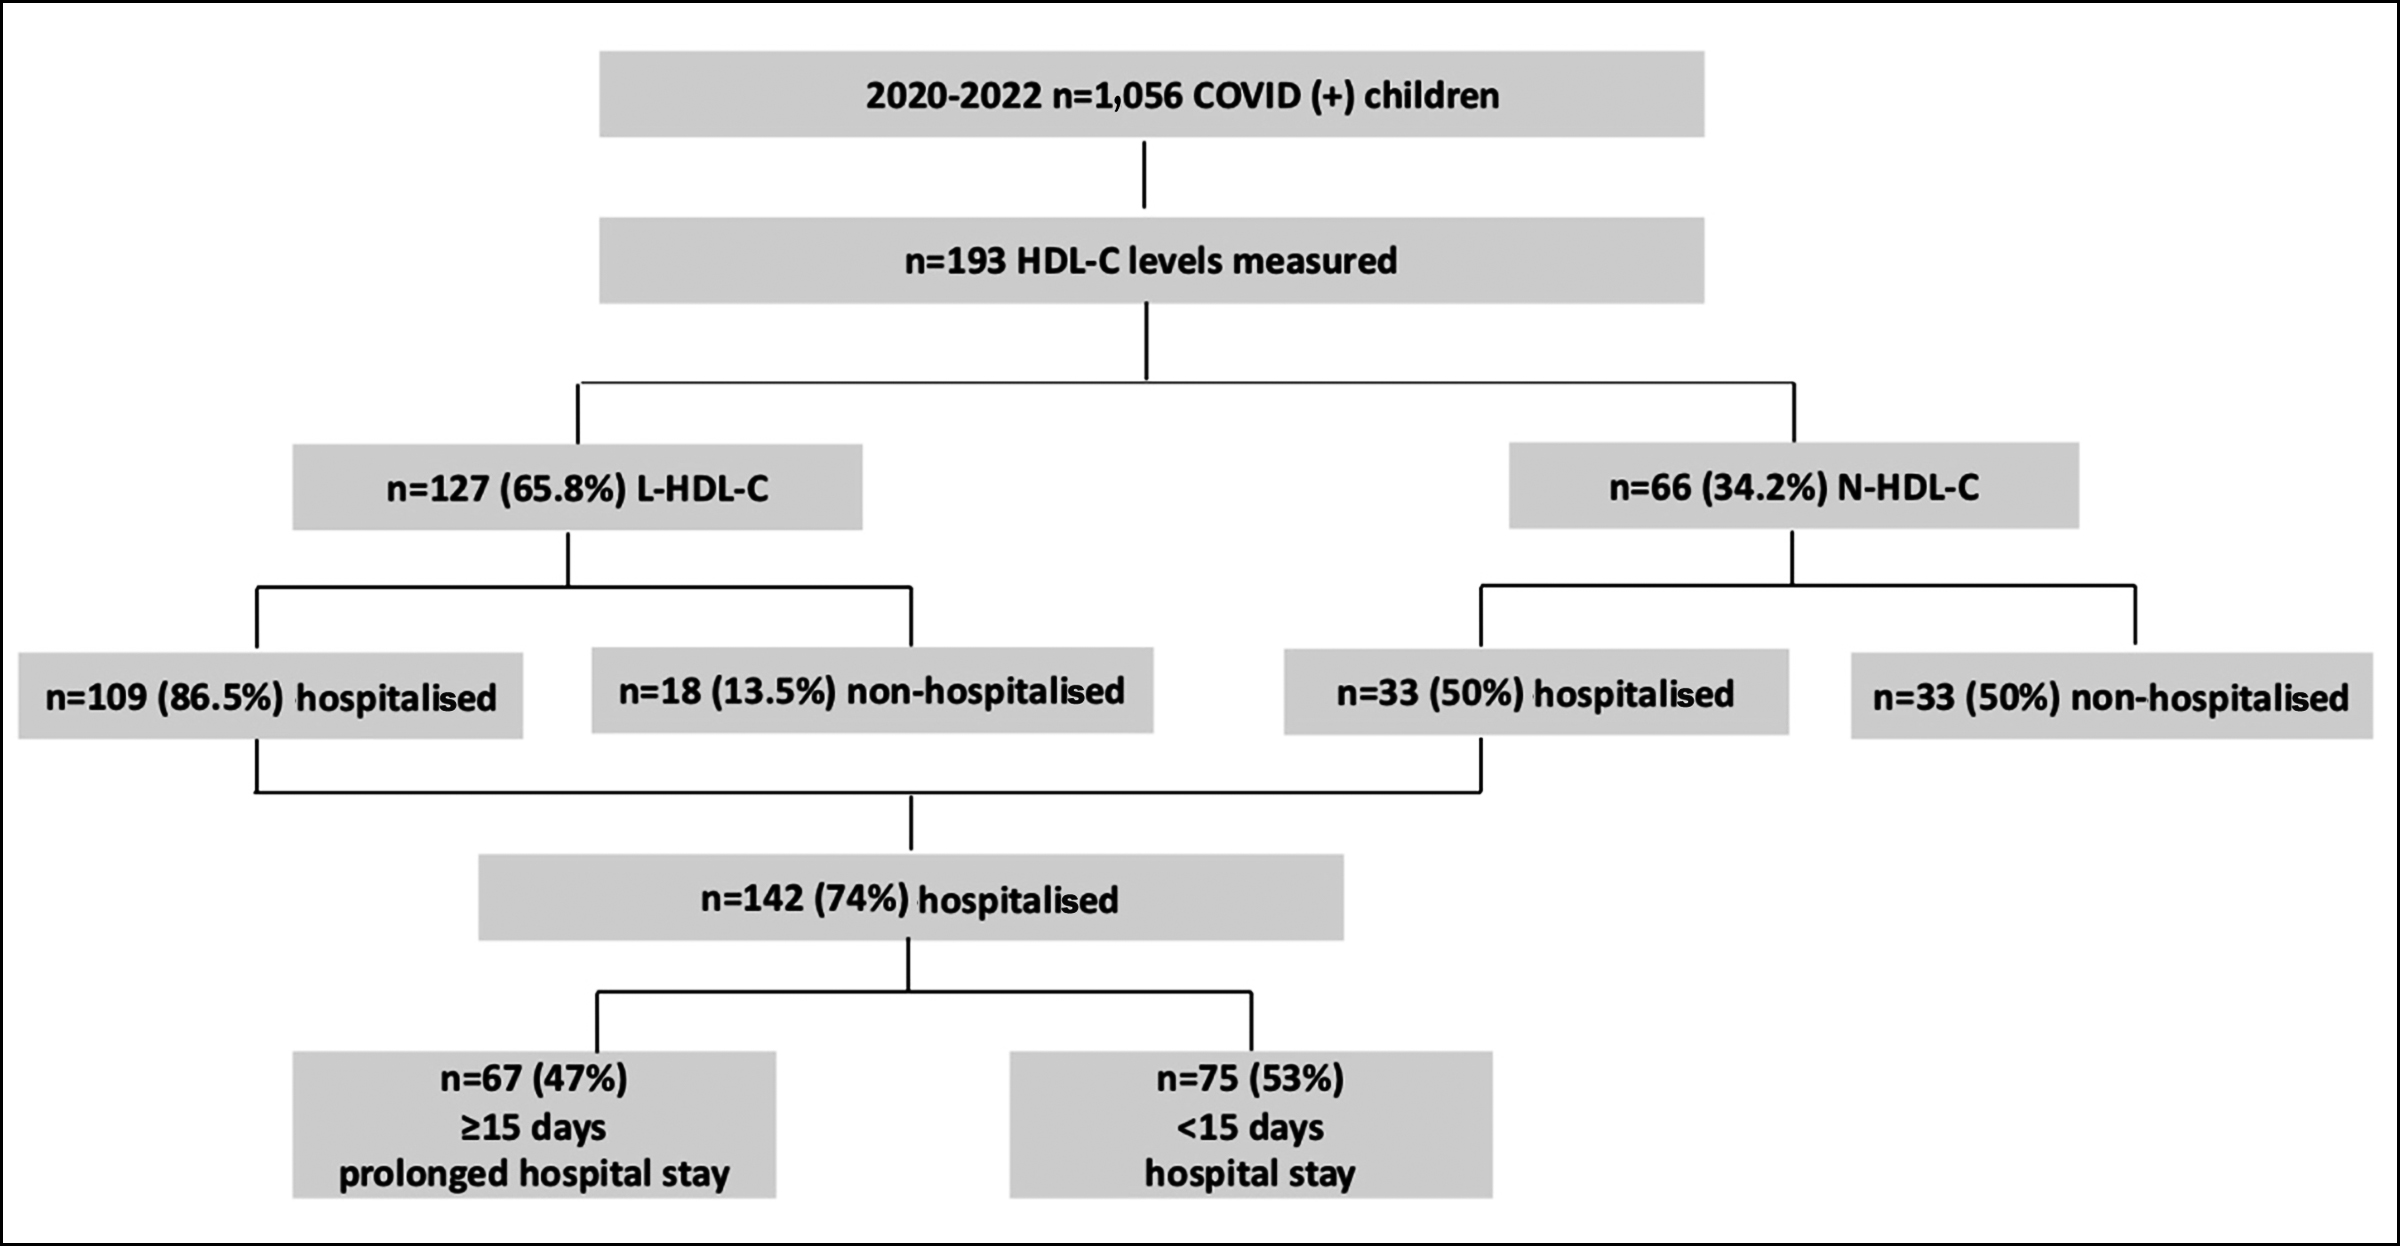 Figure 1: Study population.
Upon admission to the emergency room, a nasopharyngeal swab was obtained. Real-time reverse-transcription PCR (RT-PCR) test was administered using test kits Biospeedy COVID-19 RT-qPCR. COVID-19 was confirmed through a positive PCR result. The enzymatic colorimetric assay method (Abbott Architect c16000 automated system) was used to evaluate the lipid profile and glucose levels. The complete blood count (CBC) was conducted with an automated haematology analyser. Blood samples were reserved at 4°C and handled within 12 hours after being collected. Standard electrochemiluminescence immuno-assay techniques were employed to measure biomarkers CRP, ferritin, troponin I, LDH, D-dimer, and uric acid using diagnostic kits and the Roche Cobas 6,000 analyser (Roche Diagnostics). Other laboratory tests were conducted using conventional biochemical methods.
HDL-C levels were ascertained by the Roche Cobas 6,000 automated platform equipped with a c501 analyser, utilising FDA-approved HDL-CC4 kits supplied by Roche Diagnostics. The underlying principle of the Roche HDL-CC4 test is a direct homogeneous enzymatic colorimetric procedure. This assay amalgamates non-HDL-C lipoproteins, including LDL, VLDL, and chylomicrons, with polyanions and a detergent to create a water-soluble complex. The HDL-C interacts with cholesterol esterase (CHER), cholesterol oxidase (CHOD), and peroxidase, culminating in forming a coloured compound measurable by optical means.
Continuous variables were expressed as mean ± SD or median with an interquartile range depending on data distribution. Categorical variables were presented as percentages. Continuous variable distributions were analysed through visual histogram inspection and the Shapiro-Wilk test. For group comparisons, the t-test for independent samples or the Mann-Whitney U test was used. Either the χ2 test or Fisher's exact test was applied for categorical variables. The Pearson test or Spearman's rho was used to conduct correlation analyses. The critical parameters affecting low HDL status are determined by using univariate analysis. These parameters were then integrated into a logistic regression (LR) multivariate analysis to ascertain their influence on hospitalisation status. Statistical significance was determined by a p-value below 0.05. All evaluations were performed using SPSS 25.0 (IBM Inc, USA).
RESULTS
The study encompassed 1,056 children, with a median age of 12 years. The male and female cohorts comprised 564 (53.4%) and 492 (46.6%) children, respectively. The lipid levels of 193 patients were categorised into two groups according to their HDL-C levels, as set by age and gender reference values.10
Ideal HDL-C levels in children are population-specific, as racial and ethnic differences occur in HDL-C levels of children. National Growth and Health Study, Bogalusa Heart Study, National Health and Nutrition Examination Survey (NHANES) survey, Muscatine Study, and other large-scale studies have provided age- and gender-specific percentiles for lipid levels in children from different populations. Many populations lack populational-specific age- and gender-specific lipid percentiles. In some studies, HDL-C < 45 mg/dl in males and < 50 mg/dl in females are considered low HDL-C in adolescents.11,12 In this study, according to this definition, 108 children (55.7 %) with COVID-19 displayed low HDL-C. Numerous studies have used the National Heart Lung and Blood Institute Growth and Health Study (NGHS) as a reference population.
Based on age-specific and gender-specific cut-off values,10 127 children (65.5%) had low HDL-C levels, and 66 (34.2%) presented with normal HDL-C levels (Figure 1). Although gender distribution between children with low and normal HDL-C levels was similar, children with lower HDL-C levels were significantly younger than children with normal HDL-C (Table I).
Table I contrasts the hospitalisation status, diagnosis, hospital services, mortality rates, and laboratory findings between low and normal HDL-C groups. Children exhibiting reduced HDL-C were more often hospitalised than children with normal HDL-C: 109 (86.5%) with low HDL-C and 33 (50.0%) with normal HDL-C required hospitalisation (p=0.012, Figure 2). Those with low HDL-C had notably elevated levels of triglycerides, glucose, lactate dehydrogenase (LDH), C-reactive protein (CRP), D-dimer, ferritin, and uric acid.
To identify predictors of low HDL-C in children with COVID-19, logistic regression (LR) was employed. Age, ferritin, and D-dimer were found to be linked with decreased HDL-C levels.
The hospitalised children's haemoglobin (Hgb) levels were significantly lower, and glucose, LDH, CRP, D-dimer, and ferritin levels were higher than those of non-hospitalised children (Table II).
Table I: Comparison of clinical outcome and laboratory findings bet-ween low and normal HDL-C groups.
|
HDL-C |
Low HDL-C (n=127)* |
Normal HDL-C (n=66)* |
Statistical Analysis * |
|
Female/Male (%) |
42.5 / 57.5 |
56.1 / 43.9 |
p = 0.074 |
|
Age (year) |
10.1 ± 5.5 |
14.0 ± 2.6 |
p < 0.001 |
|
Hospitalisation No / Yes (%) |
31.5 / 86.5 |
50 / 50 |
p = 0.012 |
|
Exitus No / Yes (%) |
97.7 / 2.3 |
100 / - |
p = 0.377 |
|
Hospitalisation diagnosis (%)** Urinary System Pneumonia URTI Respiratory System Infection Endocrine System Other |
4.3 20.6 7.3 4.3 11.6 9.8 42.1 |
6.3 10.9 4.7 7.8 6.3 15.6 48.4 |
p = 0.275 |
|
Hospitalisation departments (%)** General Paediatrics Paediatric Hematology/Oncology Infection Paediatric COVID Service Paediatric Endocrine Paediatric Surgery Other |
18.5 8.9 12.3 11.6 9.6 8.2 30.8 |
13.7 9.9 5.9 7.8 17.6 3.9 41.2 |
p = 0.339 |
|
Total cholesterol |
153.0 [78.0-694.0] |
162.0 [109.0-372.0] |
p = 0.022 |
|
Triglyceride |
147.4 ± 74.8 |
78.7 ± 30.6 |
p < 0.001 |
|
LDL |
84.1 ± 33.4 |
96.4 ± 39 |
p = 0.515 |
|
Glucose |
116.0 [81.0-747.0] |
101.0 [71.0-553.0] |
p = 0.001 |
|
LDH |
343.0 [150.0-6989.0] |
251.0 [146.0-529.0] |
p < 0.001 |
|
CRP |
0.6 [0.6-283.9] |
0.5 [0.1-80.9] |
p = 0.009 |
|
D-dimer |
2.4 ± 4.7 |
0.5 ± 0.7 |
p < 0.001 |
|
Ferritin |
984 ± 2265 |
109.4 ± 118.3 |
p < 0.001 |
|
Uric acid |
6.3 ± 2.2 |
4.5 ± 2.0 |
p = 0.002 |
|
*Pearson-χ2 crosstabs were used to analyse the relationships between two qualitative variables. Parametric variables are expressed with mean ± SD, and non-parametric variables are expressed with median [min-max]. Independent Sample t-test (t-table value) statistics were used to compare the measurement values of two independent groups in data with normal distribution. The Mann-Whitney U test statistics were used to compare the measurement values of two independent groups in the data that did not have a normal distribution. **More than one answer was given to the question, and the percentages were determined according to the increasing number of samples. |
|||
Table II: Comparison of parameters according to hospitalisation status.
|
Hospitalisation |
No (n=51)* |
Yes (n=142)* |
Statistical |
|
Age (year) |
12.0 ± 4.1 |
11.3 ± 5.3 |
p = 0.399 |
|
Hgb |
12.2 ± 2.1 |
10.6 ± 2.8 |
p < 0.001 |
|
Anti-Hbs |
59.6 [0.5-654.7] |
59.0 [0.9-1000.0] |
p = 0.502 |
|
Total Cholesterol |
154.0 [78.0-256.0] |
149.5 [89.0-279.0] |
p = 0.933 |
|
Triglyceride |
112.5 ± 63.0 |
144.7 ± 100.4 |
p = 0.301 |
|
LDL |
86.1 ± 31.6 |
87.0 ± 32.3 |
p = 0.938 |
|
Glucose |
97.0 [47.0-1161.0] |
121.0 [51.0-747.0] |
p < 0.001 |
|
LDH |
214.5 [152.0-1553.0] |
356.0 [161.0-3483.0] |
p < 0.001 |
|
CRP |
0.5 [0.2-102.87] |
0.6 [0.2-283.9] |
p = 0.005 |
|
D-dimer |
2.1 ± 7.0 |
1.7 ± 2.0 |
p = 0.015 |
|
Troponin I |
0.1 [0.0-4.1] |
0.1 [0.0-23.6] |
p = 0.114 |
|
Ferritin |
310.4 ± 1.95.6 |
455.5 ± 1213.5 |
p = 0.002 |
|
Uric acid |
4.9 ± 2.1 |
5.6 ± 2.5 |
p = 0.059 |
|
Procalcitonin |
0.1 [0.1-65.2] |
0.2 [0.1-63.7] |
p = 0.656 |
|
HDL |
47.5 [16.0-84.0] |
39.0 [16.0-95.0] |
p < 0.001 |
|
WBC |
6.2 ± 2.4 |
6.7 ± 2.9 |
p = 0.922 |
|
Neutrophil |
2.9 ± 1.5 |
3.1 ± 1.7 |
p = 0.930 |
|
Lymphocyte |
2.1 ± 1.4 |
2.4 ± 1.5 |
p = 0.816 |
|
Eosinophil |
0.1 [0.0-1.1] |
0.1 [0.1-0.6] |
p = 0.798 |
|
PLT |
242.2 ± 104.5 |
257.7 ± 99.2 |
p = 0.967 |
|
*Parametric variables are expressed with mean± SD and non-parametric variables are expressed with median [min-max]. **Independent Sample-t test (t-table value) statistics were used to compare the measurement values of two independent groups in data with normal distribution. The Mann-Whitney U test statistics were used to compare the measurement values of two independent groups in the data that did not have a normal distribution. The p-values < 0.05 are considered to be significant. |
|||
Table III: Comparison of parameters according to long hospitalisation.
|
Hospitalisation days |
≤15 days (n=75)* |
>15 days (n=67)* |
Statistical analysis** |
|
Age (year) |
11.9 ± 5.1 |
10.3 ± 5.5 |
p = 0.913 |
|
Hgb |
12.0 ± 2.1 |
8.6 ± 2.6 |
p < 0.001 |
|
Anti-Hbs |
27.3 [0.9-1000.0] |
82.9 [2.0-1000.0] |
p = 0.125 |
|
Total Cholesterol |
137.0 [89.0-239.0] |
151.0 [94.0-279.0] |
p = 0.700 |
|
Triglyceride |
132.6 ± 91.9 |
163.2 ± 111.1 |
p = 0.667 |
|
LDL |
87.5 ± 30.6 |
86.1 ± 35.6 |
p = 0.977 |
|
Glucose |
106.0 [51.0-486.0] |
141.0 [95.0-747.0] |
p < 0.001 |
|
LDH |
311.5 [161.0-718.0] |
397.0 [176.0-3483.0] |
p < 0.001 |
|
CRP |
0.6 [0.2-250.7] |
0.6 [0.6-283.9] |
p = 0.926 |
|
D-dimer |
1.3 ± 1.6 |
2.3 ± 2.3 |
p = 0.052 |
|
Troponin I |
0.1 [0.1-23.6] |
0.1 [0.1-16.3] |
p = 0.618 |
|
Ferritin |
185.7 ± 40.8.1 |
885.9 ± 1823.7 |
p < 0.001 |
|
Uric acid |
5.3 ± 1.9 |
5.9 ± 3.2 |
p = 0.066 |
|
Procalcitonin |
0.1 [0.1-6.5] |
0.6 [0.1-63.7] |
p = 0.008 |
|
HDL |
42.0 [16.0-95.0] |
35.0 [17.0-61.0] |
p = 0.010 |
|
WBC |
6.7 ± 3.4 |
6.6 ± 2.1 |
p = 0.153 |
|
Neutrophil |
3.1 ± 1.8 |
3.0 ± 1.4 |
p = 0.380 |
|
Lymphocyte |
2.4 ± 1.5 |
2.4 ± 1.5 |
p = 0.762 |
|
Eosinophil |
0.1 [0.1-0.6] |
0.1 [0.1-0.5] |
p = 0.762 |
|
PLT |
270.3 ± 97.5 |
240.8 ± 100.2 |
p = 0.369 |
|
*Parametric variables are expressed with mean ± SD, and non-parametric variables are expressed with median [min-max]. **Independent Sample t-test (t-table value) statistics were used to compare the measurement values of two independent groups in data with normal distribution. The Mann-Whitney U test statistics were used to compare the measurement values of two independent groups in the data with the abnormal distribution. The p-values <0.05 are considered to be significant. |
|||
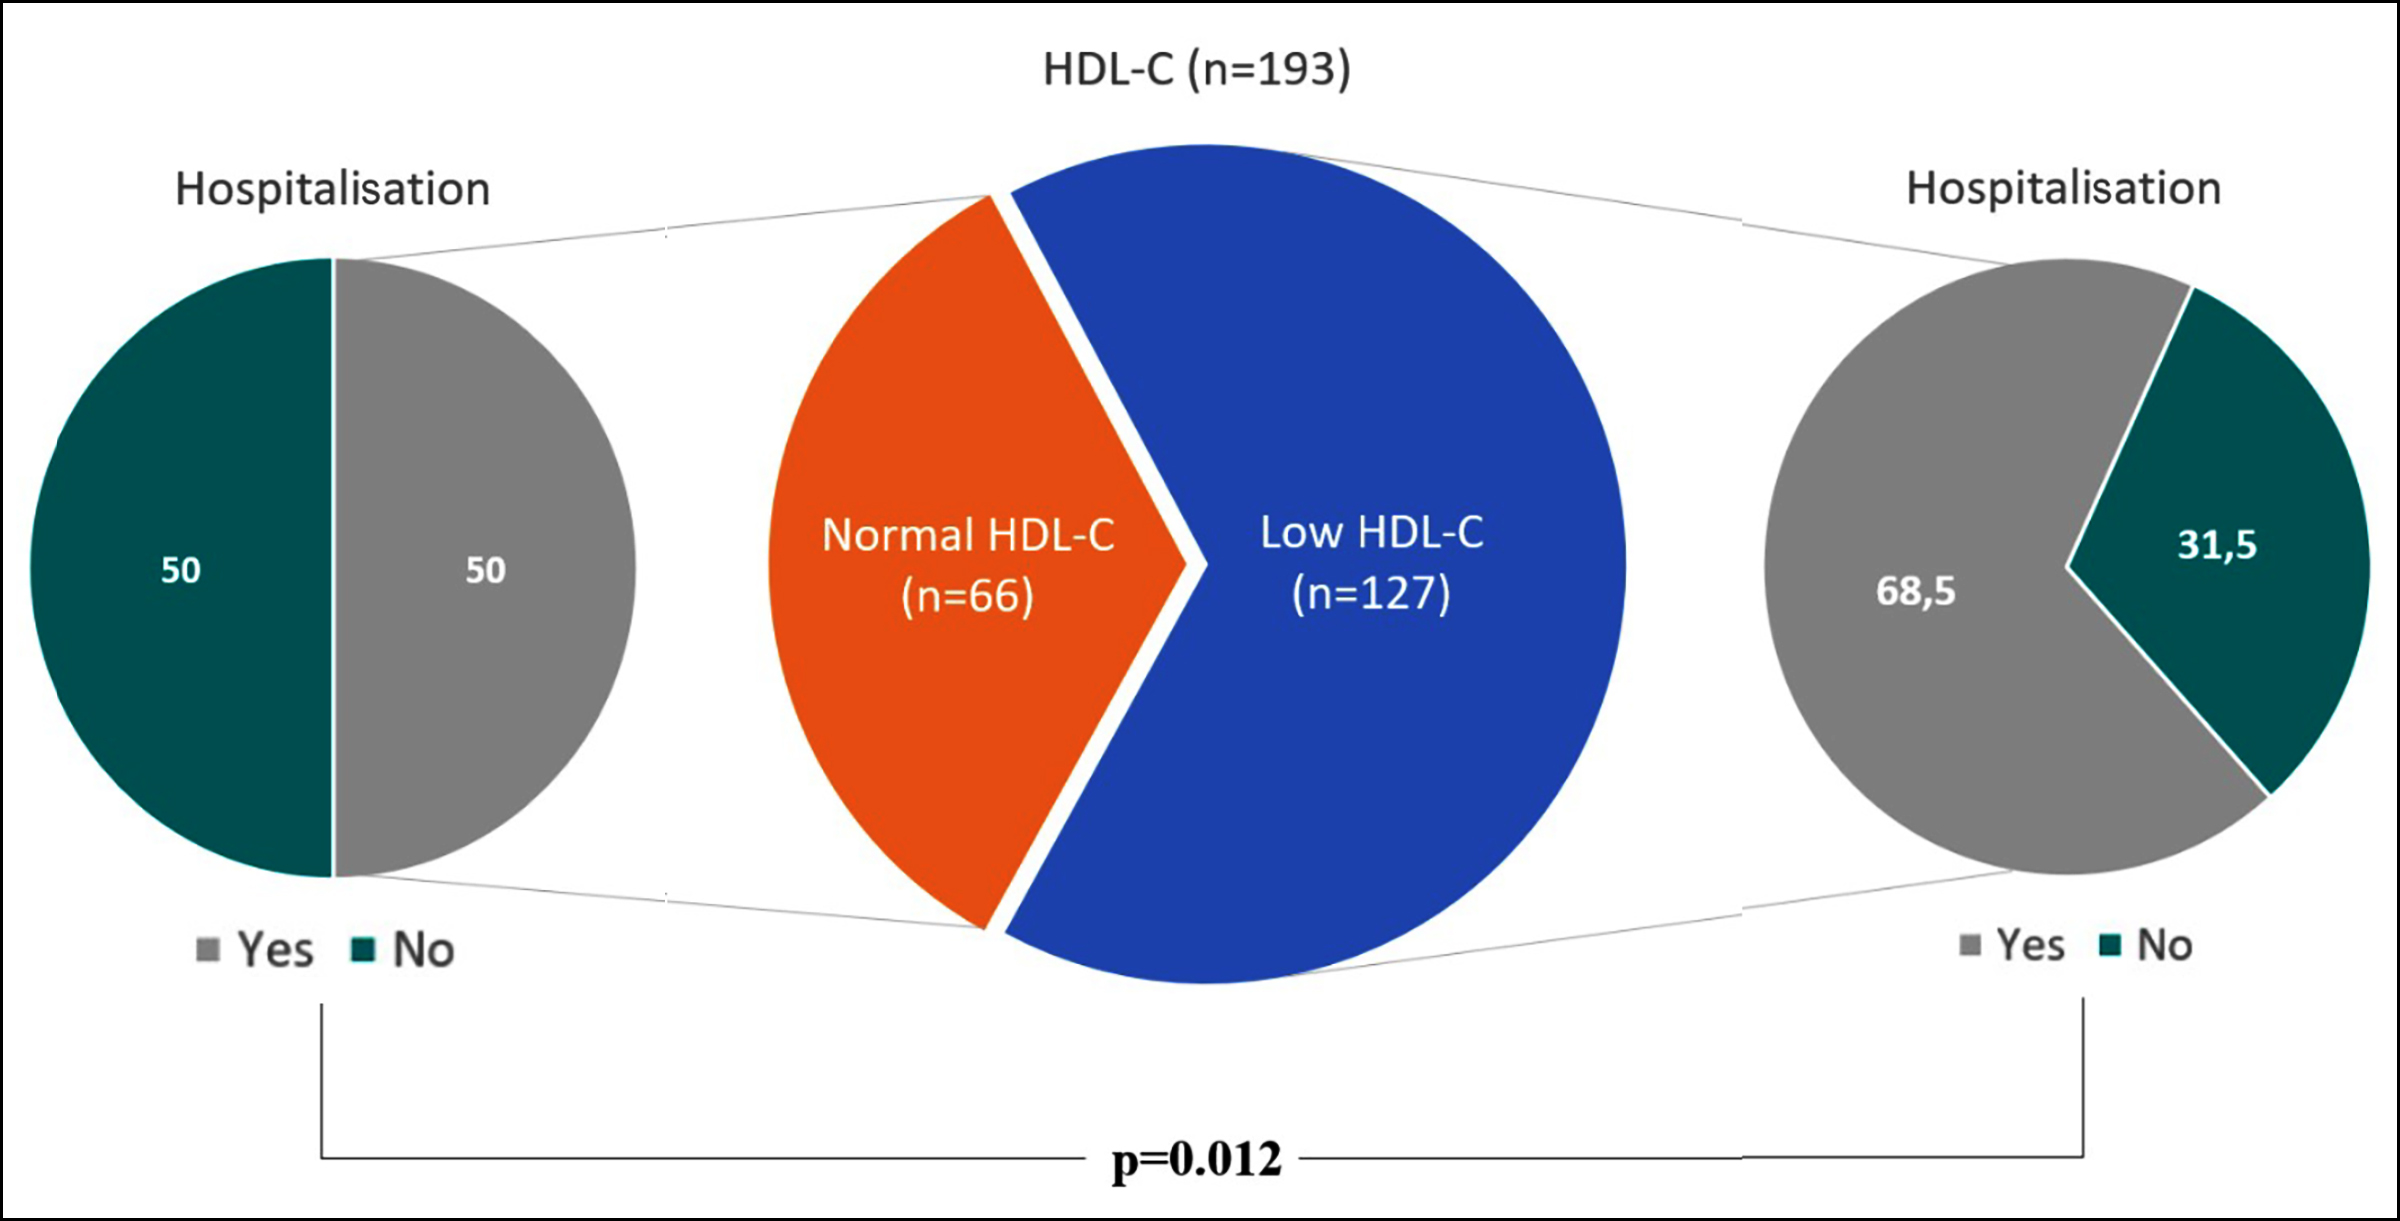 Figure 2: HDL-C groups and hospitalisation status. A statistically notable correlation was determined between HDL-C groups and hospitalisation status. It was found that 109 (86.5%) with low HDL-C and 33 (50.0%) with normal HDL-C were hospitalised (p=0.012).
Patients who were hospitalised had a median stay of 15 days. Those with extended hospital stays (>median) exhibited significantly higher glucose, LDH, ferritin, procalcitonin levels, and lower Hgb levels compared to those with shorter stays (<median, Table III). An LR analysis revealed that Hgb and glucose were associated with prolonged hospitalisation risk.
DISCUSSION
The study indicates low HDL-C values are commonly observed in paediatric patients with COVID-19. Children with low HDL-C are hospitalised more continually than those with normal HDL-C. Diminished HDL-C was linked with increased inflammatory biomarkers of COVID-19. Future clinical studies are required to interpret the impacts of HDL-C on COVID-19 outcomes in children.
Prior studies reported that HDL-C values are inversely related to inflammation markers, notably CRP levels—a biomarker previously linked to COVID severity.13 In healthy children, a positive correlation exists between the total cholesterol (TC) / HDL-C ratio and high-sensitivity CRP (hs-CRP) levels.14
To date, no reports discuss the impact of COVID-19 infections on paediatric lipid profiles. Nevertheless, shifts in lipid profiles mirror the severity of the underlying infection in adults.15 Individuals with genetically low HDL-C levels have increased disease risk and severity of infectious disease.16 Paediatric patients with MIS-C consistently exhibit low HDL-C levels, even without any discernible pre-existing confounding factors. It remains uncertain whether intricate genetic factors influencing HDL-C function also determine susceptibility to MIS-C. Yet, several studies have indicated that dysfunctional HDL-C can lead to conditions, such as infections and autoimmune disorders.17 Epidemiological studies have displayed that the Turks have diminished HDL-C and increased triglyceride concentrations.18,19 Genetic inkage analysis indicates the localisation of quantitative-trait loci (QTLs) influencing high-density lipoprotein-cholesterol (HDL-C). Plasma HDL-C levels are associated with variations on chromosome 15q21-23 loci in Turkish families.20
The findings of this study resonate with other studies that documented decrease in TC, HDL-C, and LDL-C, variable shifts in triglycerides among COVID-19 patients.21 Wei et al. reported that LDL-C and TC levels were substantially lower in COVID-19 patients than the healthy control group. A significant drop in HDL-C levels was monitored in severe cases.13
Despite existing recommendations, lipid screenings were performed on only a scarcity of children and adolescents.22 Lipids were not conventionally screened in paediatric populations. Aligning with the authors’ observations, pre-hospitalisation lipid levels in adults display that low HDL-C is a determinant of increases in the hospitalisation need in COVID-19.23 Low HDL-C serum levels at admission are associated with extended hospital stays in adults with COVID-19.8
The role of HDL-C in immunity has been defined by its immunomodulatory activities. Sphingosine 1 phosphate (S1P), a bioactive lipid in HDL, modulates transcriptional pathways through its receptors. A secondary mechanism involves pronounced neutrophil activation and degranulation patterns with abundant NET formations in MIS-C paediatric patient blood samples.24 Recombinant HDL is under examination as a conceivable therapy for extreme cases of COVID-19.25
This research was cross-sectional and had various limitations. Lipid levels in children were not monitored after COVID-19 due to research limitations during the pandemic. The lipid levels in children at baseline before COVID-19 were not known. Other parameters affecting lipid levels in children, such as physical activity, diet, and socioeconomic class, were not assessed. Several factors can majorly affect COVID-19 outcomes in children, including the host country, population, available resources, distinct SARS-CoV-2 variants, and vaccination status. The study group was small and lacked the power to associate lipid levels with COVID-19 outcomes.
CONCLUSION
Low HDL-C levels are associated with an escalated requirement for hospitalisation and inflammatory biomarkers in children with COVID-19. Future studies and screening lipid levels in healthy children can provide insights to understand the effects of HDL-C on infection outcomes in the paediatric population. Such efforts are required to qualify for future global ecological crises affecting children. Every child on earth is increasingly at risk from wars, climate, and environmental hazards. Poor countries are the worst affected. Understanding the impact of protective proteins, such as HDL-C, throughout the lifespan is worthwhile for preparedness for future global ecological crises in children.
ACKNOWLEDGEMENT:
The authors thank the information technology project manager Recep Yildiz for collecting data.
ETHICAL APPROVAL:
The ethics committee of Medeniyet University School of Medi-cine approved the study with the protocol number 2022/0156.
PATIENTS’ CONSENT:
Patient consents were obtained from patients' parents.
COMPETING INTEREST:
The authors declared no conflict of interest.
AUTHORS’ CONTRIBUTION:
NK, MA, OI: Conceptualised the study and drafted the manu-script.
NK, VC, OI: Performed the statistical analysis.
NK, OI, VC, MA: Cared for patients and provided samples, intellectually contributed to the manuscript and discussions.
All authors approved the final version of the manuscript to be published.
REFERENCES
- Roberton T, Carter ED, Chou VB, Stegmuller AR, Jakson BD, Tam Y, et al. Early estimates of the indirect effects of the COVID-19 pandemic on maternal and child mortality in low-income and middle-income countries: A modelling study. Lancet Glob Health 2020; 8(7):e901-8. doi:10.1016/ S2214-109X(20)30229-1.
- Akcay N, Kihtir HS, Durak C, Kendirli T, Havan M, Kockuzu E, et al. Mortality risk factors among critically ill children with acute COVID-19 in PICUs: A multicenter study from Turkish pediatric critical COVID-19 and MIS-C Study Group. Pediatr Infect Dis J 2022; 41(9):742-50. doi:10.1097/INF. 0000000000003592.
- Riphagen S, Gomez X, Gonzalez-Martinez C, Wilkinson N, Theocharis P. Hyperinflammatory shock in children during COVID-19 pandemic. Lancet 2020; 395(10237):1607-8. doi: 10.1016/S0140-6736(20)31094-1.
- Calder PC. Eicosanoids. Essays Biochem 2020; 64(3): 423-41.doi: 10.1042/EBC20190083.
- Baycan OF, Bolen F, Atalay B, Agirbasli M. Prognostic significance of HDL-C on long-term mortality in patients with COVID-19 pneumonia in the Turkish population: A potential mechanism for population differences. Bosn J Basic Med Sci 2022; 22(6):1016-24. doi:10.17305/bjbms. 2022.7545.
- Morelli VM, Lijfering WM, Bos MHA, Rosendaal FR, Cannegieter SC. Lipid levels and risk of venous throm-bosis: Results from the MEGA-study. Eur J Epidemiol 2017; 32(8):669-81. doi:10.1007/s10654-017-0251-1.
- Wang G, Zhang Q, Zhao X, Dong H, Wu C, Wu F, et al. Low high-density lipoprotein level is correlated with the severity of COVID-19 patients: An observational study. Lipids Health Dis 2020; 19(1):204. doi: 10.1186/s12944- 020-01382-9.
- Qin C, Minghan H, Ziwen Z, Yukun L. Alteration of lipid profile and value of lipids in the prediction of the length of hospital stay in COVID-19 pneumonia patients. Food Sci Nutr 2020; 8(11):6144-52. doi: 10.1002/fsn3.1907.
- Hodoglugil U, Williamson DW, Mahley RW. Polymorphisms in the hepatic lipase gene affect plasma HDL-cholesterol levels in a Turkish population. J Lipid Res 2010; 51(2): 422-30. doi:10.1194/jlr.P001578.
- NGHS. Coordinating Center. NHLBI Growth and Health Study (NGHS) data monitoring report. Baltimore: Maryland Medical Research 1998 1998.
- Freedman DS, Serdula MK, Srinivasan SR, Berenson GS. Relation of circumferences and skinfold thicknesses to lipid and insulin concentrations in children and adolescents: The bogalusa heart study. Am J Clin Nutr 1999; 69(2):308-17. doi: 10.1093/ajcn/69.2.308.
- de Ferranti SD, Gauvreau K, Ludwig DS, Neufeld EJ, Newburger JW, Rifai N. Prevalence of the metabolic syndrome in American adolescents: Findings from the third national health and nutrition examination survey. Circulation 2004; 110(16):2494-7. doi:10.1161/01.CIR. 0000145117.40114.C7.
- Wei X, Zeng W, Su J, Wan H, Yu X, Cao X, et al. Hypolipi-demia is associated with the severity of COVID-19. J Clin Lipidol 2020; 14(3):297-304. doi: 10.1016/j.jacl.2020.04.008.
- Agirbasli M, Tanrikulu A, Acar Sevim B, Aziz M, Bekiroglu N. Total cholesterol-to-high-density lipoprotein cholesterol ratio predicts high-sensitivity C-reactive protein levels in Turkish children. J Clin Lipidol 2015; 9(2):195-200. doi: 10.1016/j.jacl.2014.12.010.
- Deniz O, Tozkoparan E, Yaman H, Cakir E, Gumus S, Ozcan O, et al. Serum HDL-C levels, log (TG/HDL-C) values and serum total cholesterol/HDL-C ratios significantly correlate with radiological extent of disease in patients with community-acquired pneumonia. Clin Biochem 2006; 39(3):287-92. doi: 10.1016/j.clinbiochem.2006.01.015.
- Trinder M, Walley KR, Boyd JH, Brunham LR. Causal inference for genetically determined levels of high-density lipoprotein cholesterol and risk of infectious disease. Arterioscler Thromb Vasc Biol 2020; 40(1):267-78. doi: 10.1161/ATVBAHA.119.313381.
- Rohatgi A, Westerterp M, von Eckardstein A, Remaley A, Rye KA. HDL in the 21st Century: A multifunctional roadmap for future hdl research. Circulation 2021; 143(23):2293-309. doi: 10.1161/CIRCULATIONAHA.120. 044221.
- Mahley RW, Can S, Ozbayrakci S, Bersot TP, Tanir S, Palaoglu KE, et al. Modulation of high-density lipoproteins in a population in Istanbul, Turkey, with low levels of high-density lipoproteins. Am J Cardiol 2005; 96(4):547-55. doi: 10.1016/j.amjcard.2005.04.018.
- Onat A, Surdum-Avci G, Senocak M, Ornek E, Gözükara Y. Plasma lipids and their interrelationship in Turkish adults. J Epidemiol Community Health 1992; 46 (5):470-76. doi: 10.1136/jech.46.5.470.
- Yu Y, Wyszynski DF, Waterworth DM, Wilton SD, Barter PJ, Kesaniemi YA, et al. Multiple QTLs influencing triglyceride HDL, and total cholesterol levels were identified in families with atherogenic dyslipidemia. J Lipid Res 2005; 46(10): 2202-13. doi: 10.1194/jlr.M500137-JLR200.
- Souza Junior DR, Silva ARM, Rosa-Fernandes L, Reis LR, Alexandria G, Bhosale SD, et al. HDL proteome remodeling associates with COVID-19 severity. J Clin Lipidol 2021; 15(6):796-804. doi: 10.1016/j. jacl.2021.10.005.
- Berger JH, Chen F, Faerber JA, O'Byrne ML, Brothers JA. Adherence with lipid screening guidelines in standard-and high-risk children and adolescents. Am Heart J 2021; 232:39-46. doi: 10.1016/j.ahj.2020.10.058.
- Masana L, Correig E, Ibarretxe D, Anoro E, Arroyo JA, Jerico C, et al. Low HDL and high triglycerides predict COVID-19 severity. Sci Rep 2021; 11:7217. doi: 10.1038/s41598- 021-86747-5.
- Conway SR, Lazarski CA, Field NE, Jensen-Wachspress M, Lang H, Kankate V, et al. SARS-CoV-2-Specific T cell res-ponses are stronger in children with multisystem inflammatory syndrome compared to children with uncom-plicated SARS-CoV-2 infection. Front Immunol 2021; 12: 793197. doi: 10.3389/fimmu.2021.793197.
- Tanaka S, Begue F, Veeren B, Tran-Dinh A, Roberst T, Tashk P, et al. First recombinant high-density lipoprotein particles administration in a severe ICU COVID-19 patient, a multi-omics exploratory investigation. Biomedicines 2022; 10(4):754. doi: 10.3390/biomedicines10040754.