IVIM and DCE-MRI in Predicting Phenotypic Subtypes and Nottingham Prognostic Index of Breast Cancer
By Zhanguo Sun1, Zhe Zhou1, Lei Wang2, Laimin Zhu1, Yueqin Chen1, Qiaolu Liu1Affiliations
doi: 10.29271/jcpsp.2024.04.400ABSTRACT
Objective: To explore the value of intravoxel incoherent motion (IVIM) and dynamic contrast enhanced MRI (DCE-MRI) for predicting phenotypic subtypes and Nottingham prognostic index (NPI) of breast cancer.
Study Design: Descriptive study.
Place and Duration of the Study: Department of Radiology, Affiliated Hospital of Jining Medical University, Jining, Shandong, China, from March 2020 to January 2022.
Methodology: One hundred and forty-one breast cancer patients with preoperative IVIM and DCE imaging were collected. IVIM parameters of D, D*, f, and DCE-MRI parameters of Ktrans, Kep, and Ve were measured. Receiver operating characteristic curves were conducted to assess the diagnostic efficacies. Additionally, 40 patients collected from February 2022 to July 2022 were enrolled as validation cohort.
Results: The D value in HER2-enriched (HER2-E) was lower than that in non-HER-E, while D*, Ktrans, and Ve values were higher than that in non-HER-E (p < 0.001, 0.046, < 0.001, and < 0.001, respectively). D + Ktrans + Ve showed an optimal diagnostic efficiency (AUC = 0.868). Meanwhile, D* and f values of triple-negative breast cancer (TNBC) were higher than those of non-TNBC, and Ve value of TNBC was lower than that of non-TNBC (p = 0.013, 0.006, and < 0.001, respectively). D* + f + Ve showed the best prediction performance (AUC = 0.849). Additionally, D and Kep were independent predictors of NPI (p < 0.001, and 0.002, respectively). D + Kep showed a good diagnostic efficiency (AUC = 0.818).
Conclusion: The combined IVIM and DCE-MRI model showed enhanced diagnostic efficiency in predicting phenotypic subtypes and NPI of breast cancer, and might thus be considered efficient in therapy decision-making for patients.
Key Words: Breast neoplasms, Intravoxel incoherent motion, Dynamic contrast enhanced magnetic resonance imaging, Phenotypic subtypes, Nottingham prognostic index.
INTRODUCTION
Breast cancer has become one of the most common diseases affecting women's health worldwide in 2020, with morbidity and mortality topping the list.1 Breast cancer presents a high degree of heterogeneity at the molecular level, and the prognosis varies based upon different phenotypic subtypes and prognostic factors.2 HER2-Enriched (HER2-E) tumour is characterised by low degree of differentiation, high degree of malignancy, and susceptibility to axillary lymph node metastasis. It is sensitive to target treatment.3 Triple-negative breast cancer (TNBC) has the highest degree of malignancy and aggressiveness, which is not sensitive to targeted therapy and endocrine therapy, and has the worst prognosis.4
Preoperative genotyping of breast cancer is an important predictor of neoadjuvant chemotherapy responsiveness and helps to provide patients with optimised treatment strategies. Nottingham prognostic index (NPI) is an internationally recognised prognostic indicator of breast cancer, which is of great significance for assessing the aggressiveness of the lesion and formulating reasonable clinical treatment measures.5 The grade of Nottingham is closely related to the tumour’s maximum diameter, number of metastatic axillary lymph nodes, and histological grade. The higher the grade of NPI, the greater the impact on treatment and prognosis.6
At present, the genotypes of breast cancer are mostly diagnosed by pre-treatment biopsy or postoperative pathological biopsy, but the scope of pre-treatment tumour biopsy is relatively limited, and cannot fully reflect the composition of the whole tumour. Compared with mammography or ultrasound, MRI has higher soft tissue resolution.7 Diffusion-weighted imaging (DWI) can reflect the microscopic characteristics of the lesion, but the corresponding metric of ADC cannot exclude the influence of microcirculation perfusion, and the reported reliability is controversial.8 However, intravoxel incoherent motion (IVIM) can be used to separately evaluate the diffusion and perfusion parameters through multiple b-value DWI acquisition, thus to comprehensively reflecting the internal situation of tumours.9 On the other hand, DCE-MRI can be used to quantitatively evaluated the microvascular perfusion of tumours by using the derived parameters (Ktrans, Kep, and Ve), which may achieve complementary information with parameters of IVIM.10
The purpose of the present study was to quantitatively compare the diagnostic performance of parameters obtained from the IVIM, DCE-MRI, and their combined model for discriminating different phenotypic subtypes and NPI of breast cancer.
METHODOLOGY
This descriptive research was approved by the Medical Research Ethics Committee of the Affiliated Hospital of Jining Medical University (No. 2021-C019). The informed consent from each patient was waived because of the instinctive characteristics of retrospection and anonymity. Total 242 breast cancer patients, confirmed by pathological examination, underwent breast MR examination at the Affiliated Hospital of Jining Medical University between March 2020 to January 2022. The inclusion criteria were patients with complete clinical data; and the complete breast MRI (including conventional MRI, IVIM, and DCE acquisitions) conducted before receiving surgery, biopsy or chemoradiotherapy. The exclusion criteria were the unavailability of MRI images; breast lesions less than 1cm in size; and non-mass enhancement lesions to eliminate the impact of indefinite boundaries on the results. Finally, 141 patients were enrolled as testing cohort in the present study. Additional data of 40 breast cancer patients from February 2022 to July 2022 were collected as an independent validation cohort, with the same inclusion and exclusion criteria as above.
A 3.0T MR scanner (Discovery MR750w, GE) and a 16-channel breast coil were used to perform the MRI examination. The scan sequences included axial IVIM and DCE-MRI. For the IVIM sequence, TR / TE = 2500 / 89.9 ms, Field of view was 35 × 35 cm2, Matrix was 128 × 128 mm2, Slice thickness was 4 mm, Slice spacing was 0.4 mm, Number of slices was 24, b values were 20, 30, 50, 70, 100, 150, 200, 500, 700, 1000, 1500, 2000 s / mm2. For the DCE sequence, TR / TE = 7.2 / 1.2 ms, Field of view was 34 × 34 cm2, Matrix was 320 × 320 mm2, Slice thickness was 0.7 mm, Slice spacing was 0 mm, Number of slices was 30. A total of forty-five phases of dynamic MRI enhancement were performed after I.V. injection of gadopentetate dimeglumine (Gd-DTPA) with a high pressure injector.
IVIM images were transferred to GE Advantage Workstation (AW 4.6) and processed using the MADC software. The IVIM parameters were calculated by using the following equation:
This bi-exponential model was used to get true diffusion coefficient (D), pseudo diffusion coefficient (D*), and perfusion fraction (f).
The parametric maps of DCE-MRI, including the volume transfer constant (Ktrans), rate constant of back flux (Kep), and volume fraction of extravascular extracellular space (Ve), were obtained by using Omni Kinetics software (version V2.1.1R).
Theee regions of interest (ROI) were drawn manually by outlining the solid part of the tumour tissue on IVIM maps at b value of 1000 s / mm2 for IVIM parameters and the contrast-enhanced images at the early phase for DCE parameters, respectively. In patients with multifocal lesions, only the largest tumour was selected for analysis. The ROIs of IVIM and DCE images with comparable size and shape were correspondingly copied onto colour-coded images of the IVIM and DCE by using 3D-synchroview (Figure 1). All of the ROIs were delineated by two radiologists on the maximum cross-section of lesions across three consecutive slices, and then the average values of each parameter were calculated.
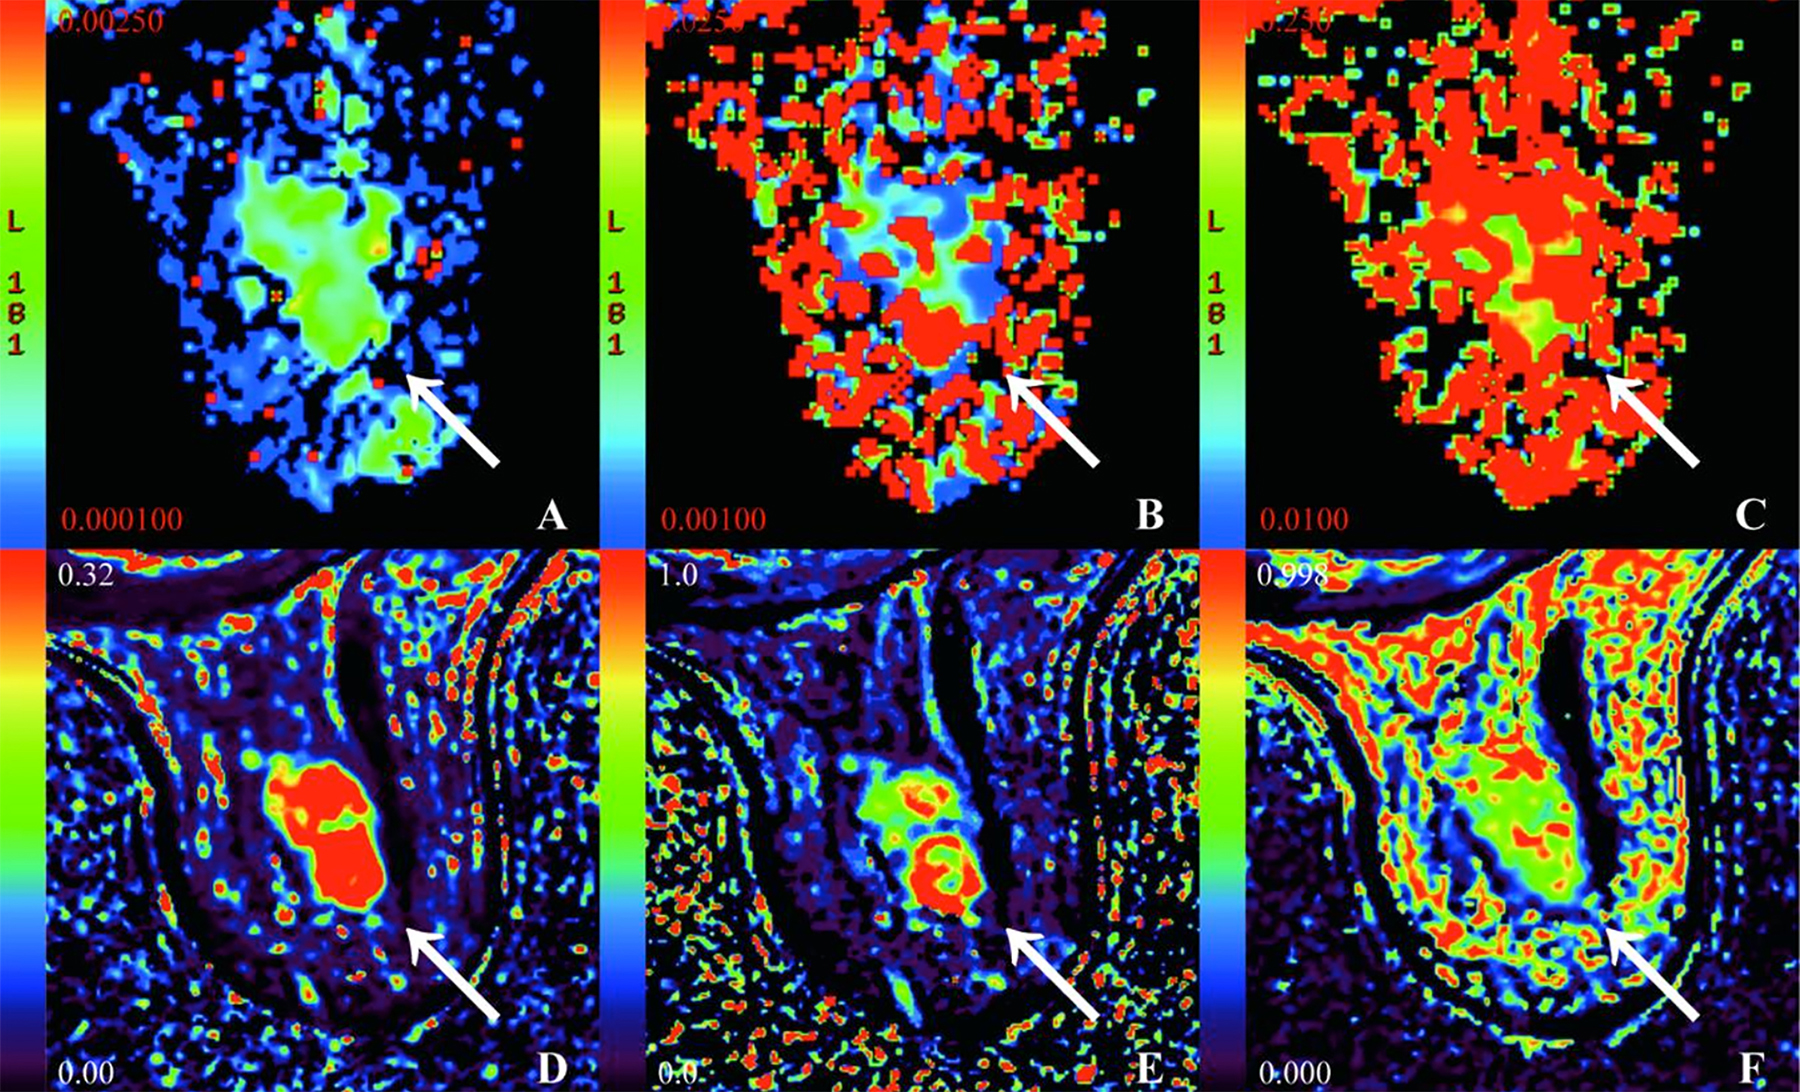 Figure 1: A 68-year-old female patient with HER2-E cancer in the right breast. (A - F) pseudo-colored maps of the D, D*, f, Ktrans, Kep, and Ve. D = 0.51 × 10⁻³mm2/s, D* = 33.1 × 10⁻³mm2/s, f = 32.7 %, Ktrans = 0.37/min, Kep = 0.39/min, Ve = 0.81.
The criterion for estrogen receptor (ER) / progesterone receptor (PR) positive was 1% or greater of positive tumour cell nuclei. Tumours with immunohistochemistry staining scores of 3+ were defined as HER2 positive. For tumours with score of 2+, fluorescence in situ hybridisation for positive was defined as HER2 positive. Ki-67 expression was scored for percentages of cells with positive immune staining in 10 high magnification microscopic fields, and Ki-67 ≥ 20% was considered as Ki-67 high expression. In this study, the phenotypic subtypes were classified into HER2-E (negative for ER and PR, with HER2 positivity), non-HER2-E, or TNBC (negative for ER, PR, and HER2), and non-TNBC. The score of NPI was calculated as follows: NPI = tumour size (cm) / 5 + axillary lymph node status (score 1-3) + histological grade (stage 1-3). NPI was assigned to two groups: low-grade (< 3.4) and high-grade (≥ 3.41).
The statistical analysis was conducted with SPSS 25.0 and MedCalc 19.5.2. The interobserver consistency of parameters between the two radiologists was performed by inter-class correlation coefficients (ICCs). The Kolmogorov-Smirnov test was used to determine the normal distribution pattern of measurement data. Normally distributed continuous variables were expressed as the means ± standard deviations, and non-normally distributed continuous variables were expressed as medians with the first and third quartile ranges. Categorical variables were expressed as the number (per cent). Independent samples t-test and Mann-Whitney U test were used to detect the difference of IVIM and DCE-MRI parameters among different phenotypic subtypes or grades of NPI. The logistic regression analysis was used to identify predictive factors. Receiver operating characteristic (ROC) curves analysis was used to assess the diagnostic efficacy. The statistical significance was set at 0.05. A diagnostic test fourfold table was applied to examine the results of the testing cohort by using pathological results as the reference standard.
RESULTS
The ICCs in the testing cohort between the two radiologists ranged from 0.894 to 0.985 for the measurement of D, D*, f, Ktrans, Kep, and Ve values, respectively, indicating excellent measurement reliability.
For pathological characteristics, the ER-positive group showed significantly higher D and lower D*, f, and Ktrans values than the ER-negative group (p = 0.005, < 0.001, 0.036, and 0.010, respectively). PR-positive group showed higher D and lower D* values than the PR-negative group (p = 0.011, and 0.003). HER2-positive group revealed lower D and higher Ktrans and Ve values than the HER2-negative group (p = 0.019, < 0.001, and 0.001, respectively). Compared with tumours of Ki-67 low-expression, high-expression tumours showed lower D and higher Ktrans and Kep values (p < 0.001, < 0.001, and 0.001, respectively, Table I).
HER2-E revealed decreased D value compared with non-HER2-E (p < 0.001). The D*, Ktrans, and Ve values of HER2-E were higher than those of non-HER2-E (p = 0.046, < 0.001, and < 0.001, respectively). TNBC showed higher D* and f and lower Ve values than non-TNBC (p = 0.013, 0.006, and < 0.001, respectively, Table I).
Table I: Comparison of quantitative parameters among different baseline tumour characteristics, phenotypic subtypes, and NPI (n = 141).|
Parameters |
n |
D (×10-3mm2 / s) |
D* (×10-3mm2 / s) |
f (%) |
Ktrans (/ min) |
Kep (/ min) |
Ve |
|
ER-positive |
82 |
0.65 ± 0.10 |
20.15 (12.38, 38.63) |
34.35 (28.08, 45.08) |
0.28 (0.20, 0.46) |
0.56 ± 0.29 |
0.64 (0.48, 0.81) |
|
ER-negative |
59 |
0.60 ± 0.12 |
35.60 (23.30, 54.60) |
41.90 (30.40, 52.90) |
0.41 (0.26, 0.56) |
0.49 (0.40, 0.80) |
0.51 (0.39, 0.81) |
|
t/Z |
|
2.871* |
-3.693** |
-2.092** |
-2.562** |
-0.548** |
-1.609** |
|
p-value |
|
0.005 |
< 0.001 |
0.036 |
0.010 |
0.584 |
0.108 |
|
PR-positive |
65 |
0.66 ± 0.10 |
20.30 (12.15, 38.85) |
36.80 (29.85, 46.65) |
0.26 (0.20, 0.50) |
0.55 (0.35, 0.81) |
0.64 (0.48, 0.82) |
|
PR-negative |
76 |
0.61 ± 0.11 |
31.62 (20.25, 48.86) |
36.80 (28.60, 48.65) |
0.38 (0.25, 0.53) |
0.49 (0.39, 0.75) |
0.57 (0.40, 0.79) |
|
t/Z |
|
2.590* |
-2.957** |
-0.122** |
-1.776** |
-0.294** |
-1.243** |
|
p-value |
|
0.011 |
0.003 |
0.903 |
0.076 |
0.769 |
0.214 |
|
HER2-positive |
62 |
0.61 ± 0.11 |
33.35 (17.13, 47.43) |
36.94 ± 11.25 |
0.43 (0.29, 0.60) |
0.60 (0.39, 0.82) |
0.76 (0.50, 0.88) |
|
HER2-negative |
79 |
0.65 ± 0.11 |
24.60 (14.00, 39.70) |
38.30 (29.40, 50.38) |
0.25 (0.18, 0.42) |
0.47 (0.36, 0.68) |
0.56 ± 0.21 |
|
t/Z |
|
-2.365* |
-1.545** |
-0.879** |
-3.981** |
-1.649** |
-3.408** |
|
p-value |
|
0.019 |
0.122 |
0.380 |
< 0.001 |
0.099 |
0.001 |
|
Ki-67≥20% |
102 |
0.61 ± 0.11 |
27.62 (15.35, 43.90) |
38.45 (30.13, 46.58) |
0.40 (0.25, 0.57) |
0.58 (0.40, 0.85) |
0.62 ± 0.25 |
|
Ki-67<20% |
39 |
0.69 ± 0.09 |
32.20 (13.70, 43.70) |
33.60 (27.20, 48.50) |
0.23 (0.17, 0.32) |
0.40 (0.31, 0.57) |
0.62 (0.44, 0.88) |
|
t/Z |
|
-4.037* |
-0.343** |
-1.182** |
-4.420** |
-3.395** |
-0.484** |
|
p-value |
|
< 0.001 |
0.731 |
0.237 |
< 0.001 |
0.001 |
0.628 |
|
HER2-E |
26 |
0.53 ± 0.09 |
37.90 ± 19.37 |
37.11 ± 12.63 |
0.50 (0.37, 0.72) |
0.48 (0.39, 0.86) |
0.80 (0.57, 0.94) |
|
non-HER2-E |
115 |
0.65 ± 0.10 |
25.90 (14.00, 39.90) |
37.10 (28.60, 46.50) |
0.30 (0.20, 0.47) |
0.53 (0.36, 0.78) |
0.59 (0.40, 0.76) |
|
t/Z |
|
5.577* |
-1.996** |
-0.338** |
-3.886** |
-0.152** |
-3.559** |
|
p-value |
|
< 0.001 |
0.046 |
0.736 |
< 0.001 |
0.880 |
< 0.001 |
|
TNBC |
33 |
0.65 ± 0.11 |
33.50 (23.61, 60.24) |
42.70 (32.55, 57.35) |
0.36 ± 0.18 |
0.52 (0.41, 0.78) |
0.41 (0.33, 0.49) |
|
non-TNBC |
108 |
0.62 ± 0.11 |
24.25 (13.85, 40.28) |
34.65 (28.23, 45.68) |
0.35 (0.22, 0.53) |
0.50 (0.36, 0.79) |
0.71 (0.51, 0.83) |
|
t/Z |
|
-1.377* |
-2.474** |
-2.746** |
-0.575** |
-0.499** |
-5.135** |
|
p-value |
|
0.171 |
0.013 |
0.006 |
0.566 |
0.618 |
< 0.001 |
|
NPI-low grade |
33 |
0.69 ± 0.09 |
30.30 (14.70, 42.80) |
40.57 ± 16.23 |
0.23 (0.17, 0.36) |
0.39 ± 0.18 |
0.62 (0.42, 0.89) |
|
NPI-high grade |
108 |
0.61 ± 0.11 |
27.62 (14.63, 45.09) |
36.75 (29.40, 45.28) |
0.38 (0.24, 0.56) |
0.58 (0.41, 0.85) |
0.61 (0.43, 0.79) |
|
t/Z |
|
3.926* |
-0.005** |
-0.657** |
-3.460** |
-4.271** |
-0.472** |
|
p-value |
|
<0.001 |
0.996 |
0.511 |
0.001 |
< 0.001 |
0.637 |
|
*Independent-samples t-test; **Mann-Whitney U test. |
|||||||
Table II: ROC analysis of quantitative parameters predicting phenotypic subtypes and NPI (n = 141).
|
Parameters |
AUC |
95% CI |
Cut-off |
Sensitivity (%) |
Specificity (%) |
Accuracy (%) |
|
HER2-E VS non-HER2-E |
||||||
|
D |
0.806 |
0.723-0.890 |
0.589 |
80.8 |
72.2 |
85.1 |
|
Ktrans |
0.744 |
0.654-0.835 |
0.313 |
92.3 |
52.2 |
61.0 |
|
Ve |
0.724 |
0.619-0.829 |
0.767 |
61.5 |
78.3 |
67.4 |
|
D + Ktrans + Ve |
0.868 |
0.796-0.940 |
|
80.8 |
80.0 |
84.4 |
|
TNBC VS non-TNBC |
||||||
|
D* |
0.643 |
0.535-0.750 |
21 |
81.8 |
44.4 |
76.6 |
|
f |
0.658 |
0.547-0.769 |
55.2 |
33.3 |
94.4 |
78.7 |
|
Ve |
0.796 |
0.711-0.881 |
0.509 |
81.8 |
76.9 |
75.2 |
|
D* + f + Ve |
0.849 |
0.774-0.924 |
|
81.8 |
82.4 |
80.1 |
|
NPI |
||||||
|
D |
0.720 |
0.627-0.814 |
0.603 |
49.1 |
90.9 |
75.9 |
|
Kep |
0.746 |
0.658-0.834 |
0.419 |
73.2 |
66.7 |
78.0 |
|
D+Kep |
0.818 |
0.743-0.894 |
|
76.9 |
78.8 |
79.4 |
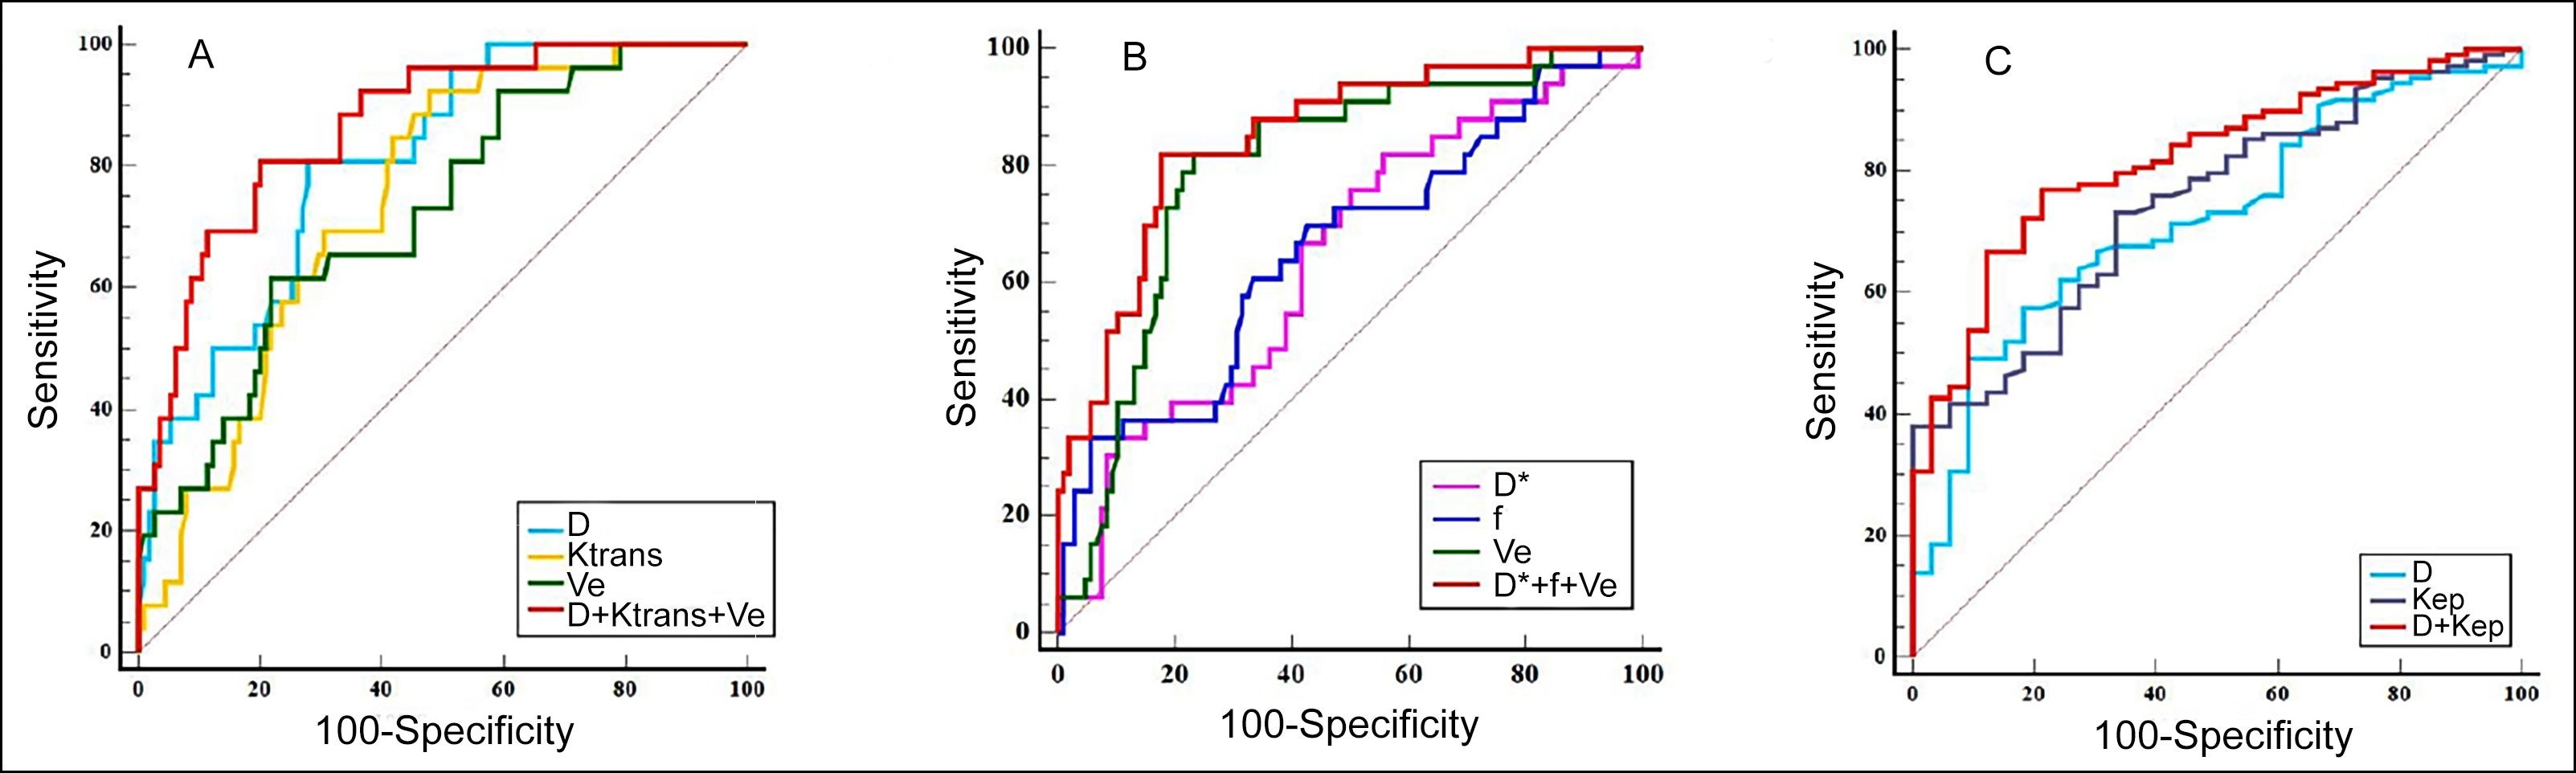 Figure 2: ROC curve analysis of different parameters. (A) Comparison of diagnostic efficacy of quantitative parameters for HER2-E. (B) Compari-son of diagnostic efficacy of quantitative parameters for TNBC. (C) Comparison of diagnostic efficacy of quantitative parameters for NPI.
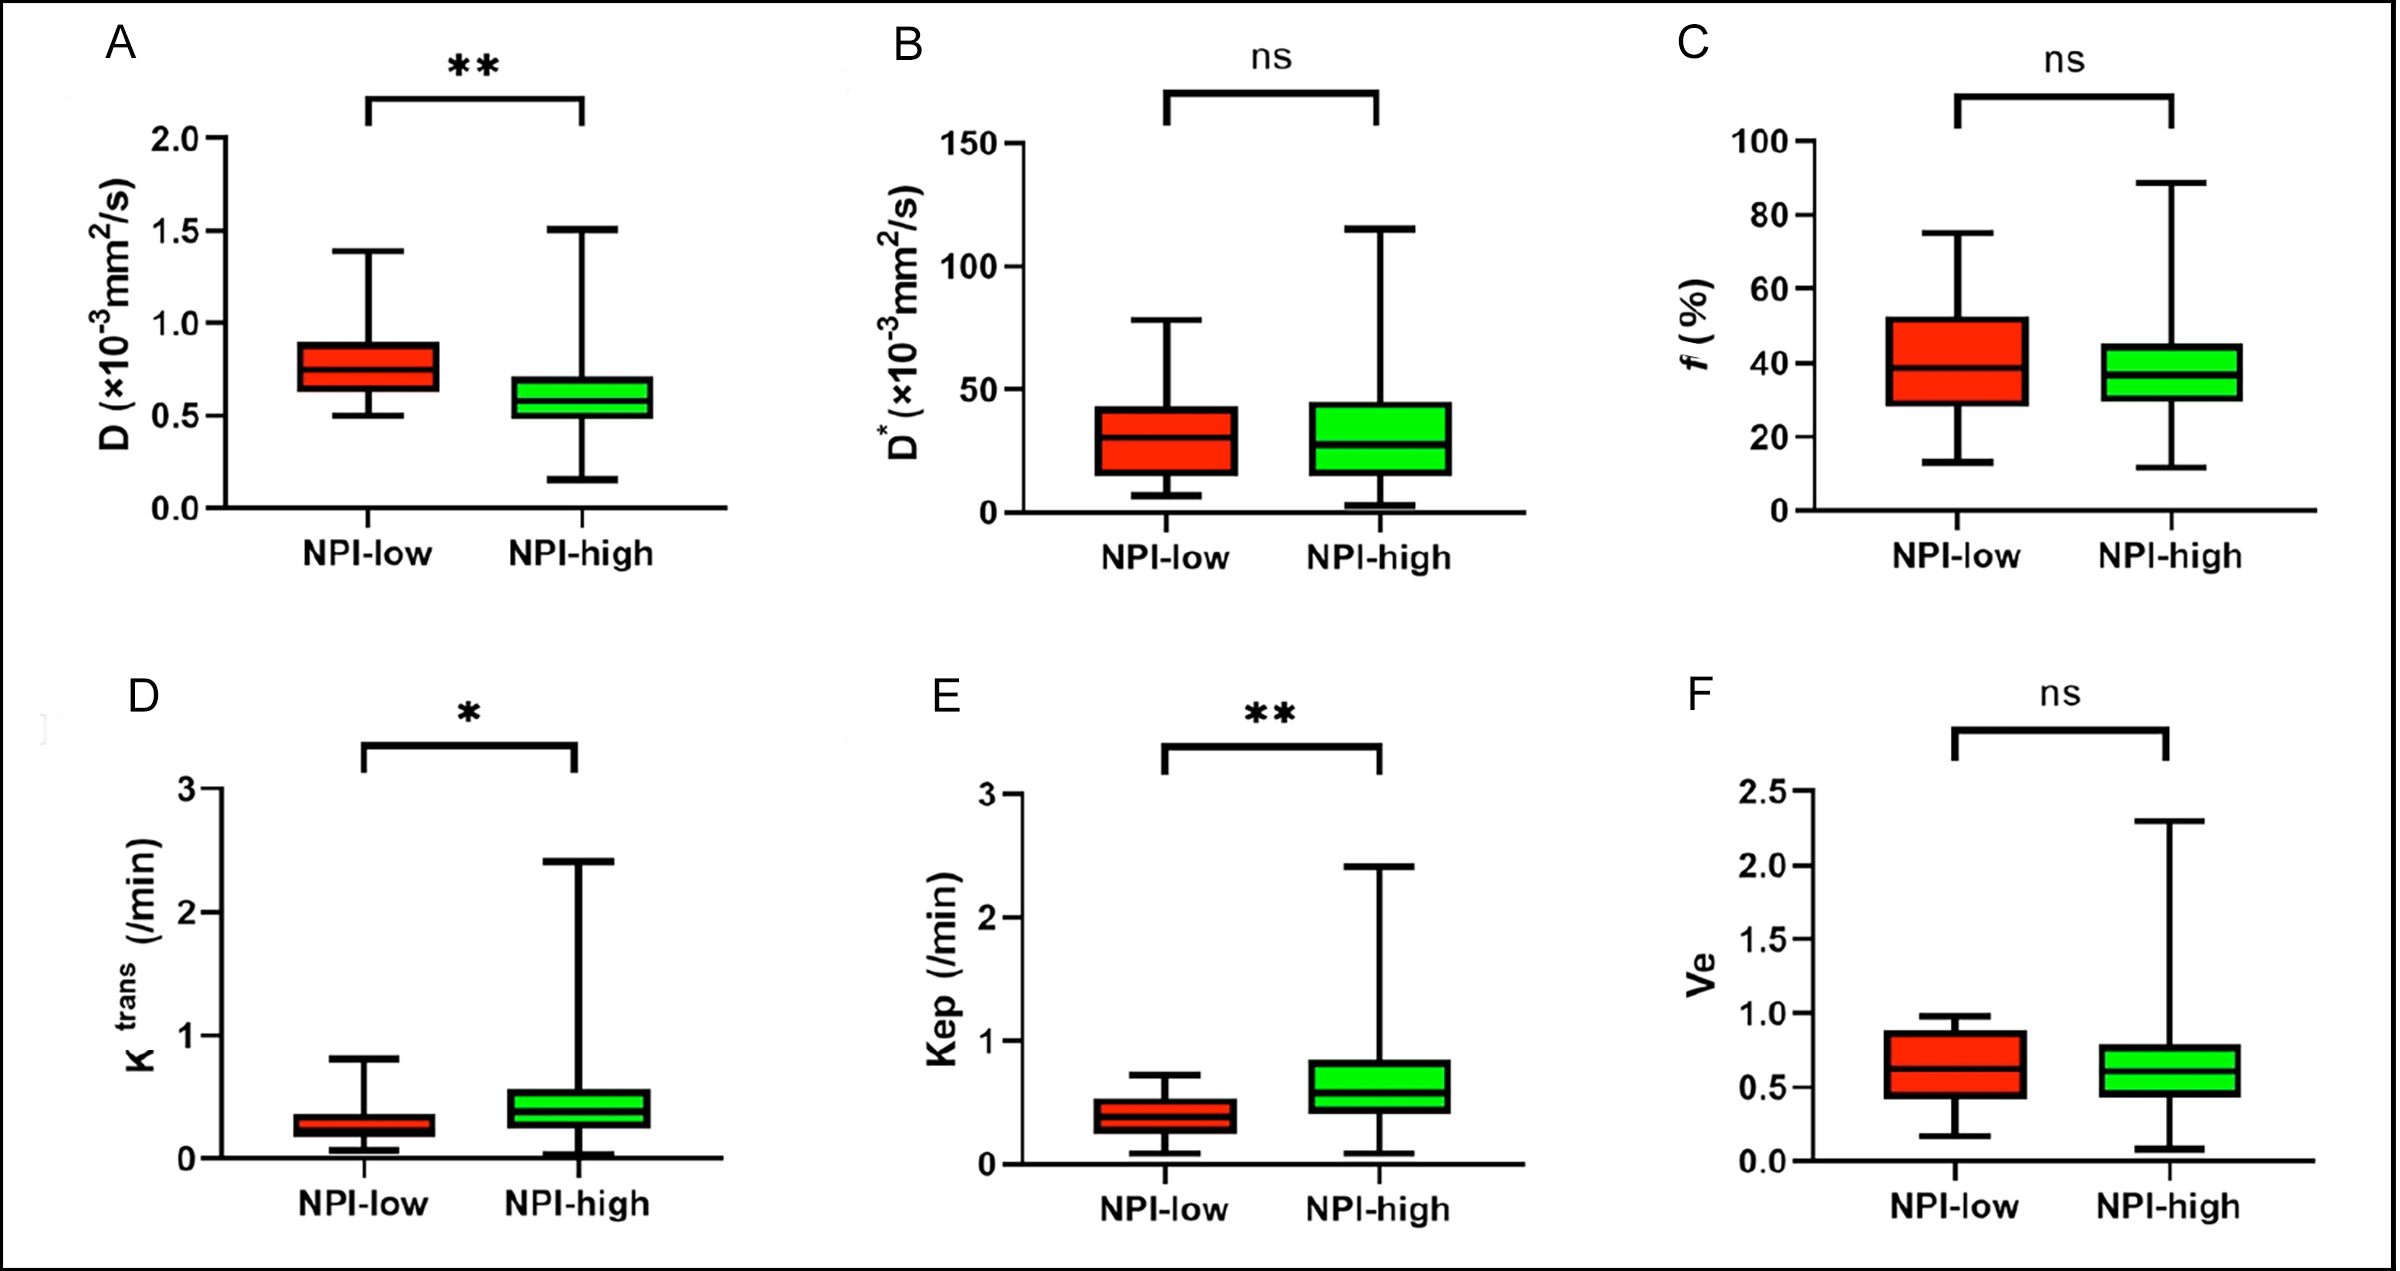 Figure 3 (A-F): Boxplots of D, D*, f, Ktrans, Kep, and Ve in differentiating NPI of breast cancer. *p < 0.01, **p < 0.001.
Logistic regression analysis demonstrated that D, Ktrans, and Ve showed robust diagnostic efficiency for predicting HER2-E. Meanwhile, D*, f, and Ve were resulted as significant predictors of TNBC.
For predicting HER2-E, the area under the ROC curve (AUC) of D + Ktrans + Ve was 0.868, which was significantly higher than that of D (Z = 2.451, p = 0.014), Ktrans (Z = 2.633, p = 0.009), and Ve (Z = 2.951, p = 0.003). D + Ktrans + Ve had a specificity of 80.0 %, which were higher than that of D*, Ktrans or Ve alone (Figure 2A and Table II).
For predicting TNBC, the AUC of Ve was 0.796, which was significantly higher than that of D* (Z = 2.086, p = 0.037) and f (Z = 1.994, p = 0.046). The AUC of D* + f + Ve for predicting TN subtype was 0.849, which was higher than that of D* (Z = 3.261, p = 0.001), f (Z = 3.774, p = 0.001), but has no difference from that of Ve (Z = 1.753, p = 0.080). D* + f + Ve had an accuracy of 80.1 %, which was higher than the D*, f or Ve alone (Figure 2B and Table II).
High-grade NPI group (NPI ≥ 3.4) had lower D and higher Ktrans and Kep values than those of the low-grade NPI group (NPI < 3.4) (p = 0.001, 0.001, and 0.001, respectively, Figure 3 and Table I).
Logistic regression analysis showed that D and Kep were resulted as significant predictors of NPI. The AUC of D + Kep (0.818) was higher than that of D (Z = 2.576, p = 0.010), and Kep (Z = 2.246, p = 0.025). D + Kep had a sensitivity of 76.9 % and an accuracy of 79.4 %, which was higher than those of D or Kep alone (Figure 2C and Table II)
Results showed that the validation cohort had excellent accuracies of 87.5 %, 87.5 %, and 87.5 %, respectively.
DISCUSSION
In this study, it was found that the parameters of IVIM and DCE-MRI can better predict phenotypic subtypes and NPI in breast cancer. D, Ktrans, and Ve were revealed as independent predicting factors for HER2-E. Meanwhile, D*, f, and Ve were shown as independent predicting factors for TNBC. Additionally, regarding the grade of NPI, D, and Kep showed excellent diagnostic efficiency for distinguishing low-grade NPI from high-grade group.
The detection of ER or PR has an important significance in determining the prognosis of breast cancer. ER has an inhibitory effect on the angiogenic pathway, thus reducing the vascular permeability,11 resulting in a lower Ktrans value, which is consistent with the results of the present study. In this research, D and D* derived from IVIM could be found as effective factors in identifying PR expression. However, Song et al. indicated that the parameters of IVIM had no significant correlation with the expression of PR.12 Therefore, further research on this issue is still necessary in the future. High expression of Ki-67 is closely associated with rapid proliferation of tumour cells and vascular permeability of tumours, which can result in accelerated reflux rate of contrast agents.13-15 Indeed, the D value decreased and Ktrans and Kep values increased in tumour tissues with high expression of Ki-67. However, Song et al. observed no significant correlation between Ki-67 and D value.12 The reason may be related to the limited number of samples, and inconsistent delineation of the ROI.
HER2, as a protein with the activity of tyrosine kinase, is an important indicator for predicting prognosis of breast cancer. The enrichment of HER2 is closely related to tumour aggressiveness, which can promote the growth of vascular endothelial factor in tumour tissues and increase the tumour’s aggressiveness, thus promoting tumour’s growth and transfer.16 The present authors found that HER2-E had lower D and higher D*, Ktrans, and Ve values compared with non-HER2-E, which is consistent with the result from Du and Uslu et al.17 The pathological basis is that neovascularisation, vascular permeability, and extracellular fluid are increased in HER2-E breast cancer. Previous studies demonstrated that HER2-E tumours manifested an increased f value compared with the other groups.17,18 However, the present study did not find statistical difference in f value between HER2-E and other groups, which is different from the above findings. This is probably because of the substantial heterogeneity of breast cancer and poor repeatability of f value between different machines.19 Thus, further studies are needed to improve reproducibility.
On the other hand, the authors found that TNBC exhibited higher D* and f values and lower Ve value compared with non-TNBC, which is similar to previous research.17 It is suggested that the tissue of TNBC has high capillary density and large microvascular perfusion. The compact and highly cellular environment may explain high D* and f values and low Ve value that is observed in aggressive cancers.20 However, the f value has poor reproducibility,20 D* value is susceptible to adjacent structures and motion artefacts,21 and Ve value is easily affected by oedema around the lesion. Whether these parameters can be used as predictors of TNBC is still controversial and needs further investigation in subsequent studies.
NPI is a clinicopathological scoring system widely used in primary breast cancer, which has important implications for the selection of treatment plans and prognostic evaluation. In the present study, the D value of the high-grade Nottingham group is lower than that of the low-grade Nottingham group, while Ktrans and Kep values are significantly higher in the high-grade Nottingham group than those in the low-grade Nottingham group. D value could be reflected in the density of tissue cells and true diffusion of water molecules after removing the effect of microcirculation perfusion.22 High Ktrans value is closely associated with high vessel number and poor prognosis of breast cancer. The Kep value is considered to indirectly reflect the discharge process of the contrast medium in the target tissue, which is related to the capillary permeability.23 Breast cancer with high grade of NPI demonstrates high proliferation of cells, decreased extracellular space (low D value) and high density of new capillary, increased perfusion of capillary (high Ktrans and Kep values). In the present study, Ktrans has significantly greater AUC than D in predicting the grade of NPI, which suggests that higher micro-perfusion might be a more important factor than lower water molecule diffusion in identifying the grade of NPI.
There are several limitations of this study. Firstly, the included number of HER2-E and TNBC was limited, which might influence the reliability of the statistical analyses. Secondly, most of the included breast cancer pathology types were invasive ductal carcinoma, which may have some impact on the reliability of the results, and other pathological types should be included in subsequent studies. Finally, the 2D-ROI delineated in the present study could not be sufficient to reflect the internal information of tumours. The authors will outline the 3D-ROI of each lesion and combine quantitative parameters with radiomics in future studies.
CONCLUSION
The parameters of IVIM and DCE-MRI have an important value in predicting phenotypic subtypes and NPI of breast cancer. The D has superior diagnostic performance for discriminating HER2-E and other genotypes. The Ve has a good value in the differential diagnosis of TNBC. The D and Kep are more valuable for judging the grade of NPI.
ETHICAL APPROVAL:
This study was approved by the institutional review board of the Affiliated Hospital of Jining Medical University (Approval number: 2021-C019).
PATIENTS’ CONSENT:
The informed consent from each patient was waived because of the instinctive characteristics of retrospection and anonymity.
COMPETING INTEREST:
The authors declared no competing interest.
AUTHORS’ CONTRIBUTION:
ZS, ZZ: Conception, design, acquisition of data, and drafting of manuscript.
LW, LZ, YC: Conception, design, and acquisition of data.
QL: Design of the work and critical revision of the manuscript.
All authors approved the final version of the manuscript to be published.
REFERENCES
- Sung H, Ferlay J, Siegel RL, Laversanne M, Soerjomataram I, Jemal A, et al. Global Cancer Statistics 2020: GLOBOCAN Estimates of incidence and mortality Worldwide for 36 Cancers in 185 Countries. CA Cancer J Clin 2021; 71(3): 209-49. doi:10.3322/caac.21609.
- Chen H, Li W, Wan C, Zhang J. Correlation of dynamic contrast-enhanced MRI and diffusion-weighted MR imaging with prognostic factors and subtypes of breast cancers. Front Oncol 2022; 12:942943. doi:10.3389/fonc.2022.942943.
- Xu AQ, Chu XF, Zhang SJ, Zheng J, Shi DB, Lv SS, et al. Prediction breast molecular typing of invasive ductal carcinoma based on dynamic contrast enhancement magnetic resonance imaging radiomics characteristics: A feasibility study. Front Oncol 2022; 12:799232. doi:10. 3389/fonc.2022.799232.
- Diana A, Franzese E, Centonze S, Carlino F, Della Corte CM, Ventriglia J, et al. Triple-negative breast cancers: Systematic review of the literature on molecular and clinical features with a focus on treatment with innovative drugs. Curr Oncol Rep 2018; 20(10):76. doi:10.1007/s11912-018-0726-6.
- Albergaria A, Ricardo S, Milanezi F, Carneiro V, Amendoeira I, Vieira D, et al. Nottingham prognostic index in triple-negative breast cancer: A reliable prognostic tool? BMC Cancer 2011; 11(1):299. doi:10.1186/1471-2407-11-299.
- Takahashi H, Oshi M, Asaoka M, Yan L, Endo I, Takabe K. Molecular biological features of nottingham histological grade 3 breast cancers. Ann Surg Oncol 2020; 27(11): 4475-85. doi:10.1245/s10434-020-08608-1.
- Grimm LJ. Breast MRI radiogenomics: Current status and research implications. J Magn Reson Imaging 2016; 43(6): 1269-78. doi:10.1002/jmri.25116.
- Dorrius MD, Dijkstra H, Oudkerk M, Sijens PE. Effect of b value and pre-admission of contrast on diagnostic accuracy of 1.5-T breast DWI: A systematic review and meta-analysis. Eur Radiol 2014; 24(11):2835-47. doi:10.1007/s00330- 014-3338-z.
- Zhang Q, Ouyang H, Ye F, Song Y, Xie LZ, Zhao XM, et al. Feasibility of intravoxel incoherent motion diffusion weighted imaging in distinguishing adenocarcinoma originated from uterine corpus or cervix. Abdom Radiol (NY) 2021; 46(2):732-44. doi:10.1007/s00261-020-02586-4.
- Ma ZS, Wang DW, Sun XB, Shi H, Pang T, Dong GQ, et al. Quantitative analysis of 3-Tesla magnetic resonance imaging in the differential diagnosis of breast lesions. Exp Ther Med 2015; 9(3):913-8. doi:10.3892/etm.2014.2154.
- Du F, Zheng FC, Han Y, Zhao JD, Peng Y. Novel immune-related gene signature for risk stratification and prognosis of survival in ER (+) and/or PR (+) and HER2 (-) breast cancer. Front Pharmacol 2022; 13:820437. doi:10.3389/fphar.2022.820437.
- Song SE, Cho KR, Seo BK, Woo OH, Park KH, Son YH, et al. Intra-voxel incoherent motion diffusion weighted MRI of invasive breast cancer: Correlation with prognostic factors and kinetic features acquired with computer-aided diagnosis. J Magn Reson Imaging 2019; 49(1):118-30. doi:10.1002/jmri. 26221.
- Liu L, Mei N, Yin B, Peng WJ. Correlation of DCE-MRI perfusion parameters and molecular biology of breast infiltrating ductal carcinoma. Front Oncol 2021; 11:561735. doi: 10. 3389/fonc.2021.561735.
- Li CP, Zheng MX, Zheng XM, Fang X, Dong JN, Wang CB, et al. Predictive Ki-67 proliferation index of cervical squamous cell carcinoma based on IVIM-DWI combined with texture features. Contrast Media Mol Imaging 2021; 2021:8873065. doi:10.1155/2021/8873065.
- Zhang K, Dai Y, Liu YJ, Tao J, Pan ZA, Xie LZ, et al. Soft tissue sarcoma: IVIM and DKI parameters correlate with Ki-67 labeling index on direct comparison of MRI and histopathological slices. Eur Radiol 2022; 32(8):5659-68. doi:10.1007/s00330-022-08646-1.
- Fogante M, Tagliati C, Lisa MD, Berardi R, Giuseppetti GM, Giovagnoni A. Correlation between apparent diffusion coeffi-cient of magnetic resonance imaging and tumorinfiltrating lymphocytes in breast cancer. Radiol Med 2019; 124(7): 581-7. doi:10.1007/s11547-019-01008-w.
- Uslu H, Onal T, Tosun M, Arslan AS, Ciftci E, Utkan NZ. Intravoxel incoherent motion magnetic resonance imaging for breast cancer: A comparison with molecular subtypes and histological grades. Magn Reson Imaging 2021; 78: 35-41. doi:10.1016/j.mri.2021.02.005.
- Zhao M, Fu K, Zhang L, Guo WH, Wu Q, Bai X, et al. Intra-voxel incoherent motion magnetic resonance imaging for breast cancer: A comparison with benign lesions and evaluation of heterogeneity in different tumor regions with prognostic factors and molecular classification. Oncol Lett 2018; 16(4):5100-12. doi:10.3892/ol.2018.9312.
- Iima M, Kataoka M, Kanao S, Onishi N, Kawai M, Ohashi A, et al. Intravoxel incoherent motion and quantitative non-gaussian diffusion MR imaging: Evaluation of the diagnostic and prognostic value of several markers of malignant and benign breast lesions. Radiology 2018; 287(2):432-41. doi:10.1148/ radiol.2017162853.
- Koo HR, Cho N, Song IC, Kim H, Chang JM, Yi A, et al. Correlation of perfusion parameters on dynamic contrast-enhanced MRI with prognostic factors and subtypes of breast cancers. J Magn Reson Imaging 2012; 36(1):145-51. doi:10.1002/jmri. 23635.
- He MZ, Ruan HP, Ma MP, Zhang ZS. Application of diffusion weighted imaging techniques for differentiating benign and malignant breast lesions. Front Oncol 2021; 11:694634. doi:10.3389/fonc.2021.694634.
- Liang JY, Zeng SH, Li ZP, Kong YN, Meng TB, Zhou CY, et al. Intravoxel incoherent motion diffusion-weighted imaging for quantitative differentiation of breast tumors: A meta-analysis. Front Oncol 2020; 10:585486. doi:10.3389/fonc. 2020.585486.
- Ni LP, Liu Y. Contrast-enhanced dynamic and diffusion weighted magnetic resonance imaging at 3.0 t to assess early-stage nasopharyngeal carcinoma. Oncol Lett 2018; 15(4):5294-300. doi:10.3892/ol.2018.7948.