Fifth Generation Quality Control of Immunoassay Parameters by Six Sigma Value
By Qurat ul Ain, Muhammad Younas, Zujaja Hina Haroon, Sobia Irum Kirmani, Muhammad Usman Munir, Muhammad AnwarAffiliations
doi: 10.29271/jcpsp.2023.06.679ABSTRACT
Objective: To determine the sigma value of immunoassay parameters which are within the 2Z score on external quality control (EQC).
Study Design: A cross-sectional study.
Place and Duration of the Study: Department of Chemical Pathology and Endocrinology (AFIP),non-ability ity consecutive from June to November 2022.
Methodology: Ten immunoassay parameters were selected on the basis of the internal quality control (IQC) and external quality control (EQC) programs. The Clinical Laboratory Improvement Amendments (CLIA) is used for Total Allowable Error (TEa). Sigma value was calculated from coefficient of variation (CV) and bias, which was determined by IQC and EQC, observed for 6 subsequent months. If the sigma values are ≥6, between 3 and 5, and <3, they are classified as good, acceptable or unacceptable, respectively.
Results: T4, prolactin, Vitamin B12 at >3 ó at IQC level 1. TSH, T3, T4, and Vitamin B12 showed that on level 2 IQC at >3 ó T3, Vitamin D at 4-5 ó level, Prolactin, FSH, and LH at 6 ó level in level 2 IQC. In the EQC program, the sigma level calculated for ten assays found that almost all parameters were at sigma >3 ó level except TSH which was at 5.8 ϭ level during June to August 2022. From September to November 2022, all parameters at >3 ó level except for TSH, growth hormone, FSH, LH, and Vitamin b12 which showed at 4.4 ó level.
Conclusion: Most of the immunoassay parameters show good performance in the EQC program and at both levels of IQC level with sigma value 4-5.
Key Words: Bias, Six sigma, Key performance indicators, External quality control.
INTRODUCTION
Clinical laboratory error can impose serious effect on patient’s diagnosis and management.1 Laboratory errors are categorised as preanalytical, analytical, and postanalytical. If there is bias and imprecision in the performance, it can easily lead to an error either systematic or random.2 Analytical performance indicators gauge through IQC and EQC, where both of these identify random and systematic error respectively. Total Errors can be identified in the basis of precision and coefficient of variation (CV %). To check how much existing quality control is stringent and effective, one should analyse the relationship between precision and bias with allowable error.3
Six sigma is a methodology applied to evaluate the quality control of clinical laboratories, as it overall measures defects per million, and process outcomes. It is a combination of bias, imprecision, and total allowable error that is how it is a more reliable and effective way of quality evaluation.4
In the Sigma method, calculation is based on total allowable error (TAE), bias and CV percentages Sigma method comprises of five stages that is described by two models. One of them is DAMIC model (Define, Analyse, Measure, Improve and Control), which is used for the existing system.
The Sigma system has different levels of evaluation about the quality of clinical laboratories. In the procedure, sigma at the third level is considered as that analyte has minimum quality standard, whereas sigma at the sixth level is considered to have the best performance and meet quality standards.5 Laboratory medicine needs to meet quality standards for reliable results by adopting the best quality assurance program. As analytical errors usually have a low frequency (about 10%) of total errors, and in order to further reduce such errors and to have monitoring on analytical error IQC programs are usually adopted by different laboratories.
Current IQC procedures used to evaluate the errors in clinical laboratories are not sufficient to meet the needs for quality and reliable results.6 A systematic and thorough assessment procedure is needed for the evaluation of quality assessment in clinical laboratories. Such a quality control program is needed for effective quality procedures and for that assessment, the ideal method is the six sigma method, which quantifies the performance of process and system as defects per million (DPM). Ideally, 3.4 per million is considered ideal and it can be detected at the six sigma value.7 To check the sigma value it is applied by evaluating quality indicators and assess errors in those specific quality indicators. This allows to assess and rectify the error which is highlighted by applying sigma value.8
The current study was conducted with the aim to assess and evaluate immunoassay parameters by sigma value and these results will identify gaps and modification of errors of clinical laboratory.
METHODOLOGY
This cross-sectional study was conducted from June 2022 to November 2022 in the Chemical Pathology Department at Armed Forces Institute of Pathology (AFIP) Rawalpindi, after getting approval from the institutional review board of AFIP. Ten routine parameters of immunoassay analysed on ADVIA centaur XPT based on chemiluminescence principle including vitamin D, human growth hormone (HGH), vitamin B12, thyroid stimulating hormone (TSH), total T3, free T4, follicle-stimulating hormone (FSH), luteinizing hormone (LH), prolactin, and testosterone. All assays reagents, controls and calibrators were obtained from the manufacturer. EQC material was received from Biorad in the lyophilized form which was prepared by dissolving 5ml of deionized water in the sample received and analysed for ten assays consecutive for six months of duration. These parameters are analysed on daily basis by chemiluminescence principle on fully automated immunoassay (Advia XPT).
lQC Biorad was used for daily runs, while all reagents are from Siemen and used as per manufacturer package insert and instructions. IQC of two levels (normal and pathological) were analysed before patients sample process. An inclusion criterion was IQC value following Westgard rule while immunoassay EQC results parameters result follow <2 Z score. Outliers or above 2 standard deviation or >2 Z score values were excluded for set parameters.
EQAS results were observed for 6 consecutive months for analysis of bias. The total sample size for 10 parameters for 6 cycle, was 60.9 The parameters used for analysis of sigma value were mean, standard deviation, coeffiecnt of variation (CV%), bias and sigma value, while peer mean was observed in the EQAS result. For total allowable error (TAE) followed Clinical laboratory improvement amendment 88(CLIA). Bias was determined by calculation (% Bias=Lab mean –peer mean/Peer mean*100) for EQC and for IQC.10
Sigma metric calculation was done by the formula: Ó=TAE%-BIAS%/%CV. Sigma value <3 was considered as poor performance while sigma value >3 was considered as satisfactory performance. Quality goal index (QGI) was also calculated to check whether low sigma value is due to precision or accuracy, as bias/1.5*CV%. QGI value of <0.8 indicated that the precision of the analyte needs to be improved; if QGI value was >1.2 accuracy needs to be prioritised and if QGI is between 0.8 and 1.2 both accuracy and precision is matter of attention.11
Data were entered in Microsoft Excel for calculation of bias, % bias, and average mean. Data were plotted on medical decision limit plot for assessment of the status of assays results.
RESULTS
Manufactured mean, laboratory mean, CV %, bias %, sigma value, and QGI of both levels of internal quality control calculated TSH, T3, T4, Prolactin, FSH, LH, Vitamin B12, Vitamin D, growth hormone, and testosterone are shown in Table I.
TEa was taken from CLIA while CV%, bias %, sigma and QGI of external quality control are shown in Tables II and III.
Sigma calculation of IQC showed that T4, prolactin, Vitamin B12 at >3 Ó at IQC level 1 while TSH, T3, T4 and Vitamin B12 showed that on level 2 IQC at >3 Ó while T3, Vitamin D at 4 Ó (level 1) and 5 Ó (level 2) Ó level and Prolactin, FSH, LH at 6 Ó at both IQC level.
In EQC, the sigma level was calculated for ten assays, almost all parameters were at sigma >3 Ó level except TSH which was at 5.8 Ó level during June to August 2022. From September – November 2022, all parameters were at >3 ϭ level except TSH, growth hormone, FSH, LH and vitamin B12 which showed values at 4.4 Ó level.
Figure 1 showed comparison of IQC and EQC sigma value calculation. It represent that IQC level 1 showed three parameters has sigma metric at 6 and IQC level 2 showed sigma metric of four parameters is 6.
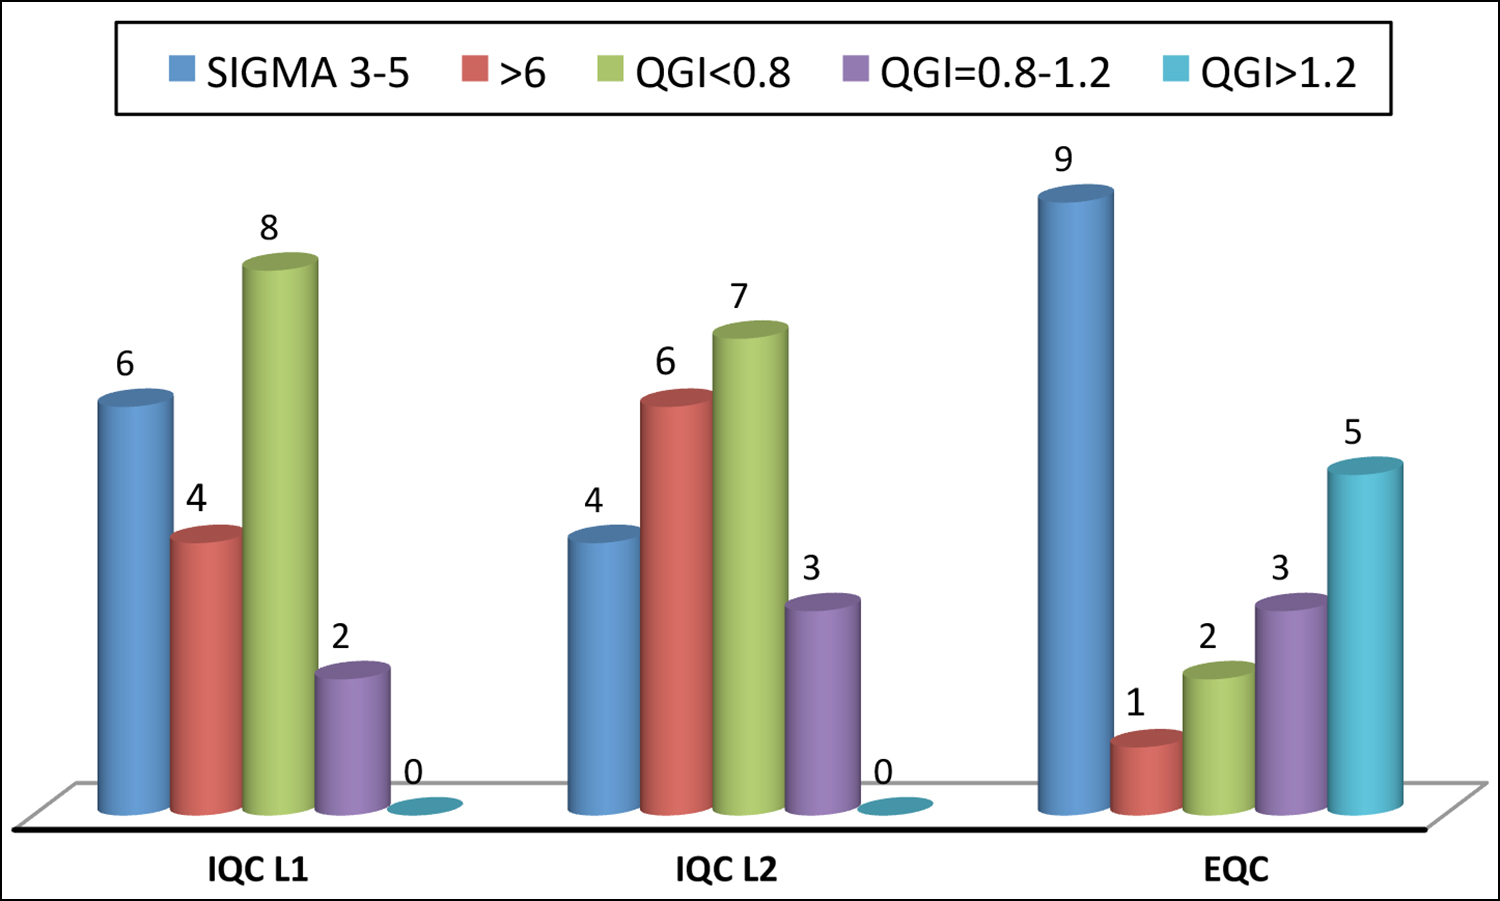 Figure 1: Comparison of IQC at the both levels (L1+L2) and external quality control program.
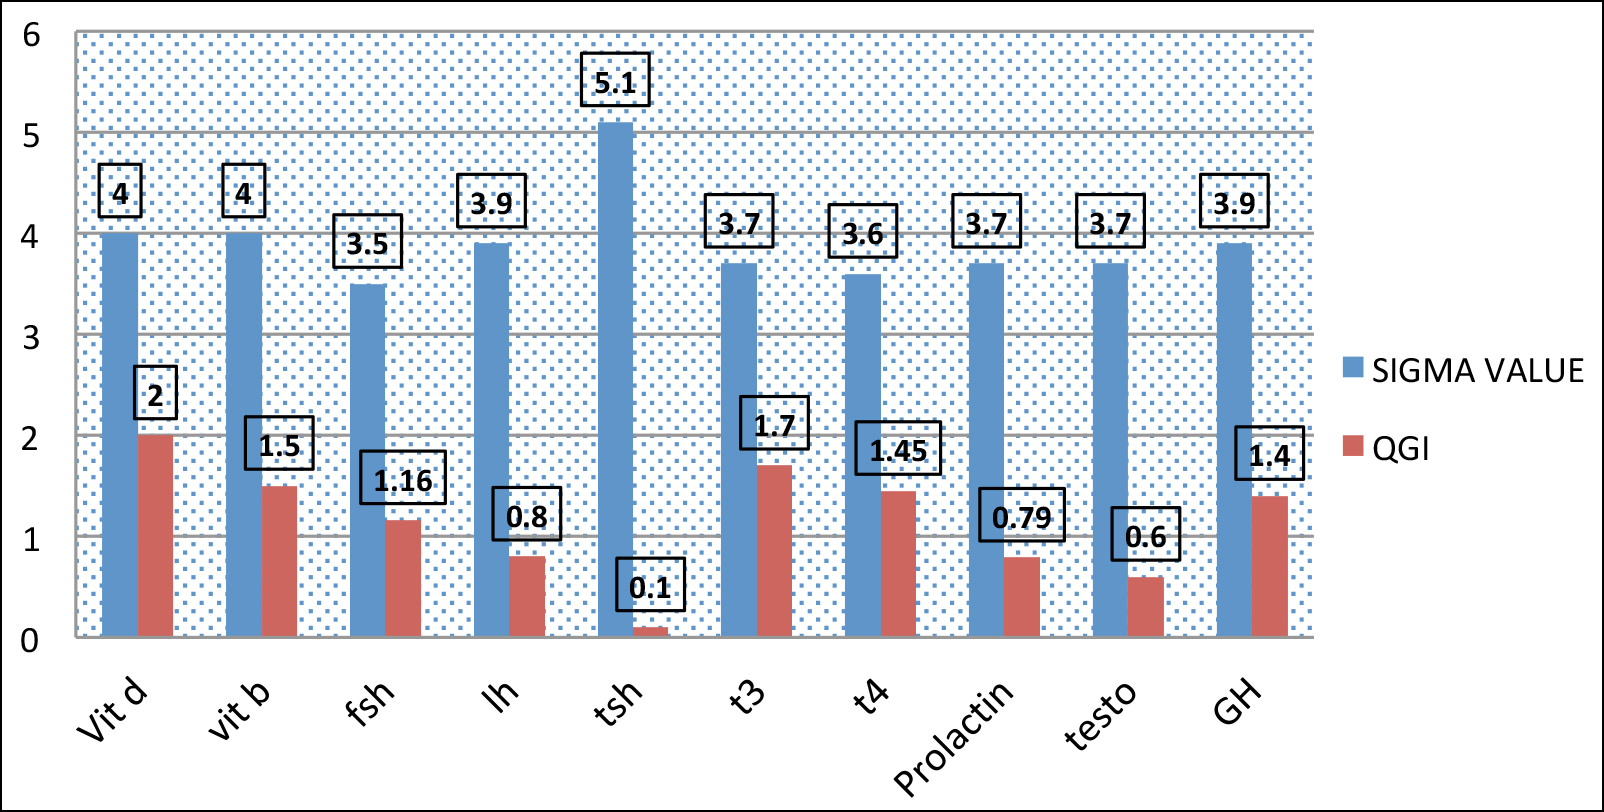 Figure 2: QG1 AND Sigma value on EQAS.
Table I: Mean+/- SD, coefficient of variation%, Bias% and sigma value of both levels of internal quality control.
|
Analyte |
Average IQC1 |
Average IQC 2 |
||||||||||
|
|
Mean (Man) |
Mean Lab |
Bias% |
CV% |
sigma |
QGI |
Mean (Man) |
Mean Lab |
Bias% |
CV% |
Sigma |
QGI |
|
TSH |
2.15 |
2.20 |
2.3 |
3.3 |
3.0 |
0.40 |
21.00 |
21.78 |
3.7 |
4.33 |
3.5 |
0.56 |
|
T3 |
3.73 |
3.8 |
1.8 |
3.5 |
5.1 |
0.34 |
6.79 |
6.84 |
0.74 |
3.32 |
3.1 |
0.14 |
|
T4 |
20.98 |
21.21 |
1.0 |
9.0 |
3.9 |
0.07 |
41.99 |
42.50 |
1.21 |
4.23 |
3.9 |
0.19 |
|
Prolactin |
535 |
533 |
0.37 |
6.7 |
3.5 |
0.03 |
895 |
889.61 |
0.60 |
3.11 |
>6 |
N/A |
|
FSH |
35.59 |
36.66 |
3.0 |
6.5 |
>6.0 |
N/A |
82.32 |
82.42 |
0.12 |
1.22 |
>6 |
N/A |
|
LH |
35.35 |
35.50 |
0.42 |
1.73 |
>6.0 |
N/A |
50.66 |
50.39 |
0.53 |
3.99 |
6.1 |
N/A |
|
Vitamin B12 |
438.56 |
406.18 |
7.3 |
6.11 |
3.2 |
0.79 |
750.22 |
699.15 |
5.8 |
4.63 |
3.5 |
0.59 |
|
Vitamin D |
79.42 |
78.44 |
1.23 |
5.9 |
4.0 |
0.13 |
140.0 |
139.16 |
2.76 |
4.33 |
5.1 |
0.42 |
|
Growth Hormone |
19.05 |
19.30 |
2.7 |
1.98 |
6.0 |
N/A |
44.54 |
45.77 |
2.7 |
3.12 |
5.6 |
N/A |
|
Testosterone |
13.48 |
13.69 |
1.5 |
4.24 |
5.5 |
N/A |
25.10 |
24.4 |
2.7 |
3.32 |
6.7 |
N/A |
Table II: Mean+/- SD, coefficient of variation%, Bias% and sigma value of external quality control program (June – August 2022).
|
Analyte |
June 2022 |
July 2022 |
August 2022 |
Aver Bias |
Ave sigma |
Av QGI |
|||||||
|
TAE |
Bias |
CV% |
Sigma |
Bias |
Cv% |
Sigma |
Bias |
Cv% |
Sigma |
||||
|
Vitamin D (nmol/L) |
25% |
3.2 |
4.5 |
4.8 |
4.9 |
3.2 |
4.5 |
2.2 |
10.3 |
4.2 |
16.3 |
4.5 |
1.2 |
|
Vitamin B12 (Pmol/L) |
25% |
8.9 |
2.87 |
5.6 |
3.5 |
8.44 |
2.5 |
4.54 |
8.44 |
2.1 |
7.8 |
3.6 |
1.8 |
|
Prolactin (Uiu/ml) |
25% |
3.7 |
3.64 |
5.8 |
2.75 |
5.36 |
3.9 |
3.59 |
5.81 |
2.5 |
7.3 |
3.7 |
0.79 |
|
Growth Hormone (Uiu/ML) |
20% |
6.8 |
3.18 |
5.7 |
2.38 |
4.74 |
4.2 |
4.71 |
4.3 |
3.8 |
3.9 |
3.9 |
1.4 |
|
Follicle stimulating hormone (miu/ml) |
25% |
1.1 |
4.90 |
4.8 |
3.3 |
7.1 |
2.4 |
3.0 |
5.9 |
3.0 |
5.8 |
3.1 |
1.13 |
|
Luteinizing Hormone (miu/ml) |
25% |
2.73 |
3.65 |
6.1 |
2.25 |
7.09 |
3.5 |
3.21 |
5.30 |
3.4 |
8.0 |
3.3 |
1.0 |
|
Testosterone (nmol/L) |
25% |
3.75 |
4.38 |
4.8 |
2.04 |
3.96 |
4.1 |
4.15 |
10.9 |
2.4 |
8.6 |
3.8 |
0.6 |
|
TSH (miu/ml) |
3SD |
1.16 |
1.34 |
4.5 |
3.33 |
3.86 |
3.1 |
2.37 |
3.31 |
3.8 |
2.28 |
5.8 |
1.0 |
|
T3 Total (nmol/l) |
3SD |
2.7 |
2.57 |
4.0 |
2.65 |
6.01 |
3.2 |
4.86 |
4.19 |
4.5 |
4.07 |
3.9 |
1.3 |
|
T4 free (pmol/l) |
3SD |
1.08 |
0.81 |
3.9 |
0.93 |
7.05 |
3.0 |
4.74 |
6.29 |
5.8 |
3.9 |
3.5 |
1.1 |
Table III: Mean+/- SD, coefficient of variation%, Bias% and sigma value of external quality control program (September - November 2022).
|
Analyte |
September 2022 |
October 2022 |
November 2022 |
Average Bias |
Average sigma |
Av QGI |
|||||||
|
TAE |
Bias |
CV% |
Sigma |
Bias |
Cv |
Sigma |
Bias |
Cv% |
Sigma |
||||
|
Vitamin D (nmol/L) |
25% |
2.28 |
6.6 |
3.4 |
1.9 |
10.7 |
3.6 |
6.7 |
5.0 |
3.6 |
3.6 |
3.5 |
2.9 |
|
Vitamin B12 (Pmol/L) |
25% |
1.53 |
4.56 |
5.2 |
2.6 |
6.7 |
4.0 |
3.3 |
5.3 |
4.0 |
2.4 |
4.4 |
1.3 |
|
Prolactin (Uiu/ml) |
25% |
9.67 |
2.47 |
3.77 |
6.1 |
4.7 |
3.6 |
7.8 |
4.7 |
3.6 |
7.8 |
3.7 |
0.8 |
|
Growth Hormone (Uiu/ML) |
20% |
0.73 |
5.26 |
4.65 |
6.0 |
5.4 |
3.1 |
3.6 |
3.6 |
4.5 |
4.1 |
4.0 |
2.5 |
|
Follicle stimulating hormone (miu/ml) |
25% |
6.76 |
5.22 |
3.49 |
2.7 |
5.3 |
4.4 |
1.9 |
5.2 |
4.4 |
3.7 |
4.0 |
1.2 |
|
Luteinizing Hormone (mIU/ml) |
25% |
3.90 |
6.37 |
3.4 |
8.7 |
6.3 |
5.1 |
1.8 |
4.5 |
5.1 |
4.8 |
4.5 |
0.7 |
|
Testosterone (nmol/L) |
25% |
1.12 |
6.10 |
3.9 |
7.7 |
4.2 |
3.4 |
4.2 |
5.6 |
3.7 |
4.3 |
3.6 |
1.1 |
|
TSH (mIU/ml) |
3SD |
5.47 |
4.02 |
5.7 |
5.4 |
4.6 |
3.4 |
2.3 |
4.4 |
4.1 |
5.0 |
4.5 |
1.5 |
|
T3 Total (nmol/l) |
3SD |
3.12 |
6.42 |
2.8 |
2.1 |
3.3 |
4.1 |
4.6 |
5.3 |
3.9 |
3.2 |
3.6 |
2.1 |
|
T4 free (pmol/l) |
3SD |
2.23 |
5.82 |
2.7 |
4.1 |
4.7 |
4.9 |
7.1 |
4.0 |
3.8 |
4.4 |
3.8 |
1.8 |
Figure 2 showed relevance of quality goal index and sigma value, low QGI index showed high sigma value while parameters >0.8 QGI with low sigma showed that laboratory focused on precision error of prolactin, testosterone and LH on EQC. QGI between 0.8-1.2 showed imprecision and accuracy error; the parameters needed to be focused in this perspective were LH, FSH, testosterone and T4. QGI >1.2 showed that most probably inaccuracy was the cause of low sigma value of T3. TSH,Vit D, growth hormone and Vit B12.
DISCUSSION
A quality control program design is based on the protocols and guidelines defined by national authorization bodies nevertheless good laboratory practices proved that every individual laboratory should customise own quality control program based on the international and national accreditation bodies guidelines.12 Good laboratory practices should base on the sigma value because it can help in reducing laboratory errors and make them able to get more reliable and quality work with more efficacies.9
In the current study, sigma value is calculated for individual parameters for both levels of controls and from proficiency testing and used EQAS in this study. This correlate with the study conducted by Kumar and Mohan et al. who also used bias calculation and CV% taken from internal quality control and EQC value for that respective analyte.13
Sigma scale defines and gives instructions for choosing Westgard rules and at what level of IQC process is required and how frequent it should be given. Sigma scale 6 and above showed that it is good quality parameter and showed excellent performance that is why it needs to be evaluated with one level of qc level in 24 hours. In the current study, the FSH, LH, testosterone, and prolactin showed excellent performance on both levels of IQC so it can be evaluated once in 24 hours with one level of control level.14 Sigma value of 4-6 implies multiWestgard rule evaluation with two levels of control once in 24 hours and it shows acceptable performance. In the current study, vitamin B12, TSH, T3, T4 showed sigma value between 4-6 on both levels of IQC while Vitamin B12, TSH, T3, T4 and growth hormone showed that on external quality control. This is considered acceptable performance that is why two levels of control assessed once in 24 hours and consider the Westgard rule of 13s, R4s, and 22s. Rentapalli et al. conducted a study on internal quality control results. Only two parameters were at level six while others all are in the acceptable range and the reason of only two parameters at level six was because of continuous instrument troubleshooting and open channel kits usage.13 In the current study, quality performance is assessed by sigma value which showed it to be a reliable quality tool to evaluate further how quality process is affecting on quality because it computes the outcome of process and that is why it is considered as good analytical quality tool.15
Limitation of this study were that it was conducted in a single clinical chemistry laboratory. It should be applicable on all subspecialties for good analytical performance checks. Some hormones showed low sigma values with CV% lying with in total allowable error limits. It should be applied on all phases like preanalytical, postanalytical phases of laboratories to enhance quality work. In the current study, only ten parameters were assessed on sigma metrics which was also a limitation of the study, it should be expanded to all laboratory parameters and improvement of QC management after the sigma evaluation. Sigma value assessment should correlate with clinical feedback and end-users’ feedback. Assessment of the quality process of ten immunoassay parameters is a breakthrough for better quality evaluation.
CONCLUSION
When the analytical performance was evaluated according to Six-Sigma levels, it was generally found as good. TSH, T3, T4, Prolactin and growth hormone parameters showed satisfactory performance with sigma score between 4-6 on IQC at both levels while FSH, LH, and Testosterone showed level 6 sigma metric which is good performance on IQC both levels while vitamin B12 and Vitamin D showed performance at 3 sigma level in EQC results. The difference in both IQC and EQC level need to evaluate QC management on sigma value for further improvement.
ETHICAL APPROVAL:
Ethical approval was obtained before the initiation of research work from the Armed Forces Institute of Pathology (AFIP).
PATIENTS’ CONSENT:
Current study was conducted on quality control material, it doesn’t involve patient and for use of quality control material (external and internal) Institutional board review has been conducted and permitted for use of material for study. For current study consent form was not necessary.
COMPETING INTEREST:
The authors declared no competing interest.
AUTHORS’ CONTRIBUTION:
QA: Writing and idea.
MY: Review and literature.
ZHH: Proofreading and data analysis.
SIK: Literature review.
UM: Data analysis and result.
MA: Review discussion and proofreading.
All the authors have approved the final version of the manuscript to be published.
REFERENCES
- Toboc A, Stan C, Stănescu AC, Ionică M. Performance evaluation of immunoassay methods using innovative Westgard method decision chart/six sigma: metric tool. In Adv Topics Optoelectronics 2018; 10977:pp.817-22. doi.org/10.1117/ 12.2324859.
- Randell EW, Short G, Lee N, Beresford A, Spencer M, Kennell M, et al. Autoverification process improvement by six sigma approach: Clinical chemistry and immunoassay. Clinical Biochemistry 2018; 55:42-8. doi: 10.1016/j.clinbiochem. 2018.03.002.
- Rentapalli BR, Ganji SB, Sulemani MD. Target score of riqas and sigma value for evaluating the analytical performance of thyroid function testing on ADVIA centaur XPT immunoassay analyser. J Evolution Med Dental Sci 2019; 8(7): 447-51.
- Agarwal S, Gallo JJ, Parashar A, Agarwal KK, Ellis SG, Khot UN, Spooner R, Tuzcu EM, Kapadia SR. Impact of lean six sigma process improvement methodology on cardiac catheterization laboratory efficiency. Cardiovascular Revascularisation Med 2016; 17(2):95-101. doi: 10.1016/j.carrev.2015. 12.011.
- Westgard S, Bayat H, Westgard JO. Analytical Sigma value: A review of six sigma implementation tools for medical laboratories. Biochemia Medica 2018; 28(2):174-85. doi: 10. 11613/BM.2018.020502.
- Westgard JO, Westgard SA. Six sigma quality management system and design of risk-based statistical quality control. Clin Labor Med 2017; 37(1):85-96. doi: 10.1016/j.cll.2016. 09.008.
- Kalra J, Kopargaonkar A. Quality improvement in clinical laboratories: A six sigma concept. Pathol Labor Med 2016; 1(1):11-20.
- Lippi G, Plebani M. A Six-Sigma approach for comparing diagnostic errors in healthcare-where does laboratory medicine stand? Ann Transl Med 2018; 6(10).180. doi: 10.21037/atm.2018.04.02.
- Nar R, Emekli DI. The evaluation of analytical performance of immunoassay tests by using six-sigma method. J Med Biochem 2017; 36(4):301-8. doi: 10.1515/jomb-2017-0026.
- Thienpont LM. Calculation of measurement uncertainty-Why bias should be treated separately. Clin Chem 2008; 54(9): 1587-8. doi: 10.1373/clinchem.2008.107797.
- Goel P, Malik G, Prasad S, Rani I, Manhas S, Goel K. Analysis of performance of clinical biochemistry laboratory using sigma value and quality goal index. Prac Lab Med 2021; 23:e00195. doi: 10.1016/j.plabm.2020.e00195.
- Nanda SK, Ray L. Quantitative application of sigma value in medical biochemistry. J Clinical Diagn Res 2013; 7(12): 2689. doi: 10.7860/JCDR/2013/7292.3700.
- Kumar BV, Mohan T. Sigma value as a tool for evaluating the performance of internal quality control in a clinical chemistry laboratory. J LabPhysicians 2018; 10(2):194. doi: 10. 4103/JLP.JLP_102_17.
- Aggogeri F, Gentili E. Six Sigma methodology: An effective tool for quality management. Int J Manufact Technol Manag 2008; 14(3-4):289-98.
- Marques PA, Requeijo JG. SIPOC: A six sigma tool helping on ISO 9000 quality management systems. In XIII Congreso de Ingeniería de Organización 2009; pp.1229-1238.