Lox as the Potential Key Gene of Clear Cell Renal Carcinoma
By Yanru Chen1, Zhangzhe Yan2, Yanping Su1, Shang Zhao3Affiliations
doi: 10.29271/jcpsp.2022.05.632ABSTRACT
Clear cell renal carcinoma (CCRC) is the most common type of renal carcinoma. We hope to find out the potential key genes playing important roles in CCRC genesis and progression by analysing the recent expression profiling by array from 2014 to 2016. In order to find out the differentially expressed genes (DEGs) between CCRC and normal renal tissue. Gene Ontology (GO) and Kyoto Encyclopedia of Genes, and Genomes (KEGG) pathway enrichment were carried out by the Database for Annotation, Visualization and Integrated Discovery (DAVID) v6.8. Protein-Protein Interaction (PPI) Networks Functional Enrichment Analysis of these DEGs was analyzed using the Search Tool for Recurring Instances of Neighbouring Genes (STRING). The results were then visualized by the software Cytoscape. The authors also used the online tool of Kaplan–Meier plotter survival analysis to assess the significance of the top ten genes in the prognosis of CCRC. A total of 192 DEGs were identified and the top ten key genes were picked out by the software Cytoscape. FN1, CXCR4, LOX, and PLG were then further screened out based on the overall survival analysis; SLC12A1 and LOX were screened out after the recurrence-free survival analysis. LOX was finally believed to be the most reliable prognostic factor since it has prognostic value for both overall survival and recurrence-free survival analysis. Our analysis suggests that LOX is the most reliable prognostic factor for CCRC patients.
Key Words: Renal clear cell carcinoma, Microarray datasets, Bioinformatics approach, Prognostic factor, LOX.
INTRODUCTION
Clear cell renal carcinoma (CCRC) is the most common subtype of renal carcinoma and accounts for about 75% of renal carcinoma.1 About 210,000 new cases occur globally each year.2 Although breakthroughs have been made in various aspects of CCRC in recent years, the early screening and late prognosis of CCRC patients is still poor.3 From a global perspective, the incidence of RCC varied geographically with the highest incidence in developed countries and significantly growing incidence in developing countries year by year.4-6 Although the detection rate of early CCRC has increased significantly with the development of imaging technology, there are still 30% of patients with CCRC who have entered the advanced stage when they are diagnosed.7
In this study, the authors tried to seek novel CCRC potential key genes in CCRC patients. In order to find out the differentially expressed genes (DEGs) between CCRC and normal kidney tissues, bioinformatics technology GEO2R (https://www. ncbi.nlm.nih. gov/geo/geo2r) was applied to analyze the gene expression profiling by microarray downloaded from the Gene Expression Omnibus (GEO) database (https://www.ncbi.nlm.nih.gov/geo/). The intersection part of the five gene expression profiles was identified by the Venn diagram online tool (http:// bioinformatics.psb.ugent.be/webtools/Venn/). Gene Ontology (GO) functional annotation analysis and Kyoto Encyclopedia of Genes and Genomes (KEGG) pathway enrichment analysis were carried out for the screened DEGs by the Database for Annotation, Visualization and Integrated Discovery (DAVID) tools (https://david.ncifcrf.gov/). Then, a protein–protein interaction (PPI) network was created on The Search Tool for the Retrieval of Interacting Networks Genes (STRING) database (http://string-db.org/) and key genes related to CCRCs were identified by Cytoscape software (http://www.cytoscape.org/). The overall survival and recurrence-free survival analysis of these key genes were further screened out using the online Kaplan–Meier plotter tool (http://kmplot.com/analysis/).
METHODOLOGY
The analysed gene expression datasets in this research were from the GEO database. The authors found totally 249 series about human CCRC from this database. After repeated deliberation, 5 gene expression profiles (GSE53757, GSE46699, GSE66272, GSE68417 and GSE65194) were picked out whose basic information is shown in Figure 1. Among them, GSE53757, GSE46699, and GSE66272 were from the GPL570 ([HG-U133_Plus_2] Affymetrix Human Genome U133 Plus 2.0 Array); GSE68417 was from GPL6244 ([HuGene-1_0-st] Affymetrix Human Gene 1.0 ST Array); and GSE71963 was from GPL6480 (Agilent-014850 Whole Human Genome Microarray 4x44K G4112F). All these data can be freely downloaded online.
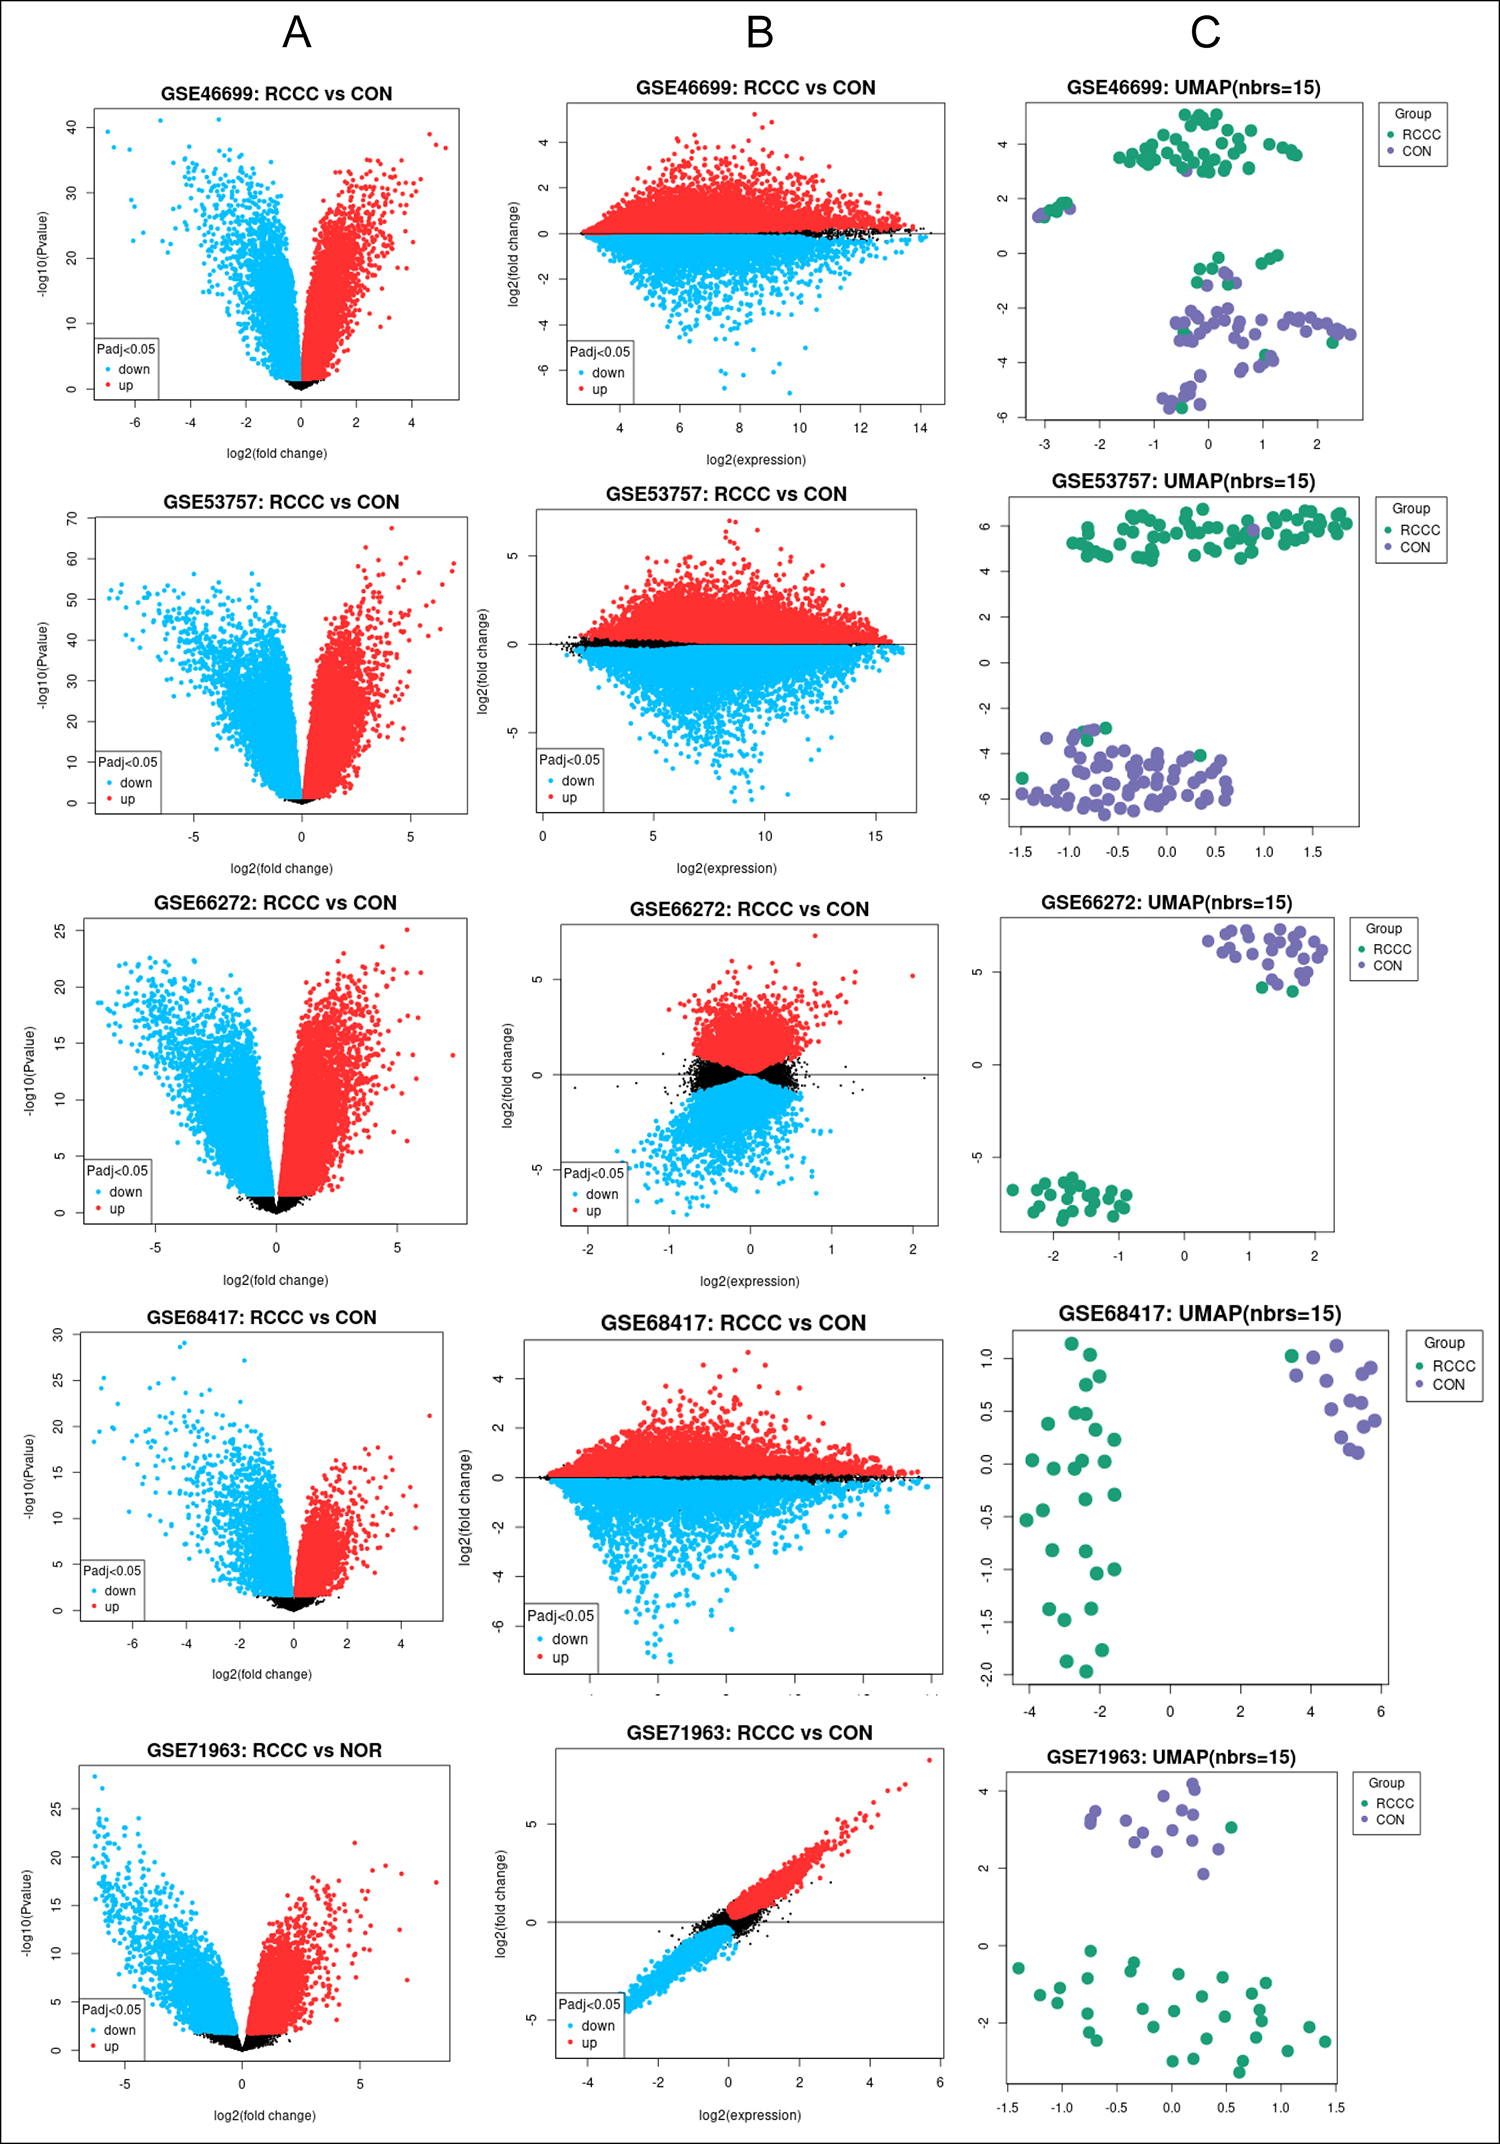
Figure 1: This picture shows the basic information about 5 gene expression profiles selected from the GEO datasets profiles. All are freely downloaded online. (A) Volcano plots show statistical significance versus a range of change. Blue dots mean downregulated genes and red dots imply upregulated genes. (B) Mean difference plots display log2 fold alteration versus mean log2 values of expression. Blue dots mean downregulated genes and red dots imply upregulated genes. (C) Uniform manifold approximation and projection (UMAP) is a dimensionality reduction technique for visualising the relationship between samples. The figure shows the number of nearest neighbors used in the calculation.
The online GEO2R analysis tool was used to screen the DEGs between CCRCs and normal tissues. GEO2R is a shared online tool permitting researchers to identify DEGs by comparing two or more series of specimens in the GEO series.GEO2R uses the GEO query and Limmar packages of the Bioconductor project to compare the data provided by the original committer. During this process of the analysis, the p-value and |logFC| were used to screen the DEGs. Genes that met both p <0.05 and |logFC| ≥2.0 were considered as DEGs. DEGs occur simultaneously in the five selected gene profiles were identified using the Venn diagram website.
GO analysis is mostly used in large-scale functional enrichment research; Functions of all genes are classified into biological process (BP), cellular component (CC), and molecular function (MF) by this method. KEGG is a widely used database resource to understand high-level functions and utilities of cells, organisms and the ecosystem etc. from molecular-level, especially large-scale molecular datasets. The Database for Annotation, Visualisation and Integrated Discovery (DAVID) tools was used to perform GO and KEGG analysis. Here in our study p <0.05 and fold enrichment≥40 were considered statistically significant.
The Search Tool for the Retrieval of Interacting Networks Gene (STRING) database is a functional protein association network to analyse the protein-protein interactions (PPI). To seek the potential PPI, the newest STRING version 11.0 was used to analyse the DEGs identified previously. The minimum required interaction score was set at 0.4 and the disconnected or fewer connected elements were excluded. Afterward, Cytoscape software was used to optimize the PPI network Cytoscape. Nodes with a higher level of connectivity are more important in the whole network. Cytoscape CytoHubba in Cytoscape was used to analyse the connectivity level of each protein node. The top 10 genes were selected as key genes in this study.
The Kaplan–Meier plotter is an online tool to assess the effect of various genes on patients’ survivals based on large quantities of cancer cases. We use the mRNA pancancer database in the Kaplan–Meier plotter to assess the prognostic significance of key genes in CCCCRC patients. In the current study, CCRC patients were divided into low expression groups and high expression groups based on the best cutoff values of mRNA expression provided by the website. p<0.01 and p<0.05 were considered to be statistically significant for overall survival analysis and recurrence-free survival analysis, respectively.
RESULTS
Five gene expression profiles (GSE53757, GSE46699, GSE66272, GSE68417, and GSE71963) were selected in this study. Among them, the numbers of CCRC samples and normal samples are listed in Table I.
Table I: Essential information of the 5 datasets from the GEO database.
|
Datasets |
CCRC number |
Con number |
Total number |
|
GSE53757 |
72 |
72 |
144 |
|
GSE46699 |
67 |
63 |
130 |
|
GSE66272 |
26 |
27 |
53 |
|
GSE71963 |
32 |
16 |
48 |
|
GSE68417 |
29 |
14 |
43 |
Table II: Results of Enriched GO and KEGG analysis.
|
Category |
Serial number |
Explanation |
p value |
Fold enriched |
|
BP term |
GO:0002576 |
Platelet degranulation |
9.73E-10 |
97.81747573 |
|
BP term |
GO:0001525 |
Angiogenesis |
0.00594392 |
22.59013453 |
|
BP term |
GO:0060749 |
Mammary gland alveolus development |
0.009076825 |
197.5529412 |
|
BP term |
GO:0048754 |
Branching morphogenesis of an epithelial tube |
0.012262881 |
146.0173913 |
|
BP term |
GO:0008284 |
Positive regulation of cell proliferation |
0.024312383 |
10.81030043 |
|
BP term |
GO:0043406 |
Positive regulation of MAP kinase activity |
0.031188723 |
56.9220339 |
|
BP term |
GO:0030324 |
Lung development |
0.040013341 |
44.18947368 |
|
BP term |
GO:0022617 |
Extracellular matrix disassembly |
0.040013341 |
44.18947368 |
|
BP term |
GO:0042060 |
Wound healing |
0.042079309 |
41.98 |
|
CC term |
GO:0031093 |
Platelet alpha granule lumen |
2.59E-11 |
198.8072727 |
|
CC term |
GO:0072562 |
Blood microparticle |
4.61E-05 |
47.95789474 |
|
CC term |
GO:0005578 |
Proteinaceous extracellular matrix |
0.007245386 |
20.4 |
|
CC term |
GO:0016324 |
Apical plasma membrane |
0.008494581 |
18.78762887 |
|
CC term |
GO:0009986 |
Cell surface |
0.027671485 |
10.08708487 |
|
MF term |
GO:0008201 |
Heparin binding |
0.003076526 |
31.651875 |
|
MF term |
GO:0005507 |
Copper ion binding |
0.029469823 |
60.28928571 |
|
KEGG |
hsa05200 |
Pathways in cancer |
0.003251076 |
10.00218103 |
|
KEGG |
hsa04510 |
Focal adhesion |
0.01236384 |
14.31137309 |
|
KEGG |
hsa05219 |
Bladder cancer |
0.035244994 |
47.93728223 |
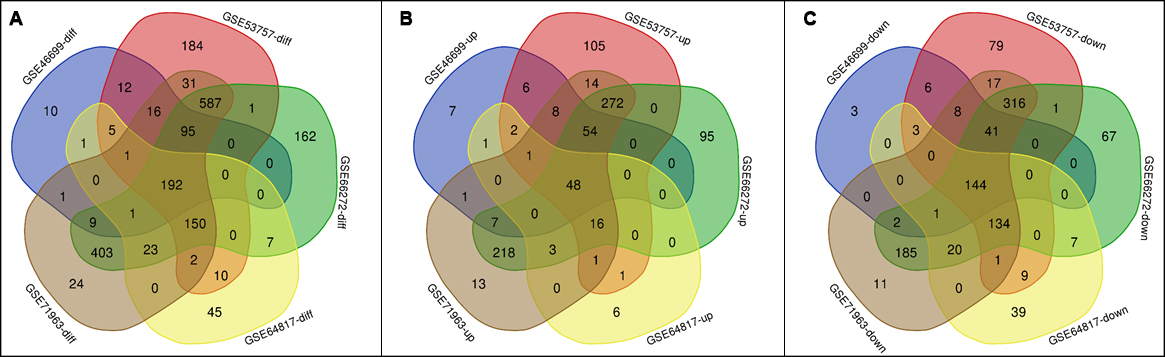
Figure 2: Venn results of shared DEGs in the 5 selected datasets. A showed all shared DEGs. B showed the upregulated DEGs. C showed the downregulated DEGs.
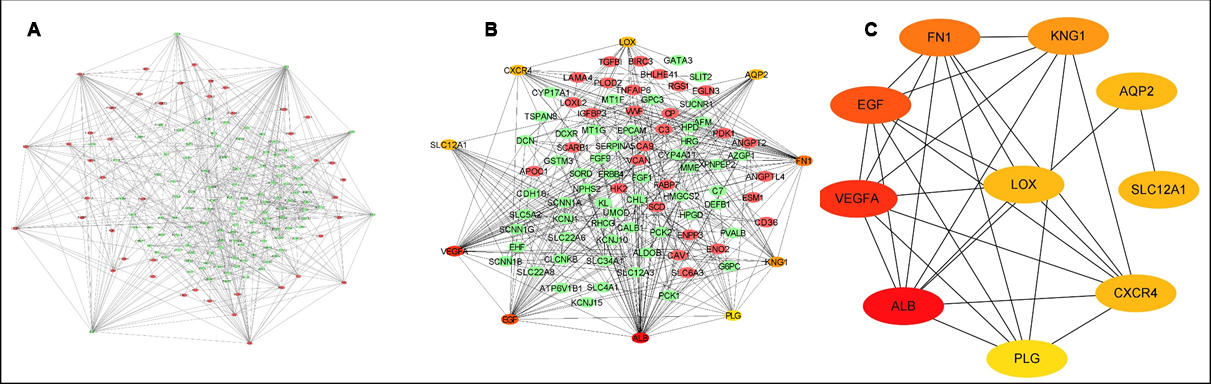 Figure 3: PPI network created with the DEGs. A: The peripheral red and central green represent upregulated and downregulated genes, respectively; B: The peripheral orange-red nodes indicate the top 10 genes in the PPI network; C: Only the top 10 genes screened out were displayed.
Based on our criteria of DEGs selection, we got 1287 DEGs from GSE5377, 528 were upregulated and 759 were downregulated; for GSE46699, we obtained 343 DEGs, 135 were upregulated, 208 were downregulated; For GSE66272, 1536 DEGs with 656 upregulated and 880 downregulated were found; From GSE68417, 437 DEGs of 79 up regulation and 358 down regulation were screened out; from GSE71963, 1143 DEGs with 341 up regulation and 802 down regulation were filtered out. All DEGs were obtained through comparison with CCRC and normal kidney tissues. Afterward, we get the shared DEGs in 5 datasets selected by Venn analysis (Figure 2).
In the end, we got 192 shared DEGs from all the 5 datasets, among which 48 were upregulated, 144 were downregulated.
The results of our GO analysis showed that the DEGs were primarily included in BPs (9), secondly CC (5), and thirdly MF (2) (Table II). Our KEGG results showed that DEGs were primarily included in 3 pathways as shown in Table II.
PPI of the DEGs was analysed using the STRING website, then imported into Cytoscape software to be optimised and visualised as presented in Figure 3. The top ten genes in the PPI network were also screened out according to connectivity degrees by Cytohubba in Cytoscape, and optimised and visualised by Cytoscape software (Figure 3).
The symbol, description, connectivity degree, and type of the selected leading 10 key genes are shown in Table III.
Table III: The leading 10 key genes with the highest connectivity degree.
|
Symbol |
Description |
Connectivity degree |
Gene type |
|
ALB |
Albumin |
53 |
Downregulated |
|
VEGFA |
Vascular endothelial growth factor A |
33 |
Upregulated |
|
EGF |
Epidermal growth factor |
32 |
Downregulated |
|
FN1 |
Fibronectin 1 |
28 |
Upregulated |
|
KNG1 |
Kininogen 1 |
19 |
Downregulated |
|
AQP2 |
Aquaporin 2 |
18 |
Downregulated |
|
CXCR4 |
C-X-C motif chemokine receptor 4 |
18 |
Upregulated |
|
SLC12A1 |
Solute carrier family 12, member 1 |
18 |
Downregulated |
|
LOX |
Lysyl oxidase |
18 |
upregulated |
|
PLG |
Plasminogen |
17 |
Downregulated |
The Kaplan–Meier plotter was used to determine whether the ten potential key genes have prognostic values. Totally 530 CCRC patients were available to analyse the overall survival, and 117 CCRC patients can be used to analyse the recurrence-free survival. The best cutoff value was selected. If p <0.05 is considered to have statistical significance, 5 of the ten key genes are prognostic markers for the overall survival analysis in CCRC, but the results of KNG1 is contradictory to our previous analysis, that is the DEGs analysis results showed that KNG1 is downregulated in CCRC compared with that in normal kidney tissue, while the survival analysis showed it is favorable for the CCRCs when downregulated in CCRCs (Figure 4).
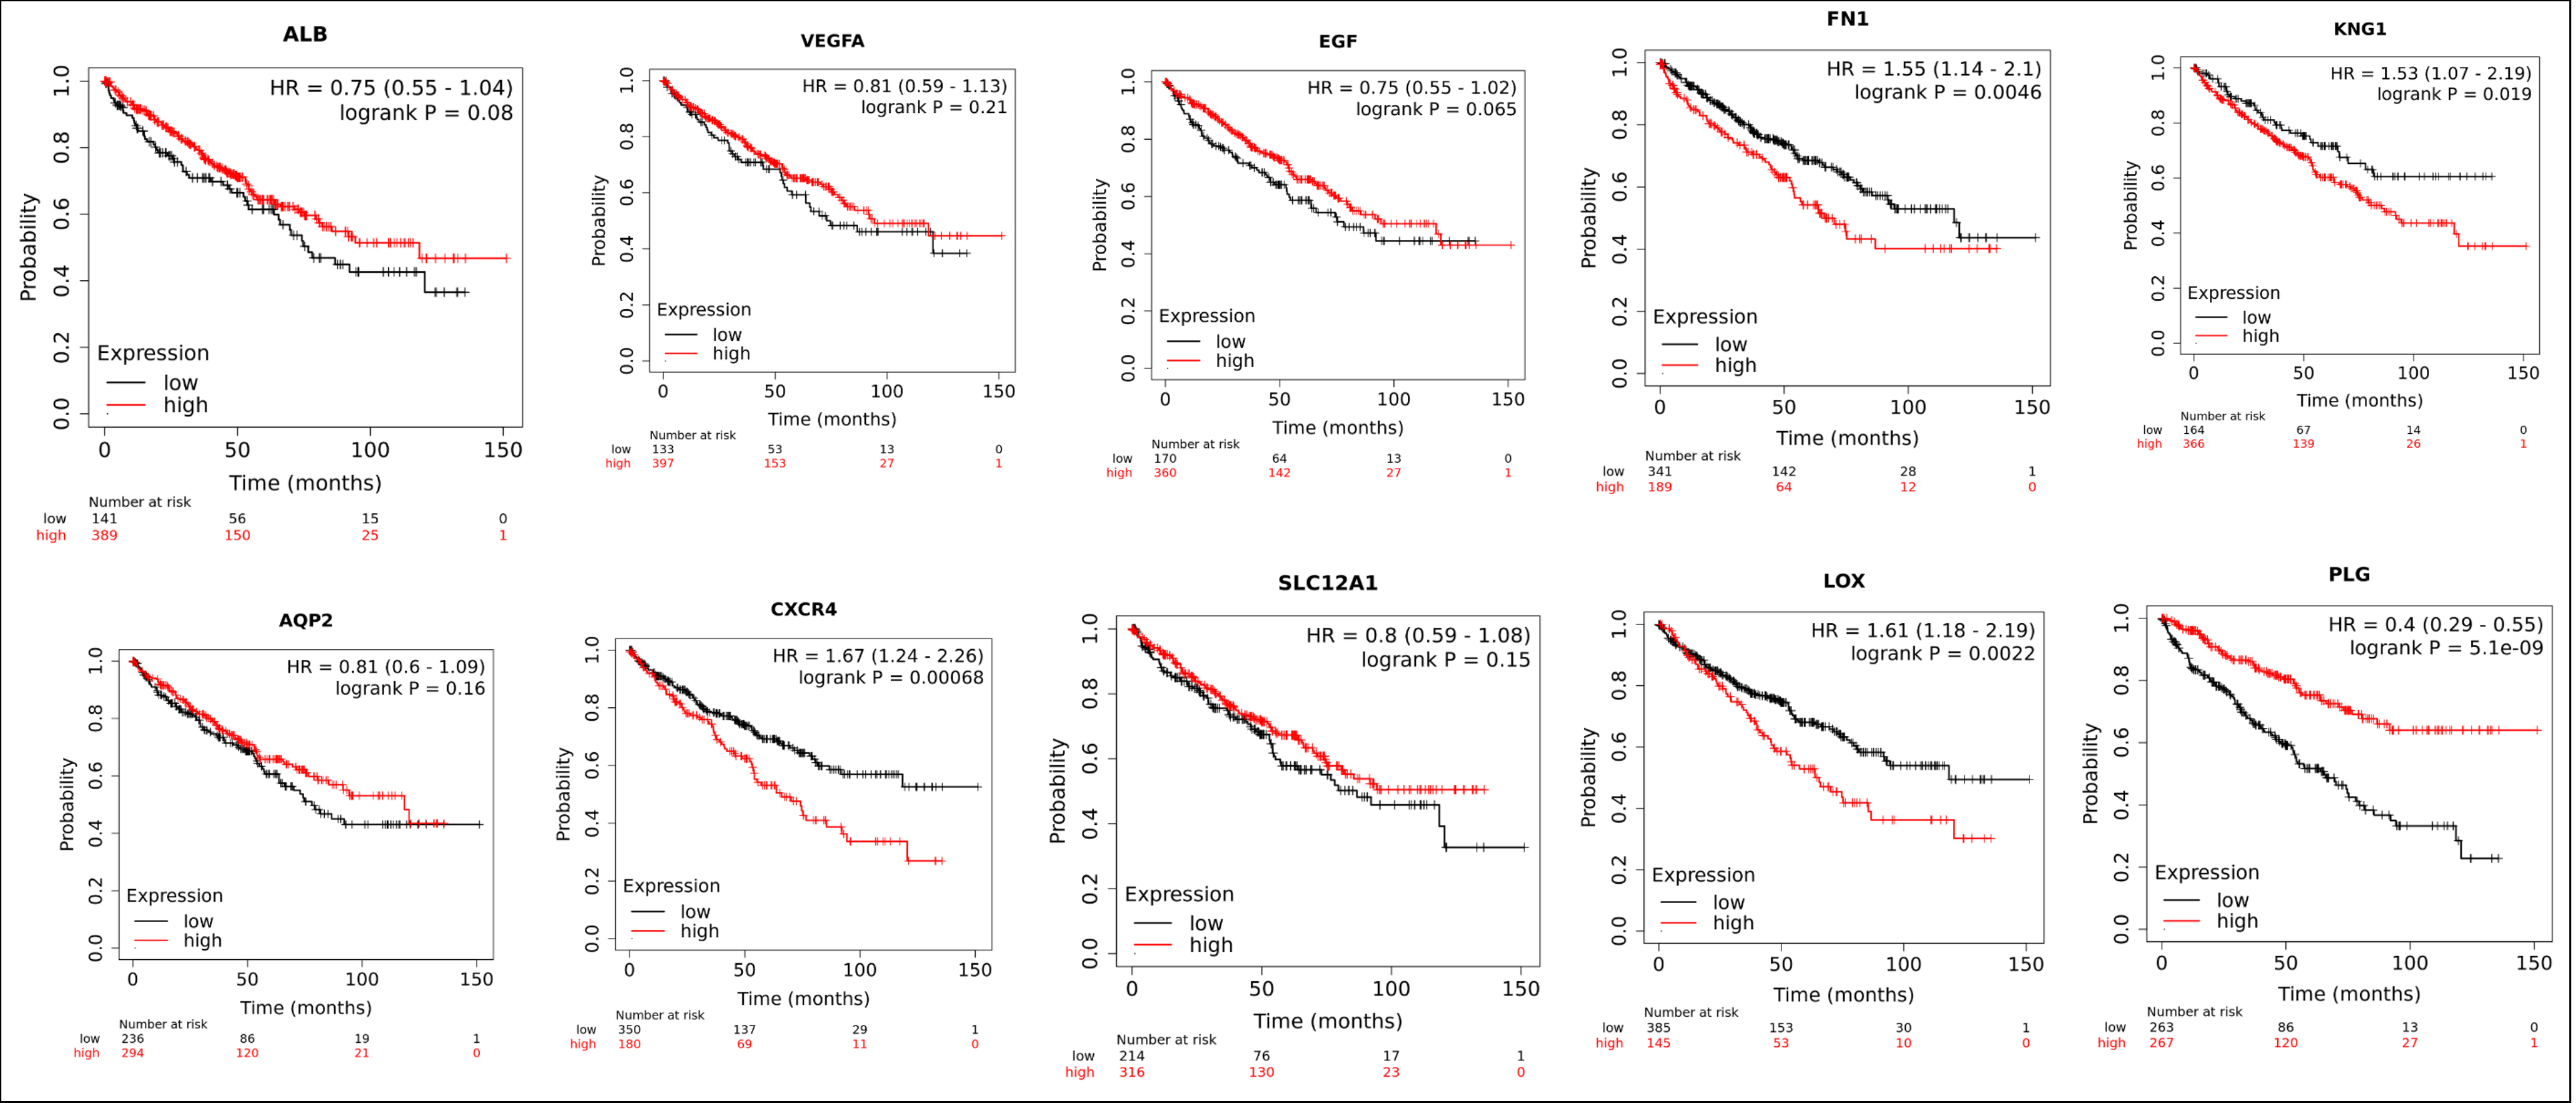 Figure 4: Results of Kaplan–Meier overall survival analysis of the ten key gene expressions in CCRC patients, p <0.05.
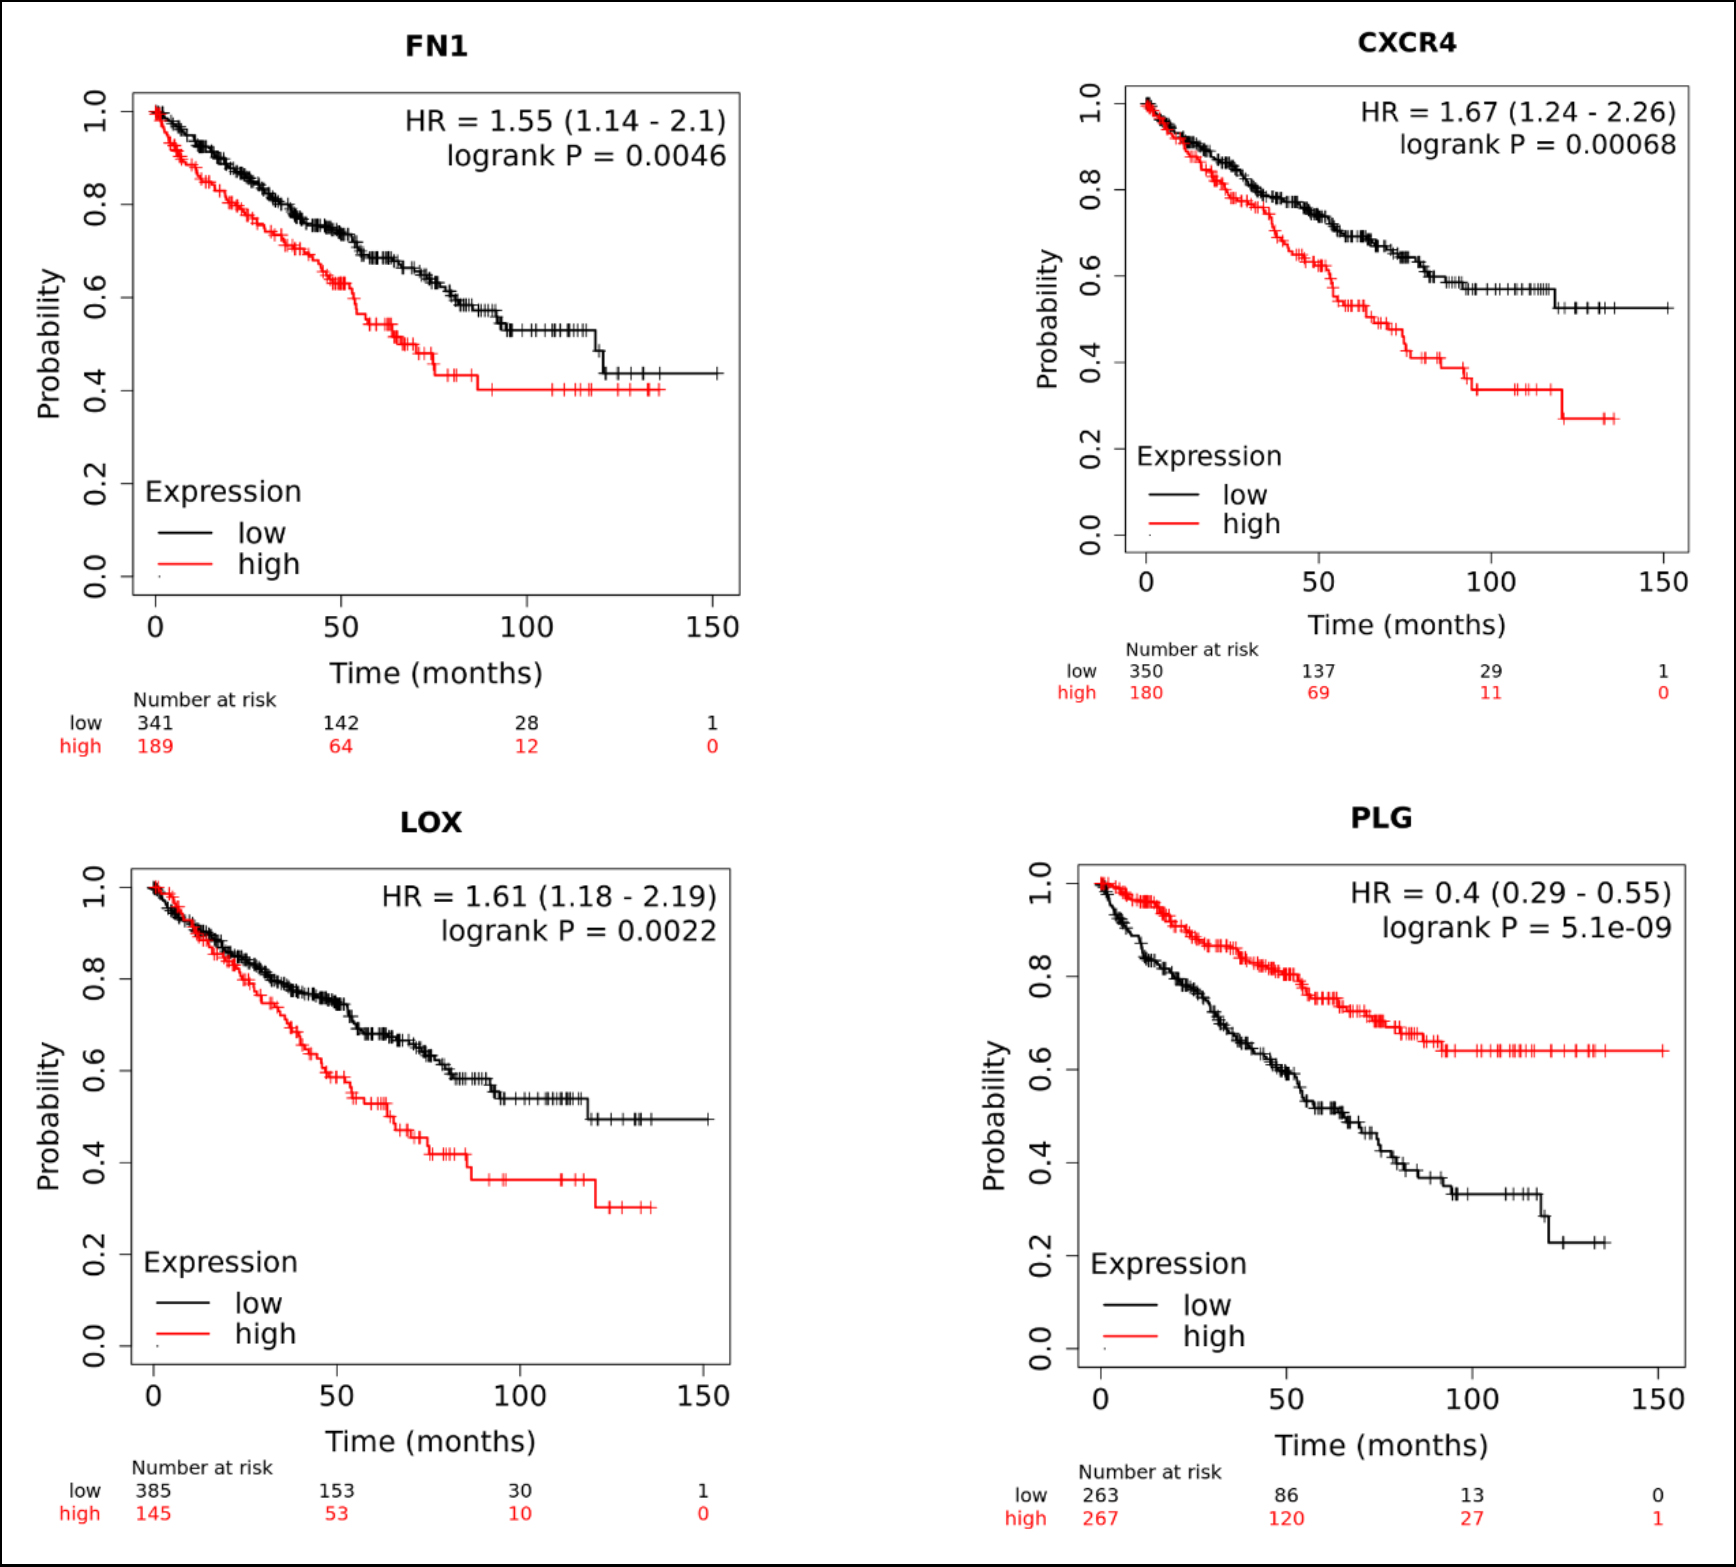
Figure 5: Results of Kaplan–Meier overall survival analysis of the four key gene expression in CCRC patients, p <0.01.
When p <0.01 is considered statistically significant, the results showed that four of the ten key genes have prognostic value for the overall survival analysis of CCRC and this is also consistent with our previous DEGs analysis (Figure 5). Of these four genes, FN1, CXCR4, and LOX are up-regulated and PLG are down-regulated in CCRC compared with that in normal kidney tissue.
From our results, overexpression of FN1, CXCR4, and LOX are unfavorable prognostic markers and upregulation of PLG is a favorable prognostic marker for CCRC. Then we believe that these four genes have good prognostic value for the overall survival of CCRC patients.
When analysing the recurrence-free survival of the top ten genes, we found that if p <0.01 is considered to have statistical significance, none of the ten genes has the prognostic value (Figure 6).
When p <.05 is considered to have statistical significance, there are three genes ALB, SLC12A1, and LOX are prognostic factors for recurrence-free survival in CCRC. Compared with our previous DEGs analysis, both SLC12A1 and LOX have prognostic values for the recurrence-free survival of CCRC (Figure 7).
Combined with the above overall survival analysis, we believe that LOX is the most reliable prognostic factor and high expression of LOX is an unfavorable marker for CCRC patients because it has the prognostic value for both overall and recurrence-free survival analysis in CCRC.
DISCUSSION
CCRC accounts for nearly 80% of CCRC cases.8 A literature reported that the global morbidity of CCRC occupied 2.2% of the new cancer cases, and the mortality of CCRC made up 1.8% of all dead cancer patients.9 From a global perspective, the morbidity of CCRC varied geographically with the highest morbidity in developed countries.4-6
Both kidneys are located deep in the retroperitoneal space, making that CCRC is difficult to detect early, which in turn leads to distant metastasis of CCRC at the time of diagnosis.10,11 Surgical resection and radiotherapy are common treatment methods for CCRC, but the results are not satisfactory.12-15 In addition, there is some other literature that reported that CCRC is not sensitive to chemotherapy or radiotherapy.16,17 Hence, the identification of potential key genes for CCRC can provide new targets for clinical specific targeted therapies of CCRC.
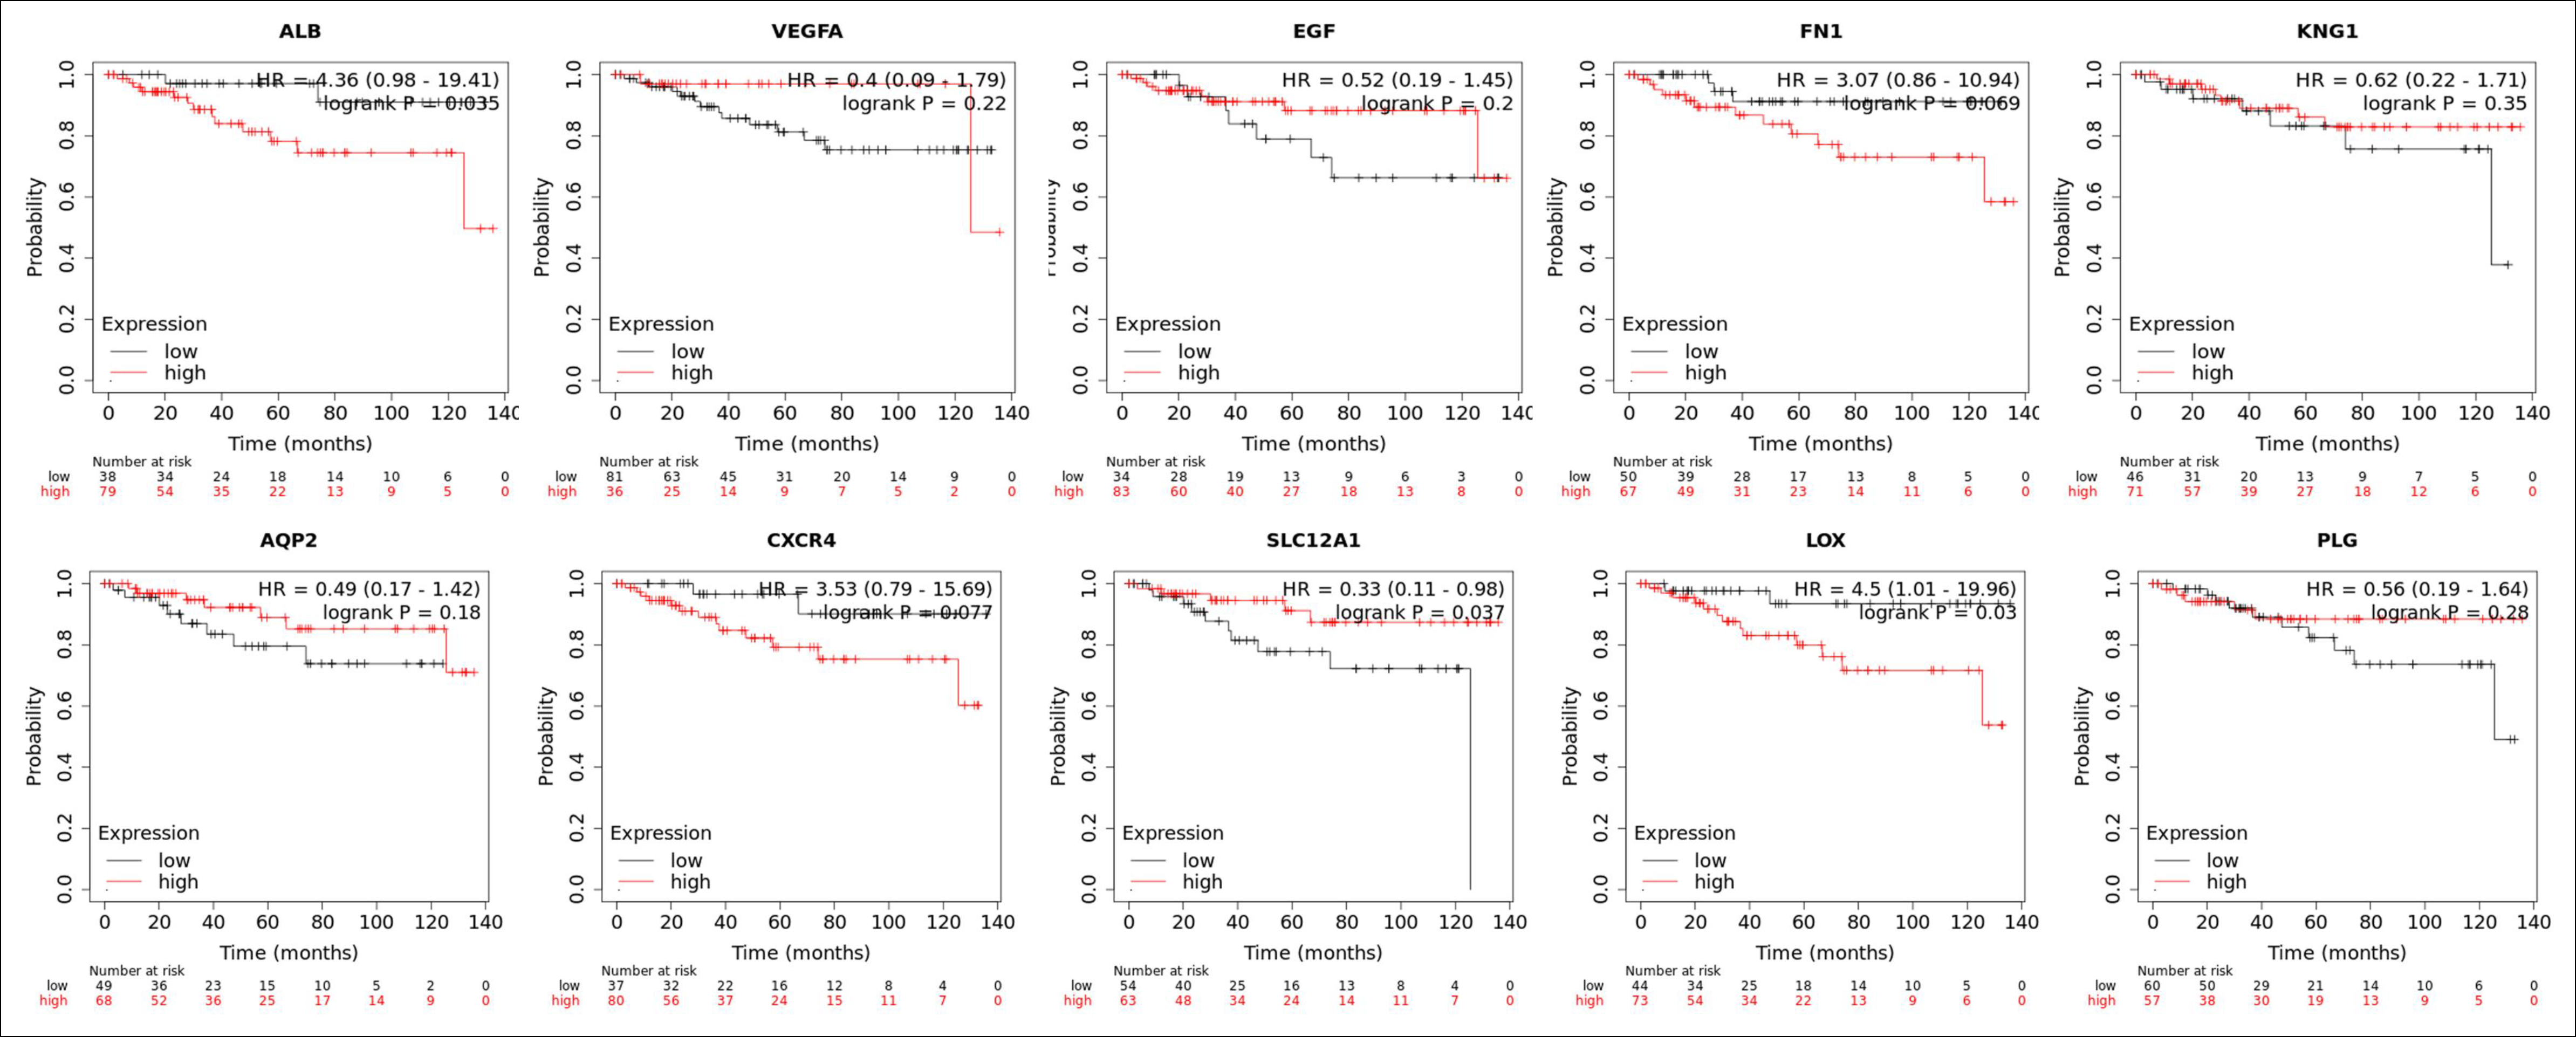
Figure 6: Results of recurrence-free survival analysis of the top ten key genes.
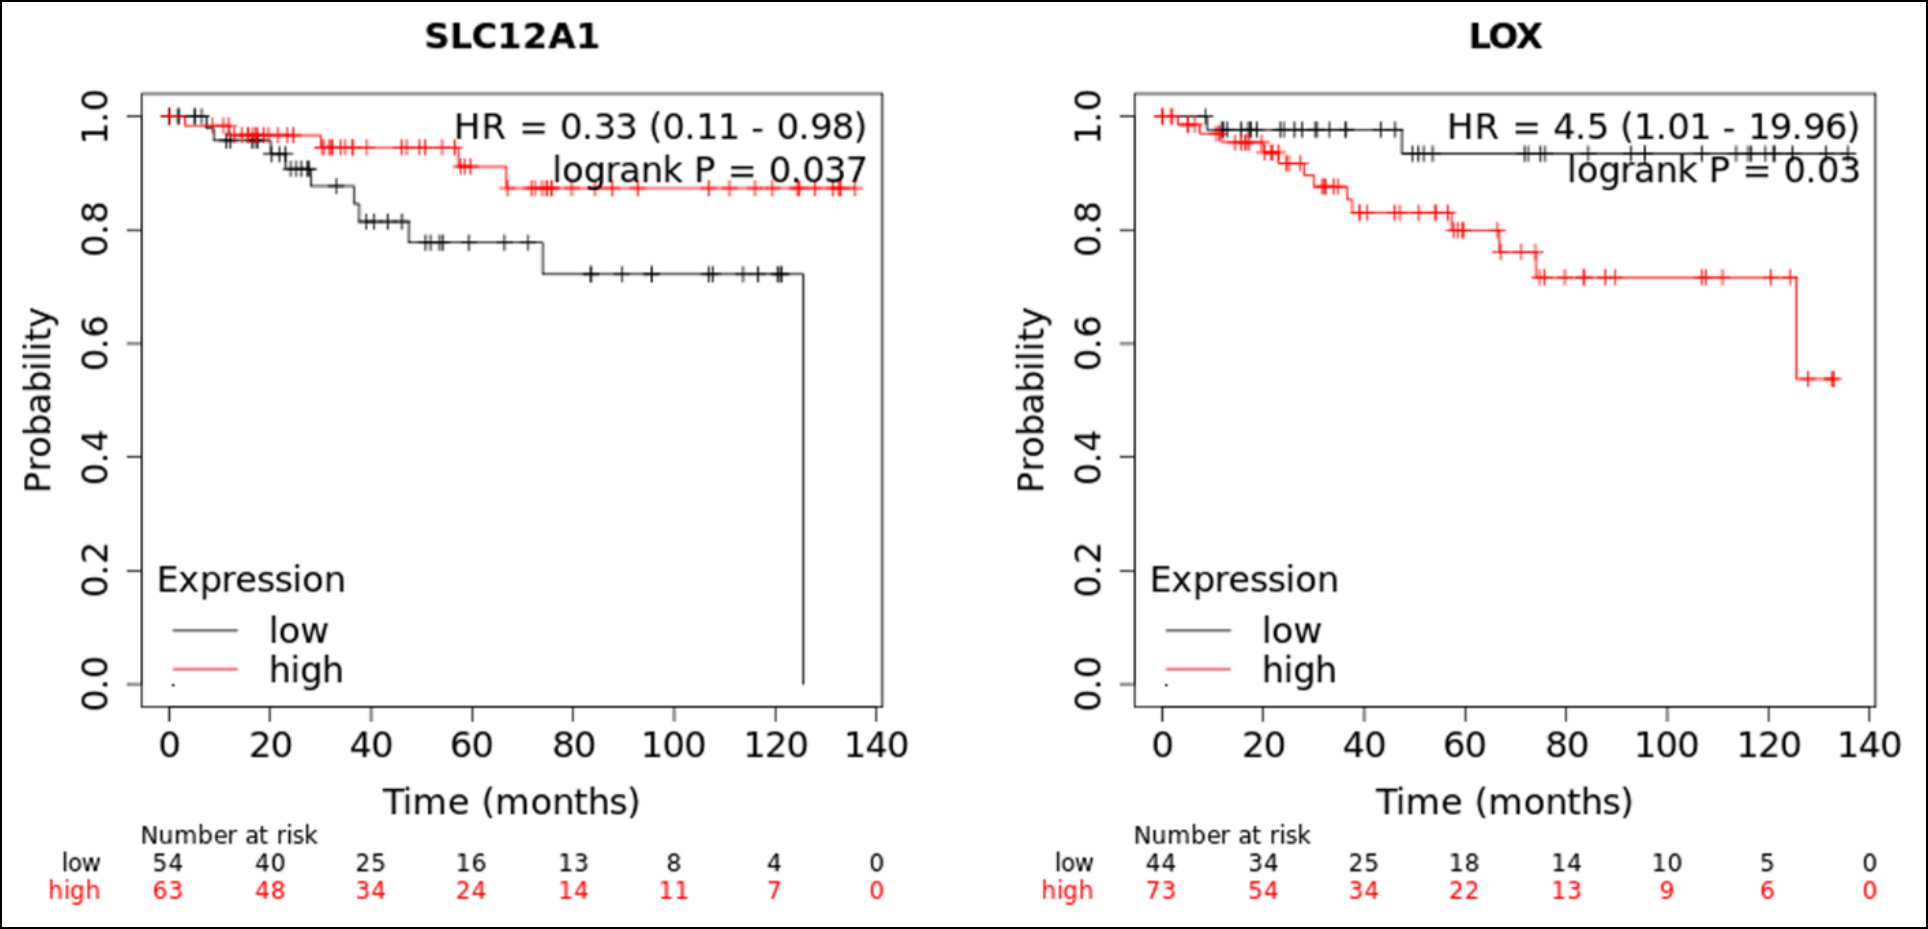
Figure 7: The results of recurrence-free survival analysis of SLC12A1 and LOX with p value <0.05.
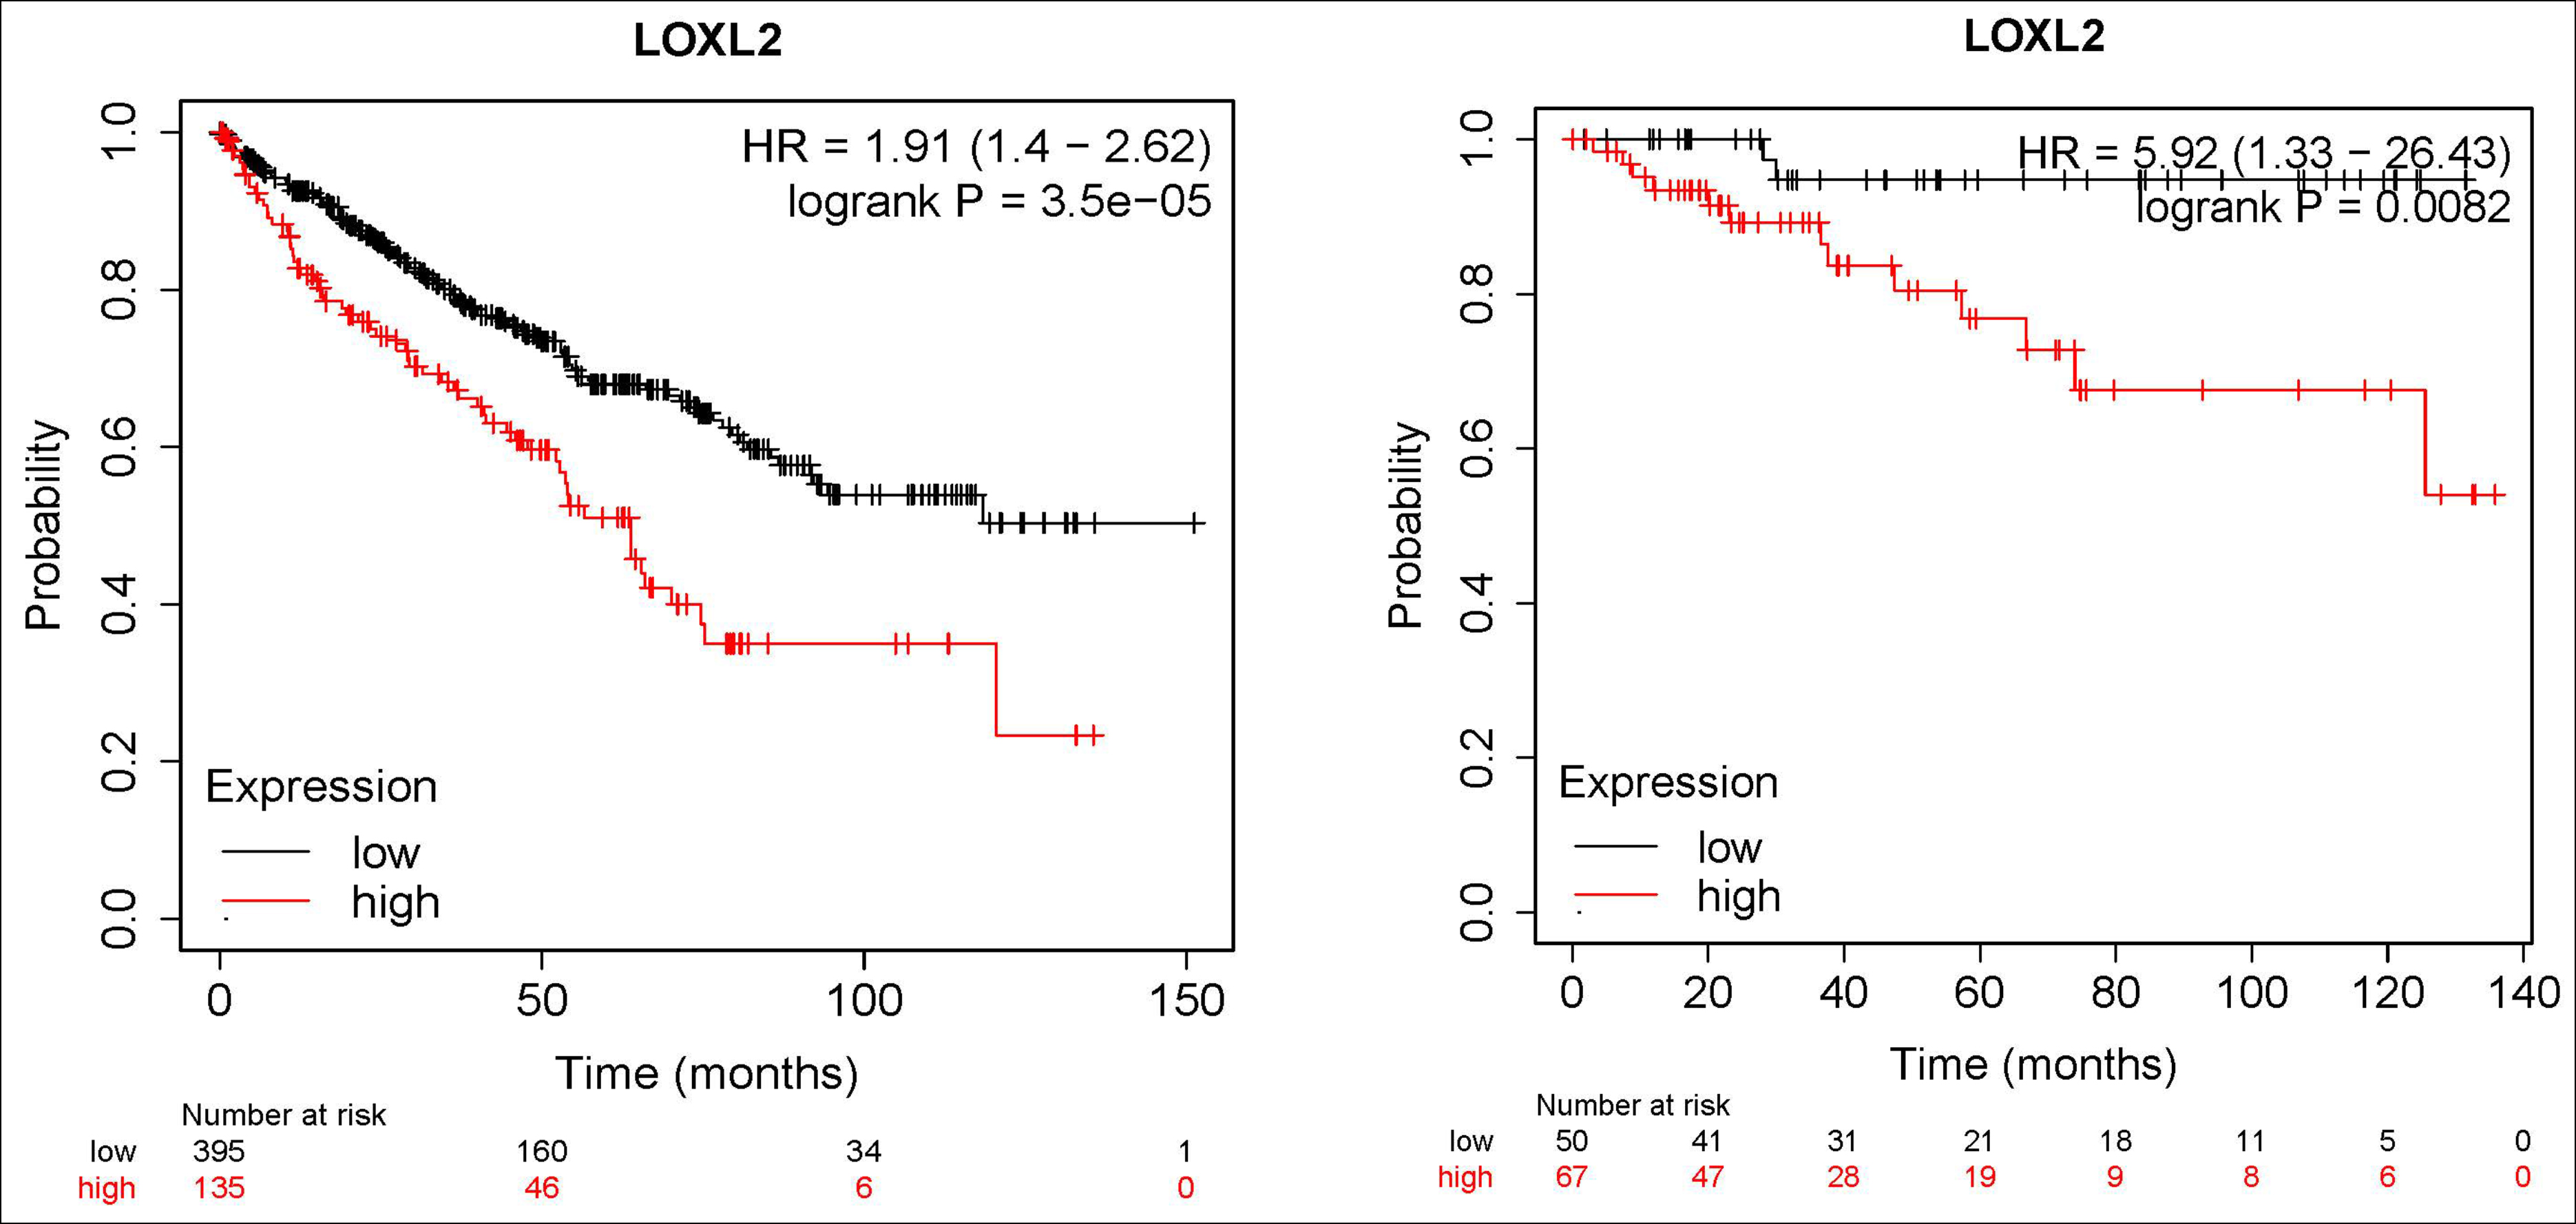 Figure 8: The results of survival analysis of LOXL2. Left: Result of overall survival analysis of LOXL2, p <0.01 Right: Results of recurrence-free survival analysis of LOXL2, p <0.01.
In the current study, the authors screened out DEGs between the CCRC and the normal human kidney tissues from 5 GEO datasets. When selecting gene expression files, the authors tried to select the latest gene expression profiles with the largest number of patient cases to ensure the reliability of the results. Totally, 192 DEGs with 48 upregulated and 144 downregulated were identified.
The authors found the main GO BP, CC, and MF terms and major KEGG pathways the DEGs were involved by DAVID Bioinformatics Resources 6.8. A PPI network was then created to detect the interaction of the DEGs, and ten key genes were screened out. Finally, the Kaplan–Meier plotter website was used to evaluate the prognostic significance of the key genes in CCRC patients. After the overall and recurrence-free survival analysis, we found that there are four key genes that may have prognostic value for the overall survival of CCRC patients but the authors believe that LOX was the most reliable because it has prognostic value for both overall survival and recurrence-free survival analysis. Overexpression of LOX is unfavorable for CCRC patients.
LOX is abbreviated from lysyl oxidase (LOX). From our previous GO enrichment analysis, the authors knew that LOX is the main participants in the oxidation-reduction process. The LOX family features in sustaining the structural integrality and tensional force of connective tissue.18-20 In addition LOX family genes also include LOXL1, LOXL2, LOXL3 and LOXL4 (Lysyl Oxidase Like 1, 2, 3, and 4).21-25 Researchers have found that some LOX family genes are involved in the genesis and progression of some malignancies. Cao et al. demonstrated that LOXL2 overexpression is an unfavorable survival prognostic factor in cervical cancer.26 The PPI analysis showed that both LOX and LOXL2 from the LOX family were upregulated in CCRC patients (Figure 3) and the Kaplan Meier survival analysis also showed that overexpression of both LOX and LOXL2 (Figures 5, 7, 8) are unfavorable for CCRC patients. Lin and Zhang also demonstrated that LOX was significantly upregulated and predicted poor survival in CCRC with the various analysing method, which is consistent with the results of this study.27,28 Meanwhile, some experimental results are consistent with our analysis results, which further proves the feasibility of this bioinformatics analysis method.29,30
Except for LOX, the authors also found that the other 9 key genes in CCRC, which include ALB, VEGFA, EGF, FN1, KNG1, AQP2, CXCR4, SLC12A1, and PLG. From the GO and KEGG pathway enrichment analysis, most of them participate in the proteinaceous extracellular matrix or extracellular matrix disassembly, angiogenesis, cell proliferation, and pathways in cancer etc. which implied their possible roles in the tumorigenesis. From the survival analysis, the authors found that CXCR4 and FN1 were upregulated in CCRC tissue compared to normal kidney tissue and their overexpression predict poor overall survival in CCRC patients. In contrast, PLG and SLC12A1 were downregulated in CCRC tissue compared with normal kidney tissue and their overexpression heralds a good clinical outcome for overall survival of CCRC patients; LOX has prognostic value for both overall and recurrence-free survival; the survival analysis results of other five genes showed no statistical significance for CCRC patients. However, to confirm these results, further larger data analysis or experimental studies are needed.
CONCLUSION
Our meta-analysis recognised 192 DEGs between CCRC and normal kidney tissues from GEO datasets. Among them, 5 key genes might function as key genes of CCRC, including LOX, CXCR4, FN1, PLG, and SLC12A1. Some of them were upregulated in CCRC, and their overexpression was related with the unfavorable clinical outcomes; others were downregulated in CCRC and their overexpression was favorable for the CCRC patients. Among them, LOX was believed to have most reliable prognostic value for CCRC patients and overexpression of LOX was unfavorable for CCRC patients. Although the further experimental study is needed, the authors believe LOX can serve as a potential prognostic and therapeutic target for the clinical application of CCRC therapy.
FUNDING:
This study was supported by the Innovation Training Program for College Students in Shandong Province (National level), 201910439005, and National Natural Science Foundation of China, 81572868.
COMPETING INTEREST:
The authors declared no competing interests in this work.
AUTHORS’ CONTRIBUTIONS:
YC: Data acquisition and analysis, interpretation, drafting, and final approval.
ZY: Data acquisition and analysis, interpretation, and final approval.
YS: Critical Revision and final approval.
SZ: Conception and design, Interpretation, critical Revision, and final approval.
REFERENCES
- Moch H. An overview of renal cell cancer: Pathology and genetics. Semin Cancer Biol 2013; 23(1):3-9. doi: 10. 1016/j.semcancer.2012.06.006.
- Ljungberg B, Bensalah K, Canfield S, Dabestani S, Hofmann F, Hora M, et al. EAU guidelines on renal cell carcinoma: 2014 update. Eur Urol 2015; 67(5):913-24. doi: 10.1016/j. eururo.2015.01.005.
- Gray RE, Harris GT. Renal cell carcinoma: Diagnosis and management. Am Fam Physician 2019; 99(3):179-84.
- Jonasch E, Gao J, Rathmell WK. Renal cell carcinoma. BMJ (Clinical research ed.) 2014; 349:g4797. doi: 10.1136/ bmj.g4797.
- Su Kim D, Choi YD, Moon M, Kang S, Lim JB, Kim KM, et al. Composite three-marker assay for early detection of kidney cancer. Cancer Epidemiol Biomarkers Prev 2013; 22(3):390-8. doi: 10.1158/1055-9965.EPI-12-1156.
- Rossi SH, Klatte T, Usher-Smith J, Stewart GD. Epidemiology and screening for renal cancer. World J Urol 2018; 36(9):1341-53. doi: 10.1007/s00345-018-2286-7.
- Zheng RS, Sun KX, Zhang SW, Zeng HM, Zou XN, Chen R, et al. Report of cancer epidemiology in China, 2015. Zhonghua Zhong Liu Za Zhi 2019; 41(1):19-28. doi: 10.3760/cma.j.issn.0253-3766.2019.01.005.
- Siegel RL, Miller KD, Jemal A. Cancer statistics. CA Cancer J Clin 2018; 68(1):7-30. doi: 10.3322/caac.21442.
- Bray F, Ferlay J, Soerjomataram I, Siegel RL, Torre LA, Jemal A, et al. Global cancer statistics 2018: Globocan estimates of incidence and mortality worldwide for 36 cancers in 185 countries. CA Cancer J Clin 2018; 68(6):394-24. doi: 10.3322/caac.21492.
- Tang T, Du X, Zhang X, Niu W, Li C, Tan J, et al. Computational identification and analysis of early diagnostic biomarkers for kidney cancer. J Human Genetics 2019; 64(10):1015-1022. doi: 10.1038/s10038-019-0640-2.
- Wang Z, Zhang YS. Metabonome in early diagnosis of renal cell carcinoma. Zhongguo Yi Xue Ke Xue Yuan Xue Bao 2019; 41(5):709-13. doi: 10.3881/j.issn.1000-503X.10957.
- Acar O, Sanli O. Surgical management of local recurrences of renal cell carcinoma. Surg Res Pract 2016; 2016: 2394 942. doi: 10.1155/2016/2394942.
- Bubenik J. Cytokine gene-modified vaccines in the therapy of cancer. Pharmacol Ther 1996; 69(1):1-14. doi: 10.1016/ 0163-7258(95)02016-0.
- Launay-Vacher V, Aapro M, De Castro G, et al. Renal effects of molecular targeted therapies in oncology: A review by the cancer and the kidney international network (C-KIN). Ann Oncol 2015; 26(8):1677-84. doi: 10.1093/annonc/mdv136.
- De Felice F, Tombolini V. Radiation therapy in renal cell carcinoma. Crit Rev Oncol Hematol 2018; 128:82-7. doi: 10.1016/j.critrevonc.2018.06.002.
- Rasmussen F. Metastatic renal cell cancer. Cancer Imag 2013; 13(3):374-80. doi: 10.1102/1470-7330.2013.9035.
- Gao Y, Li H, Ma X, Fan Y, Ni D, Zhang Y, et al. KLF6 suppresses metastasis of clear cell renal cell carcinoma via transcriptional repression of E2F1. Cancer Res 2017; 77(2):330-42. doi: 10.1158/0008-5472.CAN-16-0348.
- Wang SX, Mure M, Medzihradszky KF, Burlingame AL, Brown DE, Dooley DM, et al. A crosslinked cofactor in lysyl oxidase: Redox function for amino acid side chains. Sci 1996; 273(5278):1078-84. doi: 10.1126/science.273.5278.1078.
- Smith-Mungo LI, Kagan HM. Lysyl oxidase: Properties, regulation and multiple functions in biology. Matrix Biol 1998; 16(7):387-98. doi: 10.1016/s0945-053x(98)90012-9.
- Kim Y, Roh S, Park JY, Kim Y, Cho DH, Kim JC, et al. Differential expression of the LOX family genes in human colorectal adenocarcinomas. Oncol Rep 2009; 22(4):799-804. doi: 10.3892/or_00000502.
- Kim Y, Boyd CD, Csiszar K. A new gene with sequence and structural similarity to the gene encoding human lysyl oxidase. J Biol Chem 1995; 270(13):7176-82. doi: 10. 1074/jbc.270.13.7176.
- Maki JM, Kivirikko KI. Cloning and characterisation of a fourth human lysyl oxidase isoenzyme. Biochem J 2001; 355(Pt 2):381-7. doi: 10.1042/0264-6021:3550381.
- Asuncion L, Fogelgren B, Fong KS, Fong SF, Kim Y, Csiszar K. A novel human lysyl oxidase-like gene (LOXL4) on chromosome 10q24 has an altered scavenger receptor cysteine rich domain. Matrix Biol 2001; 20(7):487-91. doi: 10.1016/ s0945-053x(01)00161-5.
- Claude Jourdan-Le Saux HT, Bogic L, Bryant-Greenwood GD, Boyd CD, Csiszar K. The LOXL2 gene encodes a new lysyl oxidase-like protein and is expressed at high levels in reproductive tissues. J Biol Chem 1999; 274(18):12939-944. doi: 10.1074/jbc.274.18.12939.
- Kasashima H, Yashiro M, Okuno T, Miki Y, Kitayama K, Masuda G, et al. Significance of the lysyl oxidase members lysyl oxidase like 1, 3, and 4 in gastric cancer. Digestion 2018; 98(4):238-48. doi: 10.1159/000489558.
- Cao C, Lin S, Zhi W, Lazare C, Meng Y, Wu P, et al. LOXL2 expression status is correlated with molecular characterisations of cervical carcinoma and associated with poor cancer survival via epithelial-mesenchymal transition (EMT) phenotype. Front Oncol 2020; 10:284. doi: 10.3389/fonc.2020. 00284.
- Lin S, Zheng L, Lu Y, Xia Q, Zhou P, Liu Z. Comprehensive analysis on the expression levels and prognostic values of LOX family genes in kidney renal clear cell carcinoma. Cancer Med 2020; 9(22):8624-38. doi: 10.1002/cam4.3472.
- Zhang F, Wu P, Wang Y, Zhang M, Wang X, Wang T, et al. Identification of significant genes with prognostic influence in clear cell renal cell carcinoma via bioinformatics analysis. Transl Androl Urol 2020; 9(2):452-61. doi: 10.21037/tau.2020.02.11.
- Stefano VD, Torsello B, Bianchi C, Cifola I, Mangano E, Bovo G, et al. Major action of endogenous lysyl oxidase in clear cell renal cell carcinoma progression and collagen stiffness revealed by primary cell cultures. Am J Pathol 2016; 186(9):2473-85. doi:10.1016/j.ajpath.2016.05.019.
- Hase H, Jingushi K, Ueda Y, Kitae K, Egawa H, Ohshio I, et al. LOXL2 status correlates with tumor stage and regulates integrin levels to promote tumor progression in C. Mol Cancer Res 2014; 12(12):1807-17. doi: 10.1158/1541-7786.MCR-14-0233.