Effects of Novel Insulin Resistance Indices on Early Renal Functions in Donors
By Metin Yigman, Ahmet Emin DoganAffiliations
doi: 10.29271/jcpsp.2024.04.429ABSTRACT
Objective: To investigate the relationship between quickly calculable new insulin resistance (IR) indices used to evaluate IR in early kidney functions after donor nephrectomy.
Study Design: Descriptive design.
Place and Duration of the Study: Department of Urology, Ufuk University Faculty of Medicine, Ankara, Turkiye, between January 2016 and August 2021.
Methodology: The preoperative biochemical analyses of patients undergoing open donor nephrectomies and estimated glomerular filtration rates (eGFR) were recorded in the preoperative and first postoperative month. The IR indices (triglyceride glucose [TyG] index, TyG-body mass index [TyG-BMI], triglyceride/HDL cholesterol ratio [TG/HDL-C], and metabolic score for IR [METS-IR]) were computed. Additionally, the patients were separated into two categories. Group 1 had a less than 30% decrease in eGFR values in the postoperative first-month period, and group 2 had a more than 30% decrease. The relationship between variables was analysed using the Spearman correlation, and comparisons between groups were analysed using the independent t-test or Mann–Whitney U-test.
Results: A total of 107 patients were included in the study. The mean eGFR reduction rate was 31.81 ± 8.87 %. In the correlation analyses, an increase in the rate of decrease in postoperative GFR was associated with higher IR indices, specifically TyG (r = 0.19, p = 0.04), TG/HDL-C (r = 0.21, p = 0.02), and METS-IR (r = 0.21, p = 0.02). No statistically significant difference was found between the groups regarding all the calculated IR indices (p < 0.05).
Conclusion: The results suggest a possible link between increased IR and postoperative renal function decline.
Key Words: Insulin resistance, Glomerular filtration rate, Donor nephrectomy, Triglyceride-Glucose index, METS-IR.
INTRODUCTION
The prevalence of end-stage renal disease has been increasing in recent years and constitutes a significant problem for health systems globally. The preferred renal replacement therapy for patients with end-stage renal disease is kidney transplantation and successful kidney transplantation notably enhances the patient’s quality of life. Donor safety is a priority during donor nephrectomy operations, which only healthy individuals undergo.
The long-term morbidity and mortality results of kidney donation are controversial. Glomerulosclerosis, which can progress to renal failure, may develop in the remaining kidney after donor nephrectomy.1
According to the Clinical Practice Guideline on the Evaluation and Care of Living Kidney Donors, there are absolute contra-indications.
However, the opinions on donor candidates with diabetes, metabolic syndrome, obesity, or hypertension were left to the preference of the clinicians according to clinical and individual conditions.2 As the transplant waiting list expands, the demand for kidneys increases. Accordingly, transplant centres’ inclinations to consider donors with potential risk factors for chronic kidney disease have risen.
There is a relationship between elevated plasma glucose levels and an increased risk of kidney dysfunction or kidney disease. Insulin resistance (IR) is a fundamental contributor to the development and progression of type 2 diabetes, plays a central role in Type 2 diabetes’s pathogenesis, and represents a significant metabolic condition that reduces the responsiveness of critical organs such as the liver, skeletal muscle, and adipose tissue to insulin’s physiological effects.3 Insulin resistance is an evident, prevalent, and early modification in chronic kidney disease cases, even when the glomerular filtration rate (GFR) is in the established normal range.4 As GFR levels decrease, IR becomes more frequent, and it consistently manifests in individuals with end-stage renal disease-it is nearly ubiquitous in such cases.5
The hyperinsulinemic-euglycemic clamp (HIEC) is currently the established gold standard for identifying IR.6 However, this approach is complex and time consuming and has limited relevance under research conditions. The triglyceride (TyG) and glucose index, computed using fasting plasma glucose and triglyceride levels, is a straightforward, cost-effective, and readily accessible IR marker. Recent research suggests that TyG may be a usable alternative IR marker.6 Additionally, new indirect IR indices obtained using TyG and anthropometric values were introduced and found to have an essential value in diagnosing metabolic syndrome.7 Evidence has shown that the metabolic score for IR (METS-IR), another new score for evaluating IR, is also associated with fasting insulin levels and that high METS-IR scores represent a maximum risk of developing Diabetes.8
It is known that there is a tendency for decreased insulin sensitivity in patients following donor nephrectomy.9,10 It has also been shown that the TyG index increases more and the eGFR decreases more in donors than in healthy people.11
The aim of this study was to investigate the correlation between simple indices for assessing IR and early renal function after donor nephrectomy and examine the potential of these IR indices values as risk factors.
METHODOLOGY
This retrospective study was conducted after obtaining approval from the institutional Ethics Board of the Ufuk University Faculty of Medicine in compliance with the 1964 Declaration of Helsinki and its subsequent amendments (Date: 11.11.2021, decision no: 2021.11.11.01/14). Patients who underwent open donor nephrectomies and had follow-ups between January 2016 and August 2021 were retrospectively evaluated. All patients who fulfilled the kidney donation criteria and underwent surgery were included in this study. Patients who did not undergo postoperative follow-up examinations at the institution and for whom results were inaccessible were excluded from the study.
Data were collected from the patients’ medical records. The living donors were the first- and second-degree relatives of the respective kidney transplant recipients. The preoperative fasting glucose, serum triglyceride (TG), high-density lipoprotein cholesterol (HDL-C), and haemaglobinA1c (HbA1c) analysis results of all patients using standard methods, as well as body mass index (BMI), were computed using the patients’ recorded heights and weights. Using the Chronic Kidney Disease Epidemiology Collaboration (CKD-EPI) equation in accordance with the Kidney Disease guidelines, the estimated glomerular filtration rate (eGFR) levels from laboratory examinations during both the preoperative and one-month postoperative control periods were calculated for white men and women, as all donors belonged to the white ethnicity.12 The decrease rates for the preoperative and postoperative eGFR values were expressed as percentages. In this retrospectively designed study, IR indices were selected from formulae defined in the literature and which could be calculated from the data of routine blood analyses of patients. The IR indices mentioned in the literature were calculated using the following formulae:13 TyG = Ln [fasting TG (mg/dL) × FPG (mg/dL)/2]; TyG-BMI = TyG × BMI; TG/HDL-C = fasting TG (mg/dL)/fasting HDL cholesterol (mg/dL); and METS-IR = Ln [(2 × FPG (mg/dL) + fasting TG (mg/dL)] × BMI (kg/m2))/(Ln[HDL-C (mg/dL]).
The correlations between all variables and the rates of decrease in eGFR were investigated. Additionally, patients were segregated into two categories: Group 1 with less than 30% decrease and Group 2 with more than 30% decrease in eGFR values in the postoperative first month period. An assessment was conducted to determine any disparity between the two groups regarding the variables.
All data analyses were processed using SPSS software version 22.0 (IBM SPSS Statistics, IBM Corporation, Armonk, NY, USA). The distribution of data was examined using the Kolmogorov–Smirnov test. Categorical data were expressed as counts with percentages, while normally distributed continuous variables were shown as mean ± standard deviation (SD), and non-normally distributed continuous variables were shown as median and interquartile range (IQR). The relationship between variables and the eGFR decrease rate was evaluated using Spearman’s correlation. Group comparisons were analysed with an independent t-test or a Mann–Whitney U-test. A p < 0.05 was considered statistically significant.
RESULTS
A total of 107 patients were included in the concluding analyses. The average age of the patients was 46.82 ±12.82 years; 69 (64.4%) were females, and 38 (35.5%) were males. None of the patients had metabolic syndrome or diabetes or other systemic diseases, except for controlled hypertension in 5 patients and hypothyroidism in another 5 patients in 4 due to thyroidectomy). While the mean preoperative eGFR value was 99.71 ± 15.66 mL/min/1.73m2, the mean eGFR value during the first postoperative month was 68.16 ± 14.78 mL/min/1.73m2. The decrease rate in the mean eGFR was calculated as 31.81% ± 8.87% (median; IQR 33.09; 25.55 – 38.64). The demographic traits of the study cohort and laboratory values are shown in Table I as mean and percentage values.
Table I: General characteristics of the study population.
|
Age (years) (mean ± SD) |
46.82 (±12.84) |
|
Gender (male/female, %) |
38 (35.5%) / 69 (64.4%) |
|
Side (right/left, %) |
20 (18.6%) / 87 (81.3%) |
|
BMI (mean ± SD) |
27.51 (±4.84) |
|
Preoperative eGFR (mL/min/1.73m2) (mean ± SD) |
99.71 (±15.66) |
|
Postoperative eGFR (mL/min/1.73m2) (mean ± SD) |
68.16 (±14.78) |
|
Fasting plasma glucose (mg/dL) (mean ± SD) |
92.06 (±9.93) |
|
HbA1c (%) (mean ± SD) |
5.48 (±0.52) |
|
Triglycerides (mg/dL) (median, IQR) |
107 (78–165) |
|
HDL-C (mg/dL) (median, IQR) |
47 (39–57.8) |
|
TyG (mean ± SD) |
4.62 (±0.28) |
|
TyG-BMI (mean ± SD) |
127.61 (±24.86) |
|
TG/HDL-C (median, IQR) |
2.28 (1.6-3.82) |
|
METS-IR (mean ± SD) |
41.06 (±8.6) |
|
eGFR decrease rate (%) (median, IQR) |
33.09 (25.55 – 38.64) |
When the correlations of eGFR decrease rate with other variables were examined, weak positive correlations with age, triglyceride, HDL-C, TyG, TG/HDL-C, and METS-IR were found (Table II). A scatter plot of the IR indices that were significantly correlated with the rate of eGFR decline is shown in Figure 1.
In the groups separated according to eGFR decrease rate, no statistically significant associations with age, BMI, FPG, HbA1c, TG, HDL-C, TyG, TyG-BMI, TG/HDL-C, and METS-IR were observed between the groups (p > 0.05, Table III).
Table II: Correlations between eGFR decrease rate and variables.
|
|
eGFR decrease rate |
|
|
Age |
p r |
0.01* 0.24 |
|
BMI |
p r |
0.1 0.15 |
|
Fasting plasma glucose |
p r |
0.58 0.05 |
|
HbA1c |
p r |
0.06 0.18 |
|
Triglyceride |
p r |
0.04* 0.19 |
|
HDL-C |
p r |
0.04* -0.19 |
|
TyG |
p r |
0.04* 0.19 |
|
TyG-BMI |
p r |
0.05 0.19 |
|
TG/HDL-C |
p r |
0.02* 0.21 |
|
METS-IR |
p r |
0.02* 0.21 |
|
*p <0.05 |
||
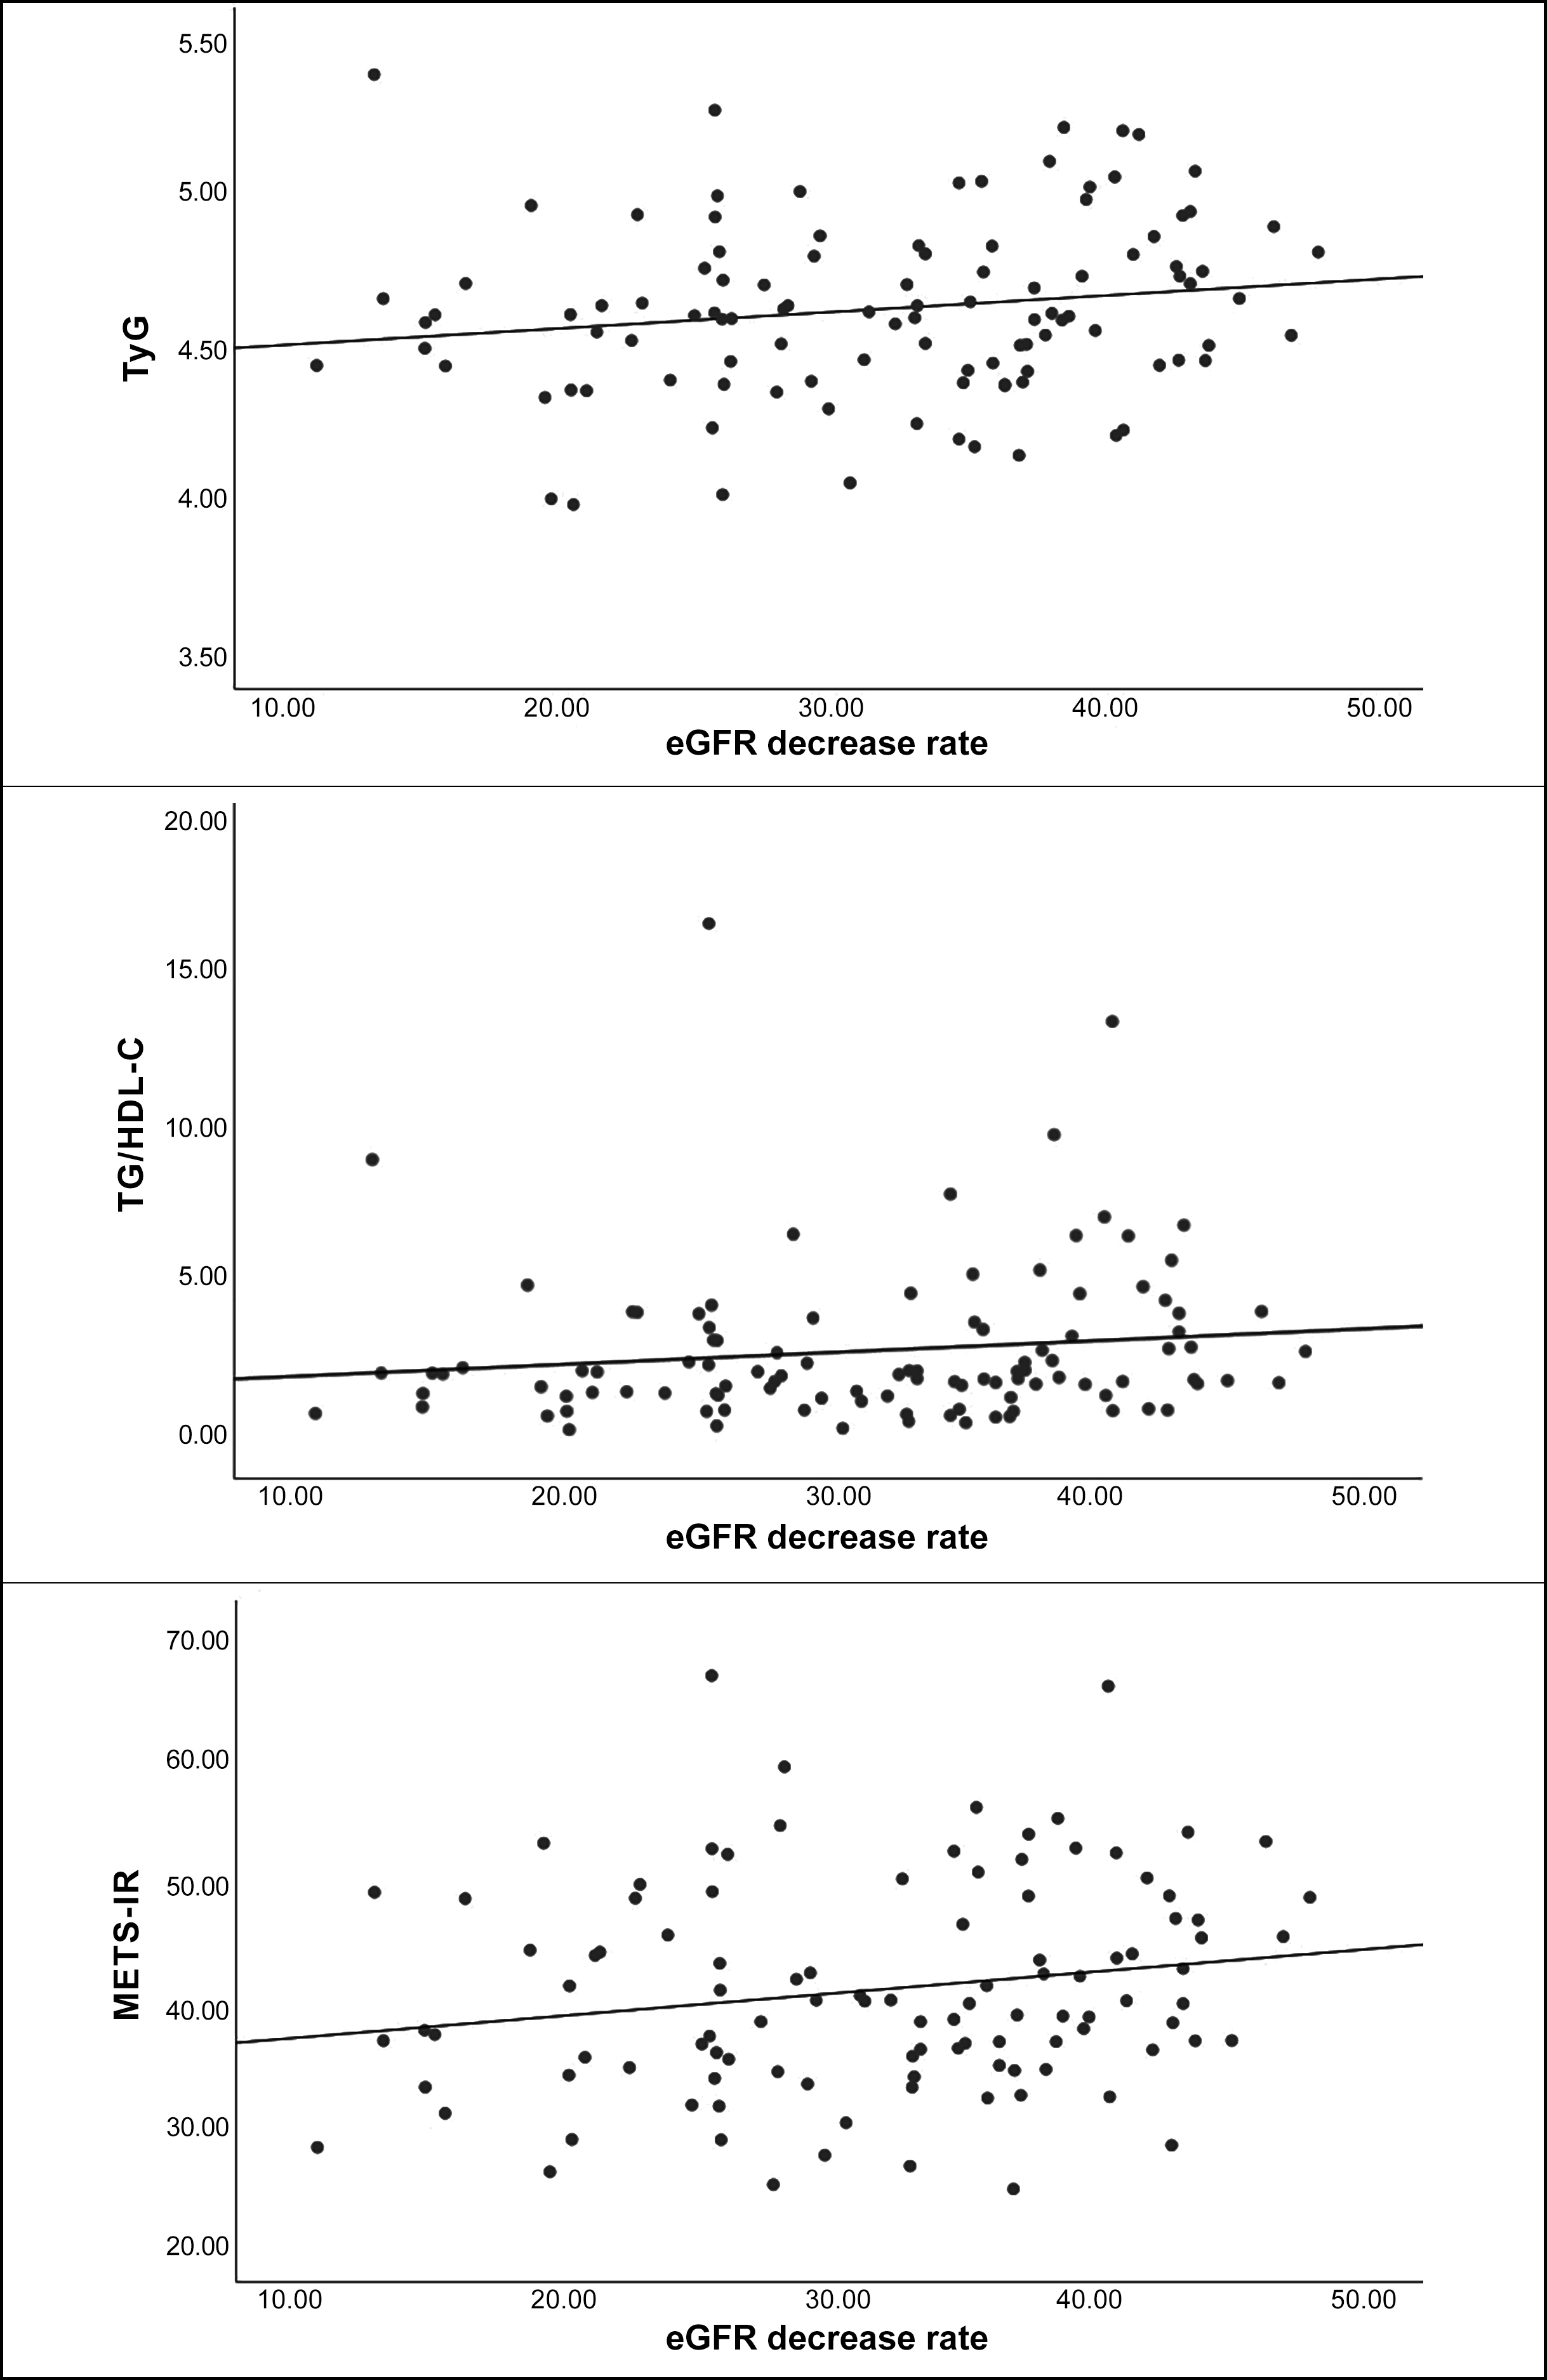 Figure 1: Scatter plot of eGFR reduction rate and IR indices.
Table III: Comparison of IR indexes and variables in groups separated by eGFR decrease rate.
|
|
Group 1 (n = 45) (eGFR decrease rate <30%) |
Group 2 (n = 62) (eGFR decrease rate ≥30%) |
p-value |
|
Age (years) (mean ± SD) |
44.4 (±13.86) |
48.58 (±11.85) |
0.09 a |
|
BMI (mean ± SD) |
27.12 (±5.68) |
27.79 (±4.16) |
0.47 a |
|
Fasting plasma glucose (mg/dL) (mean ± SD) |
91 (±10.68) |
92.82 (±9.36) |
0.35 a |
|
HbA1c (%) (mean ± SD) |
5.37 (±0.51) |
5.56 (±0.52) |
0.06 a |
|
Triglycerides (mg/dL) (median, IQR) |
103 (74–147) |
114 (83–176) |
0.41 b |
|
HDL-C (mg/dL) (median, IQR) |
48.6 (43.5–57.9) |
44.8 (38.15–57.2) |
0.31 b |
|
TyG (mean ± SD) |
4.59 (±0.29) |
4.65 (±0.27) |
0.34 a |
|
TyG-BMI (mean ± SD) |
124.92 (±27.78) |
129.57 (±22.53) |
0.34 a |
|
TG/HDL-C (median, IQR) |
2.3 (1.59–3.4) |
2.24 (1.59–4.3) |
0.39 b |
|
METS-IR (mean ± SD) |
40.08 (±9.25) |
41.78 (±8.1) |
0.31 a |
|
a Independent t-test, b Mann–Whitney U-test. |
|||
DISCUSSION
Insulin resistance is defined as the inability of fat, muscle, and liver cells to generate a necessary or adequate response to insulin released by the pancreas. The association of chronic kidney disease with IR, even in the absence of diabetes, has long been known.5 The effective mechanism of IR in kidney injury involves activating the sympathetic nervous system, retaining sodium, diminished sodium-potassium adenosine triphosphatase activity, and worsening renal haemodynamic through increased GFR.14 It has been suggested that IR plays an essential role in the pathogenesis of Type 2 Diabetes and the development of microvascular complications associated with it.15
Insulin resistance reportedly is both a marker of microalbuminuria and a factor contributing to the development of microalbuminuria in non-diabetic individuals.16 In fact, it is known that the presence of albuminuria is also an important marker for the risk of developing end-stage renal disease.
A few epidemiological studies reported a positive association between IR and the risk of microalbuminuria in non-diabetic patients.16,17 In a 6-year prospective study of a small population, Fujikawa et al. showed that HOMA-IR levels were notably elevated in participants who developed microalbuminuria or proteinuria.16 They also deduced that insulin resistance manifests before the onset of microalbuminuria. In the Insulin Resistance Atherosclerosis Study, Mykkanen et al., investigating the correlation between insulin sensitivity and microalbuminuria using a cross-sectional design, reported that decreased insulin sensitivity levels were associated with an increased prevalence of microalbuminuria.17 Given the retrospective nature of the study, the evaluation of albuminuria levels was not feasible. Nevertheless, the examination of eGFR reduction rates, alongside findings from other studies, led to results for the hypothesis, and an attempt was made to draw conclusions regarding the outcomes of the study.
The correlation between IR and the risk of chronic kidney disease (CKD) has been evaluated in several published studies. The Uppsala Longitudinal Study of Adult Men (ULSAM) and Strong Heart Study (SHS) concluded that IR suggests high CKD risk.18,19
However, controversial results have been reached in studies investigating the relationship between IR and eGFR. A study conducted in a population of non-diabetic middle-aged adults demonstrated that CKD risk ratios, evaluated via eGFR calculations in HOMA-IR quartiles, increased.20 Similarly, it has been shown that insulin sensitivity evaluated by oral glucose tests in an elderly population is inversely proportional to eGFR.21
Contrary to these results, Park et al., in a study conducted on 17,157 non-diabetic individuals who underwent voluntary routine health check-ups, concluded that there was no significant correlation between decreased kidney function and IR evaluated with HOMA-IR.22 Moreover, a study by Mohteshamzadeh et al. performed on a smaller number of normoglycemic men with treated hypertension showed no relation between IR and eGFR at 5-year follow-up.23
There are studies in the literature with small populations. Tanriover et al. showed a tendency for a short-term decrease in insulin sensitivity as assessed by HOMA-IR after donor nephrectomy, especially in obese donors.9 Shehab-Eldin et al. compared donors with healthy individuals in their study evaluating renal function and reported a significant decrease in GFR while IR increased in donors. They found no correlation between IR and spot GFR assessed in the first year in the donor group.10 However, preoperative and postoperative GFR evaluation was not performed as in this study. In a cohort study of Wuttiputhanun et al., the TyG index of donors increased more than controls, the eGFR of 77 donors decreased more than controls, and insulin resistance increased after donor nephrectomy compared to healthy individuals at 1-year follow-up. They concluded that kidney donors should be informed about these metabolic changes and told to comply with lifestyle recommendations that may reduce insulin resistance.11 The study found a weak correlation between IR indices and renal function.
Studies have shown that eGFR, which occurs shortly after donor nephrectomy, decreases by up to 28% and stabilises kidney functions approximately 1 month later.24 Further, it is known that 1 year after the operation, kidney functions decrease to about 30% of preoperative values.25 Based on this information, the study established a 1-month follow-up period as the stabilisation phase for kidney functions, with the eGFR reduction rate of 30% serving as the criterion for segregating the groups. However, the study failed to discern a statistical disparity between the two groups concerning the variables. Partial validation was observed to anticipate that eGFR values would undergo a more pronounced decrease in conjunction with heightened insulin resistance after donor nephrectomy.
There are several limitations to the study. As this is a retrospective study, its outcomes are limited. This design limitation also leads to drawbacks, such as the inability to assess microalbuminuria due to the retrospective nature of the study. Simple, inexpensive, and easily applicable indices that can be obtained from routine blood analysis were used instead of the gold standard euglycemic clamp in the evaluation of IR. The fact that the patients had not yet been diagnosed with other etiologic causes of IR may have caused us to find a significant association in the limited results of our study. Also, since donor nephrectomy is a surgery performed on healthy individuals and thus many patients do not have long-term follow-ups, analyses were made with early-term GFR values. This study contributes to the existing knowledge in the literature, as well as guiding future research on this topic.
CONCLUSION
While there are guidelines for evaluating current risks in selecting living kidney donors, some findings are controversial. Insulin resistance may be an evaluation parameter for donor candidates. With the limited results obtained in this study, it is suggested that a higher IR may be associated with the loss of postoperative renal functions. Hence, large-scale prospective cohort studies are required for the confirmation of these results, and further research is required to elucidate the potential pathophysiological mechanisms underlying the cause-and-effect relationship between IR and renal functions in non-diabetic individuals.
ETHICAL APPROVAL:
All procedures performed in studies involving human participants were in accordance with the ethical standards of the Ufuk University Faculty of Medicine Clinical Research Ethics Committee (Date: 11.11.2021, decision no: 2021.11.11.01/14) and the 1964 Helsinki Declaration and its later amendments or comparable ethical standards.
PATIENTS’ CONSENT:
Since it was designed as a retrospective study, the data were obtained from the electronic medical record system after the approval of the Ethics Committee.
COMPETING INTEREST:
The authors declared no conflict of interest.
AUTHORS’ CONTRIBUTION:
MY: Conception, design, statistical analysis, manuscript writing, and manuscript correction.
AED: Data collection, data interpretation, and supervision.
Both authors approved the final version of the manuscript to be published.
REFERENCES
- Issa N, Vaughan LE, Denic A, Kremers WK, Chakkera HA, Park WD, et al. Larger nephron size, low nephron number, and nephrosclerosis on biopsy as predictors of kidney function after donating a kidney. Am J Transplant 2019; 19(7):1989-98. doi: 10.1111/ajt.15259.
- Mandelbrot DA, Reese PP, Garg N, Thomas CP, Rodrigue JR, Schinstock C, et al. KDOQI US commentary on the 2017 KDIGO clinical practice guideline on the evaluation and care of living kidney donors. Am J Kidney Dis 2020; 75(3): 299-316. doi:10.1053/j.ajkd.2019.10.005.
- Nakashima A, Kato K, Ohkido I, Yokoo T. Role and treatment of insulin resistance in patients with chronic kidney disease: A review. Nutrients 2021; 13(12):4349. doi: 10.3390/nu13124349.
- Parvathareddy VP, Wu J, Thomas SS. Insulin resistance and insulin handling in chronic kidney disease. Compr Physiol 2023; 13(4):5069-76. doi: 10.1002/cphy.c220019.
- Pina AF, Borges DO, Meneses MJ, Branco P, Birne R, Vilasi A, et al. Insulin: Trigger and target of renal functions. Front Cell Dev Biol 2020; 8:519. doi: 10.3389/fcell.2020.00519.
- Ramdas Nayak VK, Satheesh P, Shenoy MT, Kalra S. Triglyceride glucose (TyG) index: A surrogate biomarker of insulin resistance. J Pak Med Assoc 2022; 72(5): 986-8. doi: 10.47391/JPMA.22-63.
- Raimi TH, Dele-Ojo BF, Dada SA, Fadare JO, Ajayi DD, Ajayi EA, et al. Triglyceride-glucose index and related para-meters predicted metabolic syndrome in nigerians. Metab Syndr Relat Disord 2021; 19(2):76-82. doi: 10.1089/met. 2020.0092.
- Bello-Chavolla OY, Almeda-Valdes P, Gomez-Velasco D, Viveros-Ruiz T, Cruz-Bautista I, Romo-Romo A, et al. METS-IR, a novel score to evaluate insulin sensitivity, is predictive of visceral adiposity and incident type 2 diabetes. Eur J Endocrinol 2018; 178(5):533-44. doi: 10.1530/EJE-17-0883.
- Tanriover B, Lingvay I, Ahmed F, Sandikci B, Mohan S, Cremers S, et al. Insulin sensitivity after living donor nephrectomy. Transplant Proc 2021; 53(6):1858-64. doi: 10.1016/j.transproceed.2021.06.007.
- Shehab-Eldin W, Shoeb S, Khamis S, Salah Y, Shoker A. Susceptibility to insulin resistance after kidney donation: A pilot observational study. Am J Nephrol 2009; 30(4):371-6. doi: 10.1159/000232577.
- Wuttiputhanun T, Udomkarnjananun S, Hanprathet N, Jiamjarasrangsi W, Townamchai N, Avihingsanon Y, et al. Metabolic effects of kidney donation: A Bayesian analysis of matched cohorts. Nephrology (Carlton) 2023; 28(2): 148- 53. doi: 10.1111/nep.14136
- Inker LA, Astor BC, Fox CH, Isakova T, Lash JP, Peralta CA, et al. KDOQI US commentary on the 2012 KDIGO clinical practice guideline for the evaluation and management of CKD. Am J Kidney Dis 2014; 63(5):713-35. doi: 10.1053/j. ajkd.2014.01.416.
- Bala C, Gheorghe-Fronea O, Pop D, Pop C, Caloian B, Comsa H, et al. The association between six surrogate insulin resistance indexes and hypertension: A population-based study. Metab Syndr Relat Disord 2019; 17(6): 328-33. doi: 10.1089/met.2018.0122.
- Gluba A, Mikhailidis DP, Lip GY, Hannam S, Rysz J, Banach M. Metabolic syndrome and renal disease. Int J Cardiol 2013; 164(2):141-50. doi: 10.1016/j.ijcard.2012.01.013.
- Owusu J, Barrett E. Early microvascular dysfunction: Is the vasa vasorum a "missing link" in insulin resistance and atherosclerosis. Int J Mol Sci 2021; 22(14):7574. doi: 10. 3390/ijms22147574.
- Fujikawa R, Okubo M, Egusa G, Kohno N. Insulin resistance precedes the appearance of albuminuria in non-diabetic subjects: 6 years follow up study. Diabetes Res Clin Pract 2001; 53(2):99-106. doi: 10.1016/s0168-8227(01)00241-8.
- Mykkänen L, Zaccaro DJ, Wagenknecht LE, Robbins DC, Gabriel M, Haffner SM. Microalbuminuria is associated with insulin resistance in nondiabetic subjects: The insulin resistance atherosclerosis study. Diabetes 1998; 47(5): 793-800. doi: 10.2337/diabetes.47.5.793.
- Nerpin E, Risérus U, Ingelsson E, Sundström J, Jobs M, Larsson A, et al. Insulin sensitivity measured with euglycemic clamp is independently associated with glomerular filtration rate in a community-based cohort. Diabetes Care 2008; 31(8):1550-55. doi: 10.2337/dc08-0369.
- Zhang Y, Lee ET, Howard BV, Best LG, Umans JG, Yeh J, et al. Insulin resistance, incident cardiovascular diseases, and decreased kidney function among nondiabetic American Indians: The Strong Heart Study. Diabetes Care 2013; 36(10):3195-200. doi: 10.2337/dc12-2368.
- Chen J, Muntner P, Hamm LL, Fonseca V, Batuman V, Whelton PK, et al. Insulin resistance and risk of chronic kidney disease in nondiabetic US adults. J Am Soc Nephrol 2003; 14(2):469-77. doi: 10.1097/01.asn.0000046029. 53933.09.
- de Boer IH, Katz R, Chonchol MB, Fried LF, Ix JH, Kestenbaum B, et al. Insulin resistance, cystatin C, and mortality among older adults. Diabetes Care 2012; 35 (6):1355-60. doi: 10.2337/dc11-1657.
- Park JH, Oh SW, Ahn SY, Kim S, Na KY, Chae DW, et al. Decreased estimated glomerular filtration rate is not directly related to increased insulin resistance. Diabetes Res Clin Pract 2013; 99(3):366-71. doi: 10.1016/j.diabres. 2012.12.006.
- Mohteshamzadeh M, Wong C, Whiticar R, Thomas S. Is there a link between insulin resistance and chronic kidney disease in men with treated hypertension? Analysis of 5-year data. Am J Nephrol 2009; 29(2):116-22. doi: 10.1159/ 000151490
- Anukoolphaiboon A, Chalieopanyarwong V, Attawettayanon W, Leetanaporn K, Tanthanuch M, Pripatnanont C. Renal function after donor nephrectomy at a tertiary medical center in Southern Thailand. Insight Urology 2020; 41(1): 25-9.
- Theil G, Weigand K, Fischer K, Bialek J, Fornara P. Organ-specific monitoring of solitary kidney after living donation by using markers of glomerular filtration rate and urinary proteins. Urol Int 2021; 105(11-12):1061-7. doi: 10.1159/ 000515674.