Clinicopathological and Survival Characteristics of Mismatch Repair Status and PD-1 Expression in Serous Ovarian Cancer
By Fatma Olmez1, Suleyman Cemil Oglak2, Sedat Akgol3, Omer Fatih Olmez4, Ahmet Bilici4, Ozgur Akbayir5, Zeynep Gedik Ozkose1, Esra Can1, Omer Unal1, Hicran Acar Sirinoglu6Affiliations
doi: 10.29271/jcpsp.2023.06.666ABSTRACT
Objective: To evaluate the clinicopathological characteristics of mismatch repair (MMR) deficiency and its clinical outcomes by performing immunohistochemistry (IHC) for MMR genes in the serous ovarian cancer (SOC) tumour sections.
Study Design: A retrospective case-control study.
Place and Duration of the Study: Gynecology Department of Kanuni Sultan Süleyman Training and Research Hospital, and Department of Medical Oncology of Medipol University, between March 2001 and January 2020.
Methodology: IHC was carried out for MLH1, MSH2, MSH6, and PMS2 on full-section slides from 127 SOCs to evaluate the MMR status. MMR-negative and MMR-low groups together were defined as MMR deficient and called microsatellite instability-high (MSI-H). The MSI status and expression of programmed cell death-1 (PD-1) were compared in SOCs with different MMR statuses.
Results: A significantly higher frequency of MMR-deficient SOCs was diagnosed at early stages compared with the patients in the MSS group (38.6% and 20.6%, respectively, p=0.022). The frequency of cases with PD-1 expression was significantly higher in the MSI-H group (76.2%) than in the MSS counterparts (58.8%, p=0.028). Patients in the MSI-H group had significantly longer DFS (25.6 months) and OS (not reached) than those in the MSS group (16 months and 48.9 months, p=0.039 and p=0.026, respectively).
Conclusion: MSI-H SOCs were diagnosed at an earlier stage as compared to MMR proficient cases. The presence of PD-1 expression was significantly higher in cases presenting MMR deficiency compared with MMR-proficient cases. MSI status was significantly associated with DFS and OS.
Key Words: Serous ovarian cancer, Microsatellite instability, Mismatch repair deficiency.
INTRODUCTION
Every year, 239,000 women (3.6% of all cancer patients) are diagnosed with ovarian cancer globally and it is estimated to cause over 150,000 deaths (4.3%).1
Because of the absence of efficient screening methods and its nonspecific early symptoms, about two-thirds of patients present in the advanced stages at the time of diagnosis, with a five-year survival rate below 45%.2-4 About 90% of primary ovarian cancers arise from the epithelial cells, and high-grade serous ovarian cancer (SOC) comprise 70-80% of malignant epithelial ovarian cancers.5,6 The classification of epithelial ovarian cancer was mainly based on the clinical and pathological components that are inadequate to display the complex cascade of cellular occurrences that leads to the clinical behaviour of these cancers, and this classification is of limited prognostic significance.7 The histologic subtypes of this cancer demonstrate differences regarding genetic and epidemiologic risk factors, precursor lesions, morphological characteristics, tumour spread pattern, and response to treatment.8 Thus, an exact classification of these cancers both molecularly and morphologically is crucial to choose the most suitable therapy for each patient.9
Microsatellites are DNA motifs comprised of short nucleotide fragments. Because of the significant amount of repeats in DNA segments, microsatellites are vulnerable to replication stress during DNA replication, which may increase the possibility of defects and result in a high mutation rate.10 The DNA mismatch repair (MMR) pathway identifies and repairs the mismatches that develop throughout DNA replication, mainly by four essential enzymes coded for by the MMR genes, including PMS2, MSH2, MLH1, and MSH6. Microsatellite instability (MSI) is the exhibition of MMR pathway deficiency that ends in higher mutation rates across the genome, causing oncogenesis.11 The deficiency of the MMR pathway can result from either somatic or germline mutations. A germline mutation of one of the inherited MMR genes causes Lynch syndrome. MMR deficiency might also sporadically develop because of the MMR pathway’s somatic mutations.11,12
MMR deficiency driving MSI and malignancy has been recognised in different types of cancer. Colorectal and endometrial cancers with MMR deficiency present significantly higher tumour-infiltrating lymphocytes (TIL) and programmed death-ligand 1 (PD-L1) expression and are sensitive to immune checkpoint blockade therapy with anti-programmed death-1 (anti-PD-1) antibodies.13 However, the function of the MMR pathway and the presence of MSI in the pathogenesis of SOC remains unclear. Moreover, the clinicopathologic characteristics of SOC cases with MMR deficiency have yet to be defined with contradictory results on the concord of MMR deficiency with the presence of MSI.14,15 Therefore, the current study sought to evaluate the clinicopathological characteristics of MMR deficiency and its clinical outcomes by performing immunohistochemistry (IHC) for MMR genes in the SOC tumour sections. The aim of this study was to identify the programmed cell death-1 (PD-1) expression and the MSI phenotype among SOC cases with varying MMR status, and assess their relationship with the deficiency of MMR.
METHODOLOGY
A retrospective case-control study was conducted in a consecutive series of 268 patients with primary SOC, who were diagnosed between March 2001 and January 2020. Cases who had sufficient tumour samples and clinical data in their medical files were included in this study. Patients with unavailable or incomplete medical records were excluded. A total of 127 patients had adequate tumour samples and clinical data for analysis. IHC was carried out on 3 μm full-section slides from formalin-fixed paraffin-embedded (FFPE) tumour blocks stained with hematoxylin and eosin (H&E). Then, a senior gynaecological pathologist reviewed H&E-stained slides and initial pathology records. Tumours were classified histologically based on the WHO criteria and staged by the FIGO system. FFPE blocks from cytoreductive surgery were retrieved from the Gynaecology Department of Kanuni Sultan Süleyman Training and Research Hospital, and partly from Department of Medical Oncology of Medipol University following the approval from the institutional review board of Medipol University (10840098-604.01.01-E.17851).
After surgery, tumour relapse or progress was detected by physical exam, serum CA-125 levels, and imaging. The follow-up duration was defined as the period from surgical procedure to phone contact/last clinic visit, or death.
FFPE tumour tissue sections of each high-grade SOC patient were analysed for MSI and PD-1 by the IHC method. Concisely, FFPE full-section slides were dewaxed, hydrated, and rinsed with phosphate buffer saline (PBS) repeatedly. Endogenous peroxidase activity was inhibited with 3% hydrogen peroxide. Primary antibodies against MMR proteins (MSH6, MSH2, PMS2, MLH1) and PD-1 proteins were added at 65°C over an hour, respectively. Then, the sections were reacted with biotinylated goat anti-mouse IgG antibody and per-oxidase-labelled streptavidin successively. These sections were detected by the streptomycin-avidin-biotin-peroxidase complex technique, followed by the colour rendering with diaminobenzidine (DAB) and counterstaining with H&E. Finally, slide dehydration and sealing were performed routinely. These antibodies were provided by Medaysis Company, CA, USA. Normal colonic crypt epithelium adjacent to the stromal cells, lymphoid cells, and tumour was labelled as internal positive controls. MMR proteins were situated in the nucleus. For assessing MMR protein expression, sections were scored by percentages of tumour cell nuclei staining: complete loss of staining (0%), reduced expression (1%–25%), and moderate to strong expression (26%–100%). Nuclear staining of normal lymphocytes and/or stromal cells in each slide was utilised as a positive internal control. Tumours with moderate to strong expression of all four MMR proteins were labelled as MMR proficiency. Tumours that lost staining or showed reduced expression of any MMR protein were labelled as MMR-negative and MMR-low, respectively.16 MMR-negative and MMR-low groups together were defined as MMR deficient and called MSI-high (MSI-H). Patients were divided into two groups as MMR-proficient group (n=68) and the MMR-deficient group (n=59). Moreover, PD1 protein expression was considered positive if tumour cells and micro-environment positive staining have more than 1% staining were present.17
Statistical analysis was made utilising IBM SPSS Statistics for Windows, version 22.0. The authors utilised descriptive statistics to summarise baseline features. Descriptive statistics were expressed as counts and percentages for categorical variables and mean ± standard deviation for continuous variables. The Mann-Whitney U test was used to compare continuous variables without normal distribution. The independent samples t-test was used to compare continuous variables with normal distribution. Kolmogorov-Smirnov and Shapiro-Wilk tests were used to test the normality distribution. Pearson χ2 test and Fisher’s exact test were utilised to determine the relationship between clinicopathological elements, PD1 and MSI status in patients with SOC. The Kaplan–Meier method was utilised to create the survival curves of patients and the comparisons via the Log-Rank test. Disease-free survival (DFS) was defined as the period from curative surgery to the recurrence of tumour, death, or loss in follow-up. Overall survival (OS) was described as the period from diagnosis to the patient’s death date or loss in follow-up. Univariate analysis was performed to assess the significance of clinicopathological features as prognostic variables. Multivariate analysis with the Cox proportional hazards model was used to identify the independent prognostic variables for OS and DFS. Multivariate analysis was used to identify the independence of these variables. The p-values <0.05 were deemed statistically significant.
RESULTS
Tumour samples of 127 women with SOC underwent IHC staining for the status of MMR. A total of 59 patients (46.5%) were classified as MMR-deficient, while 68 patients (53.5%) demonstrated moderate to strong expression of four MMR proteins and were labelled as MMR-proficient. Out of the 59 patients that had an abnormality in MMR protein expression, 53 patients (41.7%) showed reduced expression of at least one MMR protein (MMR-low), and 6 patients (4.8%) exhibited entirely lost expression of at least one MMR protein (MMR-negative). The frequency of patients with nuclear loss in MMR proteins was 19.7% (n=25) for MLH1, 15.7% (n=20) for MSH6, 13.7% (n=17) for PMS2, and 11% (n=14) for MSH2.
The relationship between clinicopathological factors and MSI in patients with SOC was presented in Table I. In the MSI-H group, women ranged in age from 33 to 79 years, with a mean of 55.31 ± 12.38 years, while patients’ ages ranged between 26-83 years, with a mean of 56.09 ± 10.68 years in the MSS group (p=0.62). Twenty-one (35.6%) of patients were below the age of 50 years at diagnosis in the MSI-H group, and 17 (25%) of patients were diagnosed <50 years in the MSS group (p=0.13). The groups were similar concerning pre-operative CA125 level, receiving neoadjuvant or adjuvant chemotherapy, and surgery type. FIGO stage I or II cancer was diagnosed in 38.6% of patients (n=22) in the MSI-H group. In the MSS group, 20.6% of the patients (n=14) had FIGO stage I or II SOC at the diagnosis time. Consequently, a significantly higher frequency of MMR-deficient SOCs was diagnosed at early stages compared with the patients in the MSS group (p=0.022). Figure 1 demonstrates the PD-1 expression in intratumour al lymphocytes. The proportion of patients with PD-1 expression was significantly higher in the MSI-H group (n=45, 76.2%) than in the MSS counterparts (n=40, 58.8%, p=0.028).
The median follow-up duration was 33.5 months for the entire study population. The median DFS was 19.9 months, and the median OS was 37.5 months (ranging between 3.7-94.9 months) for the whole study cohort. Figures 2 and 3 demonstrate the Kaplan-Meier curves of DFS and OS, respectively. Cases in the MSI-H group had significantly longer DFS (25.6 months) and OS (not reached) than those in the MSS group (16 months and 48.9 months, p=0.039 and p=0.026, respectively). As summarised in Table II, the MSI status of the patients was a significant positive prognostic factor for DFS (p=0.039) in the univariate analysis. However, in the multivariate analysis, the MSI status of the women did not remain a significant prognostic factor for DFS (p=0.42, Table II). As demonstrated in Table III, the MSI status of the individuals was significantly related to OS (p=0.026) in the univariate analysis, but, on multivariate analysis MSI status did not remain a significant predictor variable for OS (p=0.48).
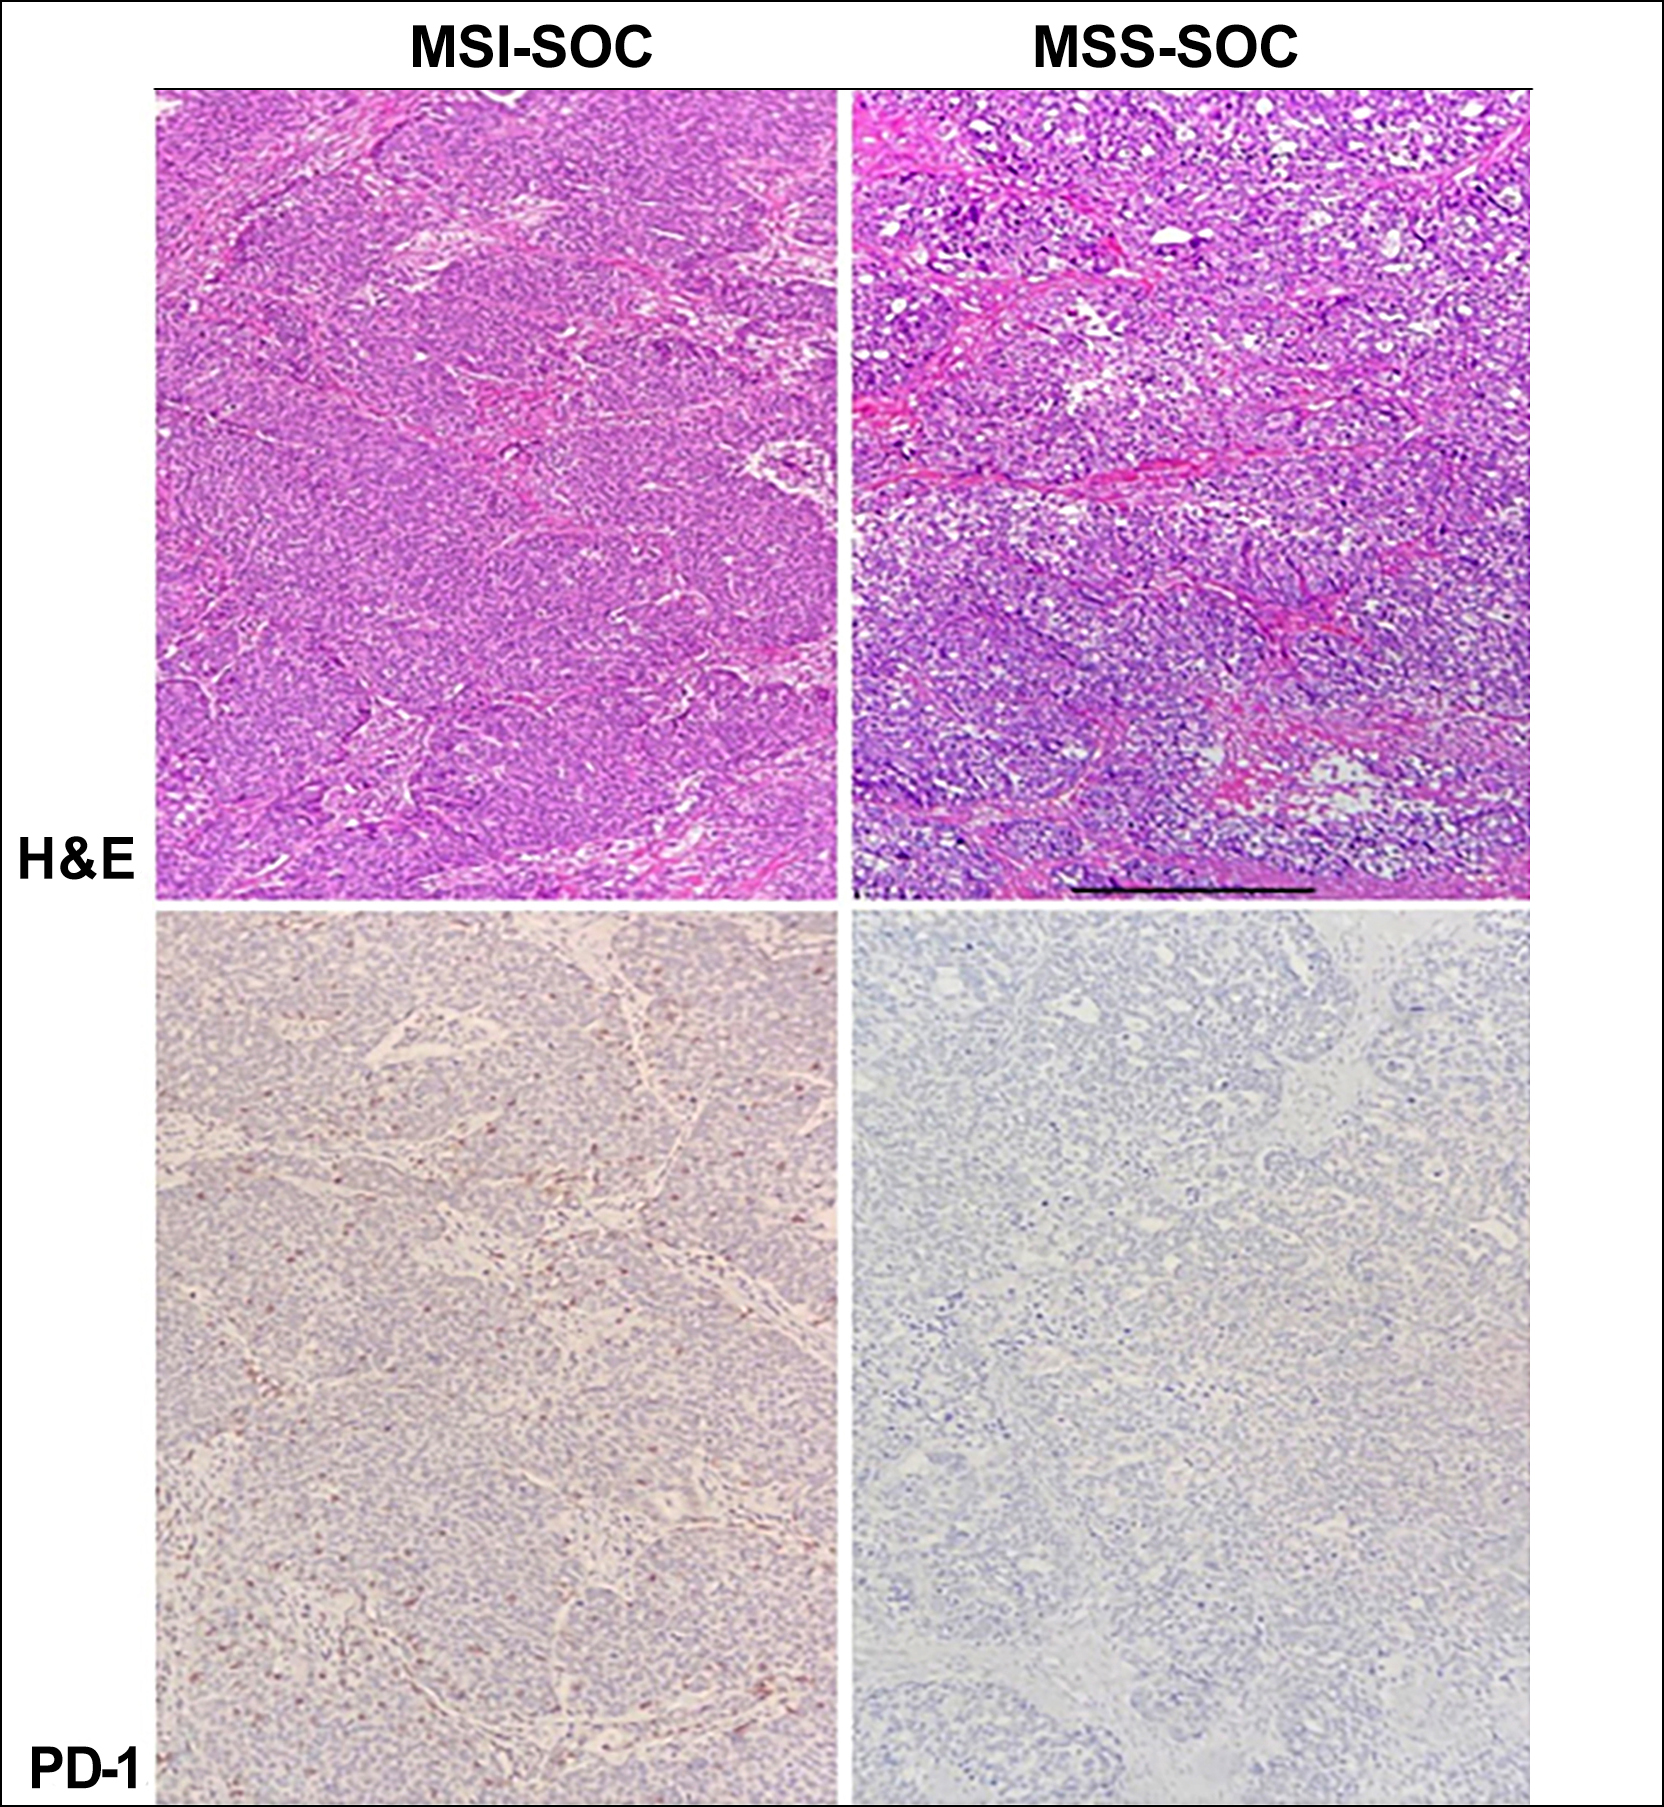 Figure 1: The PD-1 expression in intratumour allymphocytes.
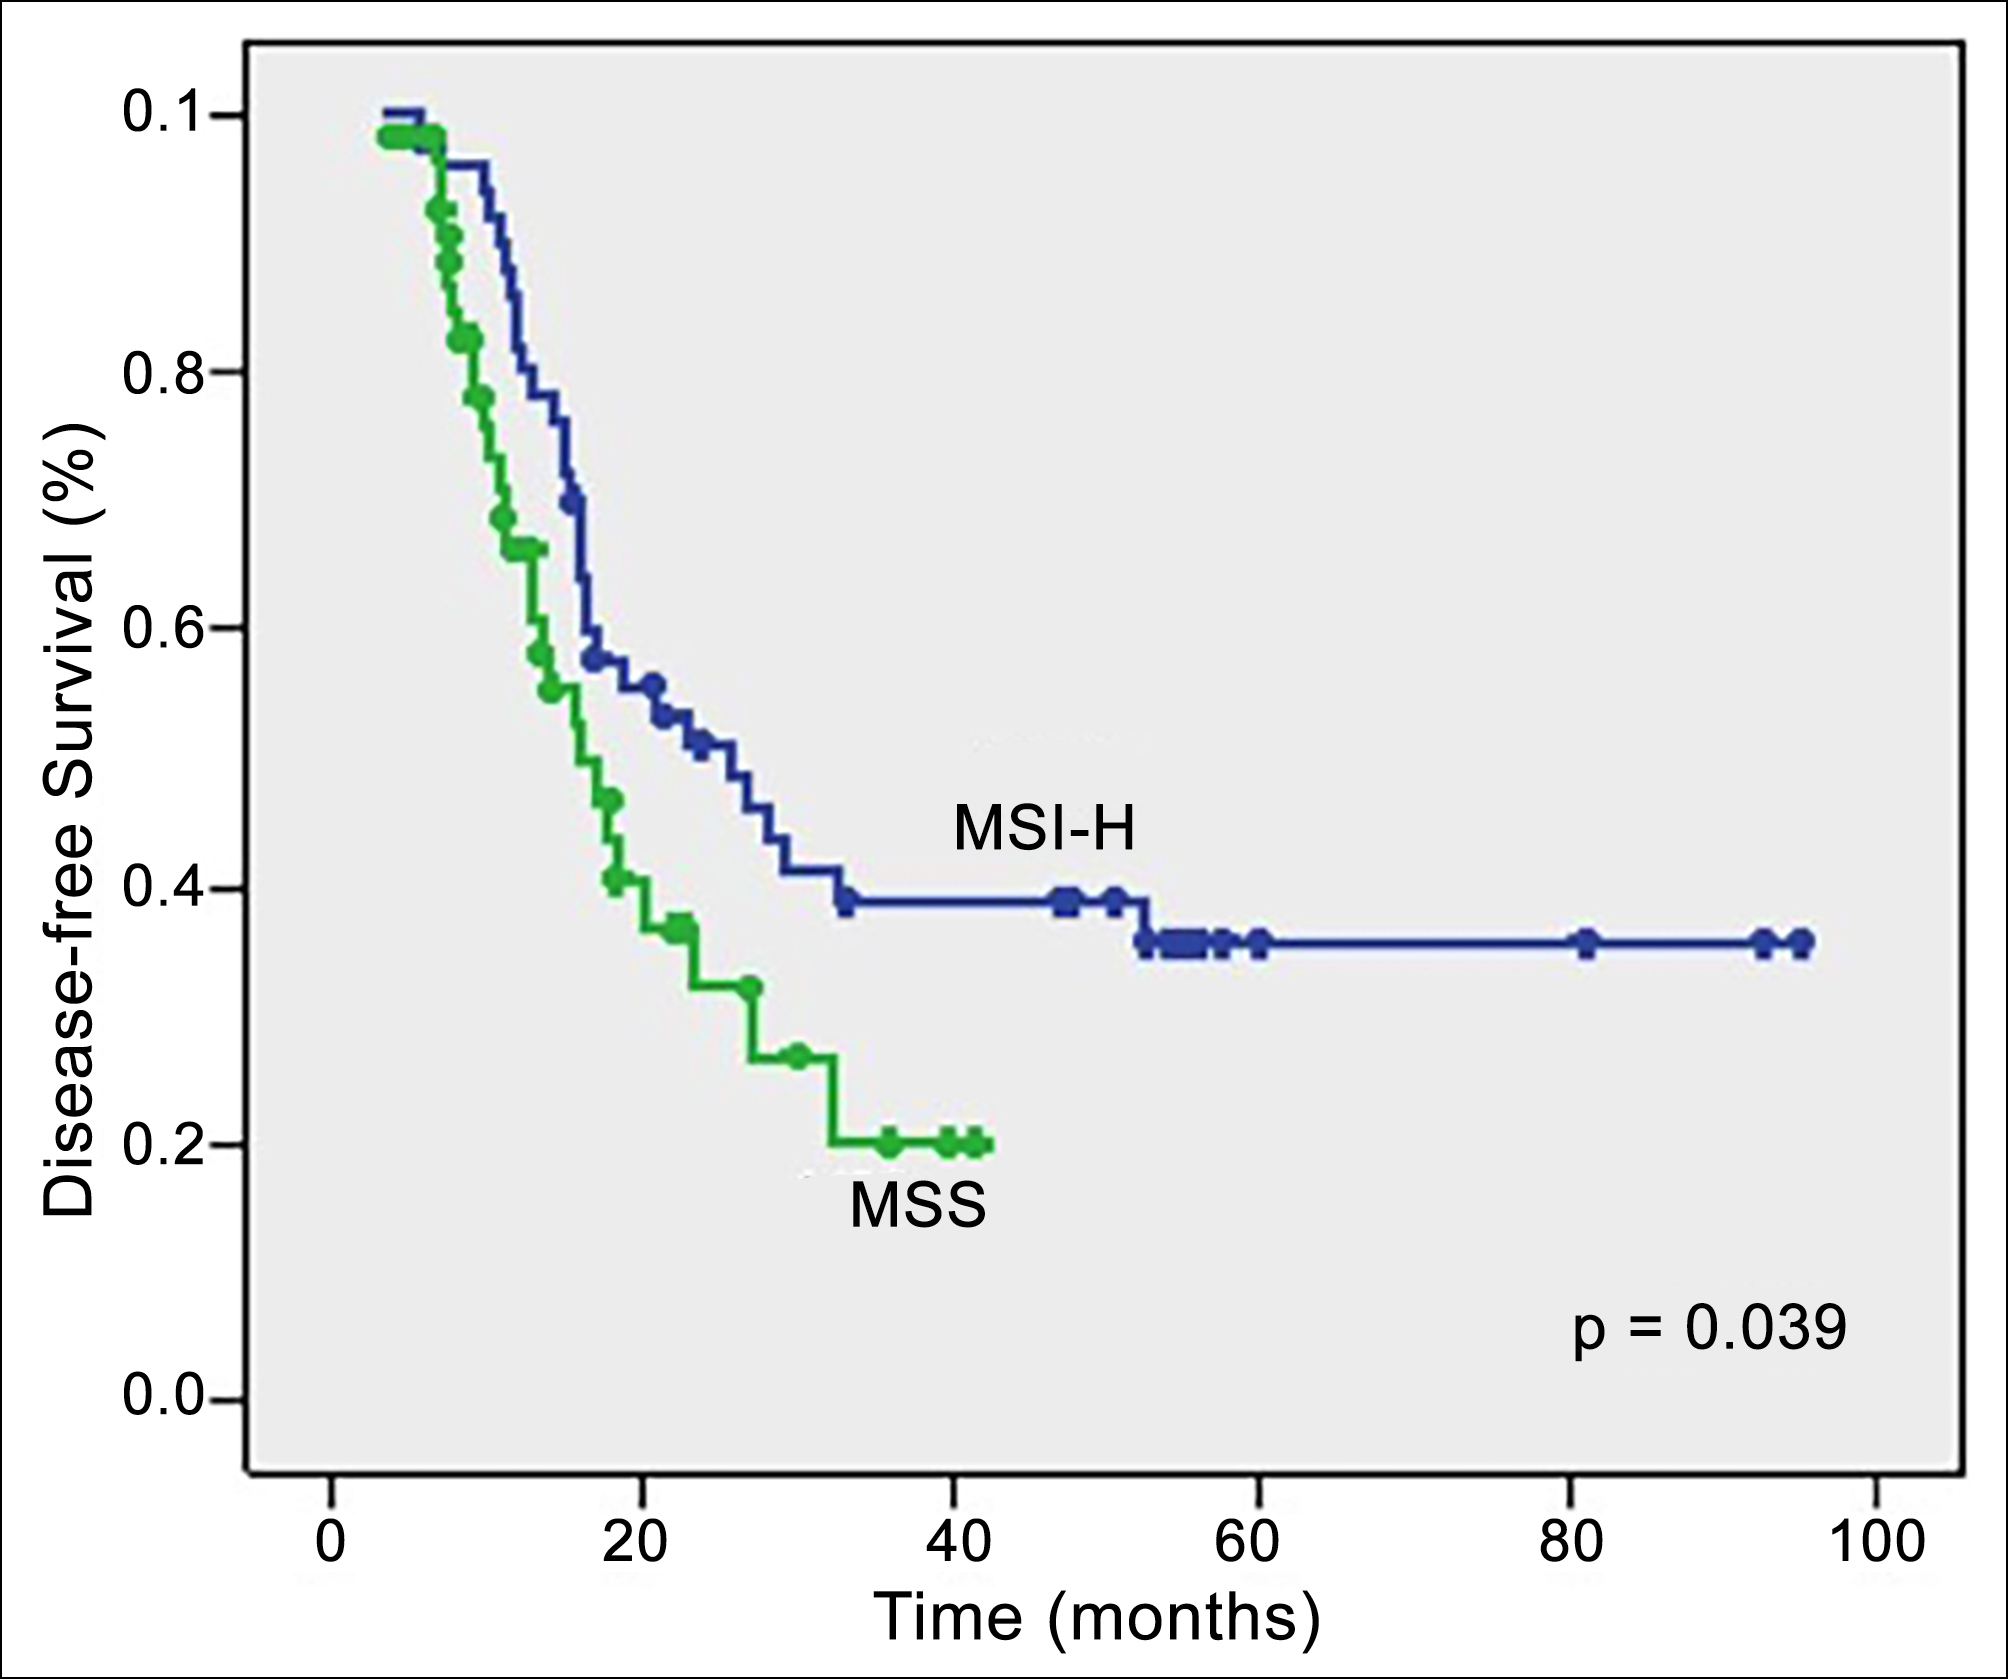 Figure 2: Analysis of disease-free survival regarding MMR status.
Log Rank test was applied with p<0.05 indicating statistical significance.
DFS: disease-free survival; OS: overall survival; MMR,: mismatch repair; MSS: microsatellite stable; MSI-H: microsatellite instability high.
Table I: Relationship between clinicopathological factors and MSI in patients with serous ovarian cancer.
|
Factors |
MSI-H (n=59) |
MSS (n=68) |
p-value |
|
Age, years |
55.31 ± 12.38 (33-79) |
56.09 ± 10.68 (26-83) |
0.62* |
|
Age (years), n (%) <50 >50 |
21 (35.6) 38 (64.4) |
17 (25.0) 51 (75.0) |
0.13 |
|
Pre-operative CA125 level, U/mL |
765.47 ± 1256.50 |
797.32 ± 1691.88 |
0.92* |
|
Neoadjuvant chemotherapy, n (%) Absence Presence |
44 (77.2) 13 (22.8) |
52 (77.6) 15 (22.4) |
0.56 |
|
Adjuvant chemotherapy, n (%) Absence Presence |
2 (3.5) 55 (96.5) |
4 (6.1) 62 (93.9) |
0.41 |
|
Surgery type, n (%) Maximal debulking Optimal debulking Suboptimal debulking Inoperable |
45 (80.4) 7 (12.5) 4 (7.1) - |
48 (71.6) 13 (19.4) 4 (6.0) 2 (3.0) |
0.40 |
|
Tumour grade, n (%) 1 2 3 |
6 (10.5) 24 (42.1) 27 (47.4) |
4 (5.9) 5 (7.4) 59 (86.8) |
<0.001 |
|
FIGO Stage, n (%) I-II III-IV |
22 (38.6) 35 (61.4) |
14(20.6) 54 (79.4) |
0.022 |
|
PD-1 expression, n (%) Negative Positive |
14 (23.8) 45(76.2) |
28 (41.9) 40 (58.8) |
0.028 |
|
*Student’s t-test or Mann-Whitney U-test and all others from Pearson χ2 test. |
|||
Table II: Univariate and multivariate analysis of risk factors for DFS in patients with serous ovarian cancer.
|
Factors |
Median DFS time (months) |
Univariate p-value |
Multivariate p-value |
HR (95% CI) |
|
Age (year) <50 >50 |
23.0 17.0 |
0.42
|
|
|
|
Neoadjuvant CT Absence Presence |
16.0 21.0 |
0.08
|
|
|
|
Adjuvant CT Absence Presence |
7.7 18.9 |
0.82
|
|
|
|
Surgery type Maximal debulking Optimal debulking Suboptimal debulking Inoperable |
28.3 15.7 11.5 6.9 |
<0.001
|
<0.001 |
2.0 (1.45-2.76) |
|
Tumour grade 1 2 3 |
NR 25.6 16.9 |
0.041
|
0.15 |
1.44 (0.86-2.39) |
|
FIGO Stage I-II III-IV |
52.4 16.9 |
0.046
|
0.51 |
1.26 (0.62-2.59) |
|
MSI status MSI-H MSS |
25.6 16.0 |
0.039 |
0.42 |
1.29 (0.68-2.43) |
|
PD-1 expression Negative Positive |
23.5 18.4 |
0.64
|
0.18 |
0.67 (0.38-1.21) |
Table III: Univariate and multivariate analysis of risk factors for OS in patients with serous ovarian cancer.
|
Factors |
Median OS time (months) |
Univariate p-value |
Multivariate p-value |
HR (95% CI) |
|
Age (year) <50 >50 |
NR 63.0 |
0.14
|
|
|
|
Neoadjuvant CT Absence Presence |
72.6 46.6 |
0.16
|
|
|
|
Adjuvant CT Absence Presence |
24.4 63.0 |
0.42
|
|
|
|
Surgery type Maximal debulking Optimal debulking Suboptimal debulking Inoperable |
NR 48.9 35.5 36.3 |
0.027
|
0.033 |
1.44 (0.96-2.16) |
|
Tumour grade 1 2 3 |
NA NR 59.3 |
0.044
|
0.32 |
1.40 (0.71-2.75) |
|
FIGO stage I-II III-IV |
NR 59.3 |
0.14
|
0.73 |
1.19 (0.44-3.21) |
|
MSI status MSI-H MSS |
NR 48.9 |
0.026 |
0.48 |
1.36 (0.56-3.28) |
|
PD-1 expression Negative Positive |
64.4 60.8 |
0.86
|
0.43 |
0.74 (0.35-1.56) |
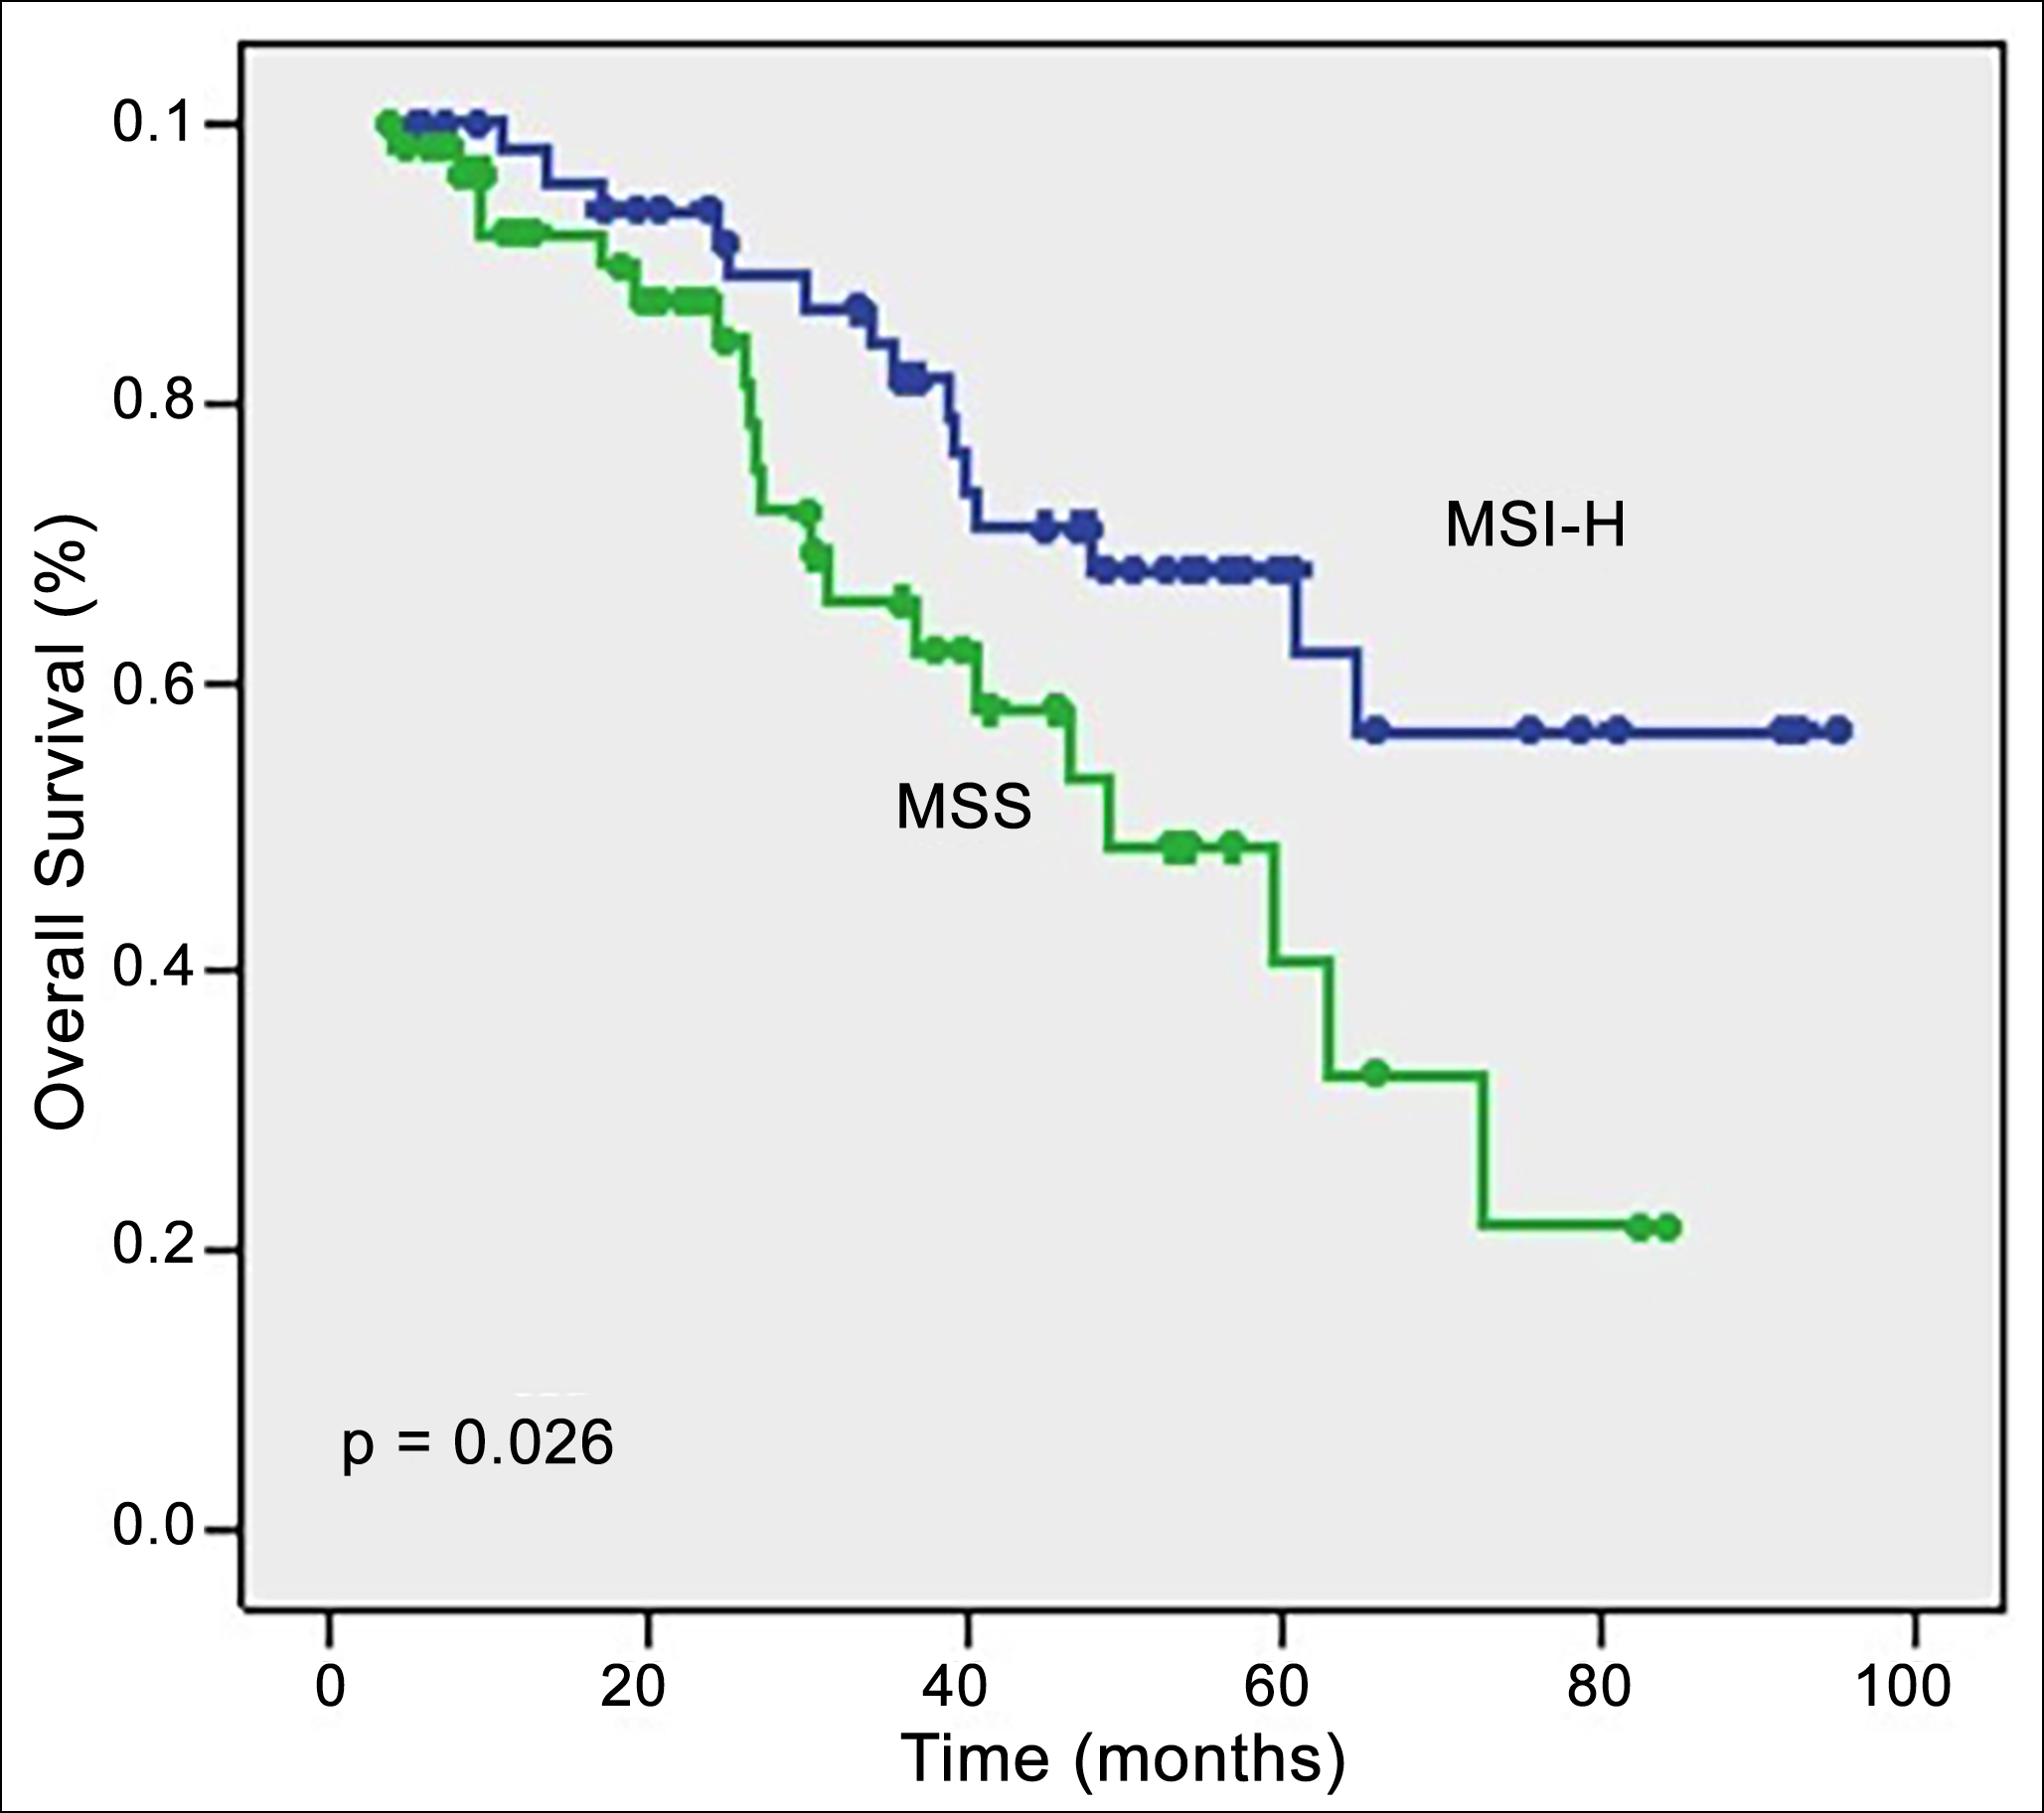 Figure 3: Nalysis of overall survival regarding MMR status.
DFS: disease-free survival; OS: overall survival; MMR,: mismatch repair; MSS: microsatellite stable; MSI-H: microsatellite instability high.
Log Rank test was applied with p<0.05 indicating statistical significance.
DISCUSSION
Sporadic ovarian cancers presented with a median age of 63 years in the entire population.6 Previous studies indicated that the mean onset age of ovarian cancers in germline mutation cases was between 45-51 years, which was 15-20 years earlier than the mean age of sporadic ovarian cancers, with a broad range of 19-82 years.18,19 In this study, the mean age at diagnosis in the MSI-H group was 55.31 ± 12.38 years, and 35.6% of these patients were below the age of 50 years when they were diagnosed with ovarian cancer. However, no significant difference was found regarding the age at diagnosis between the MSS group and the MSI-H group. In a study by Aktas et al., which analysed 667 unselected ovarian cancer cases from different regions in Turkey, the mean age at diagnosis among cases with no mutation was found to be 53.3 years.20 The mean age of onset of both of the ovarian cancer groups in this study population was similar to this study, suggesting the mean age at diagnosis of ovarian cancer in the Turkish population was earlier compared to the Western population and the unique biology behind this cancer. It was also stated that most of the MMR-deficient ovarian cancers were sporadic as the status of MMR germline mutation was unidentified.16
Approximately 80% of sporadic ovarian cancers are diagnosed at stage III-IV with overall survival of 36.8 months.21 However, ovarian cancer in patients with MMR deficiency tends to be diagnosed at an early stage with a range of 65-72%.16,18 Consistent with the literature, in this study, patients in the MSI-H group (38.6% of them had FIGO stage I-II ovarian cancer) were more frequently diagnosed at an earlier stage compared to the patients in the MSS group (20.6% of them had FIGO stage I-II ovarian cancer). The lower frequency of patients with early-stage cancer in this study group than in previous reports is because this study group consisted of only SOCs, while other reports consisted of all other subtypes of ovarian cancer.
Previous studies concluded that the most commonly influenced MMR protein in Lynch syndrome-associated ovarian cancer patients was MSH2 and followed by MLH1.18,19,22 In a recent study, Xiao et al. reported that the most commonly influenced MMR proteins were MLH-1 and PMS-2, while the frequency of MSH2 deficiency was the fewest in their study cohort. They suggested that most cases of MLH-1 deficiency are sporadic rather than inherited.16 In the present cohort, MLH-1 was the most commonly affected protein and followed by MSH-6. This finding also indicated the unique biology behind this cancer in the Turkish population.
Xiao et al. indicated that ovarian cancer in patients with MMR deficiency had better PFS than MSS cases and elucidate this conclusion with three main reasons, including a higher frequency of MMR-deficient ovarian cancers presented at early stages, most of the MMR-deficient patients were endometrioid subtype which has favourable prognosis than SOCs, and MMR-negative ovarian cancers manifested a higher number of CD8+ and CD3+ TILs which is correlated with better survival.16 Likewise, in this study, DFS and OS were significantly longer in the MSI-H group than in the MSS group. Univariate logistic regression analysis found that the MSI status of ovarian cancer patients was significantly associated with the DFS (p=0.039) and OS (p=0.026). However, the multivariate logistic regression analysis did not identify an association between the MSI status of the patients and DFS and OS. This finding can be explained mainly by the retrospective nature of the study, relatively low sample size, and relatively short duration of follow-up.
The cell surface PD-1 receptor is expressed by activated T-cells and has two ligands, of which PD-L1 can be expressed by tumour cells and adjacent immune cells.23 The binding of this ligand to PD-1 inhibits T-cell receptor signalling, ending in reduced T-cell proliferation and increased vulnerability to apoptosis.24,25 Anti-PD-1 immunotherapy promotes persistent T-cell activity to prevent these cells’ apoptosis and has been found to be effective in a broad variety of malignancies. MMR-deficient tumours are considered to evade the immune system by the upregulation of PD-L1 expression and the presence of MSI has been shown to be a crucial biomarker to predict which cancers might respond to anti-PD-1 immunotherapy.11 Xiao et al. found that MMR-deficient ovarian cancers displayed a higher PD-L1 expression in intratumour al immune cells than the MSS ovarian cancers and suggested that MMR-negative ovarian cancers could be more immunogenic than MSS ovarian cancers and might exhibit a better response to anti-PD-1 immunotherapy.16 Consistently, the presence of PD-1 expression was significantly higher in the patients with MSI-H than in the cases with MSS. Compared to MSS SOCs, MSI-H SOCs exhibited increased PD-1 expression in intratumour al immune cells. As a whole, these outcomes agree with the theory that MMR-deficient SOCs might be more immunogenic compared to MMR-proficient SOCs, and might be responsive to PD-1/PD-L1 blockade.13
The main limitations of this study are its retrospective nature and relatively short duration of follow-up. The other limitation is the absence of PCR amplification in confirming the presence of MMR deficiency. Also, this study did not investigate the effects of TILs infiltration on survival in patients with HGSOC, and the lack of this assessment could introduce another limitation. The main strength of this study is that few studies in the literature investigate the molecular and clinicopathologic features of MMR deficiency tumours in SOCs. To the best of the authors’ knowledge, this is the first investigation to date that has evaluated the MMR deficiency and PD-1 expression in tumour cells in SOC in the Turkish population.
CONCLUSION
MSI-H SOCs were diagnosed at an earlier stage as compared to MMR proficient cases. The presence of PD-L1 expression was significantly higher in patients presenting MMR deficiency compared with MMR proficient cases. Thus, these cases can be considered promising candidates for anti-PD-1 immunotherapy. MMR deficiency can be considered a prognostic biomarker for SOC patients. According to the univariate logistic regression analysis, MSI status was significantly associated with DFS and OS.
ETHICAL APPROVAL:
The institutional review board of Medipol University, Istanbul, Turkey approved the study project (10840098-604.01.01-E.17851).
PATIENTS’ CONSENT:
Informed consent were obtained from patients to publish the data.
COMPETING INTEREST:
The authors have no competing interest to declare.
AUTHORS’ CONTRIBUTION:
FO: Surgical and medical practices, concept, design, analysis or interpretation, and manuscript writing.
SCO: Design, analysis or interpretation, literature search, writing, and critical review.
SA: Surgical and medical practices, concept, data collection or processing.
OFO: Surgical and medical practices, concept, design, analysis or interpretation, and writing.
AB: Surgical and medical practices, design, analysis or interpretation.
OA: Surgical and medical practices, concept, design, and literature search.
ZGO, OU: Concept and data collection or processing.
EC: Design and data collection or processing.
HAS: Design and literature search.
All the authors have approved the final version of the manuscript to be published.
REFERENCES
- Ferlay J, Soerjomataram I, Dikshit R, Eser S, Mathers C, Rebelo M, et al. Cancer incidence and mortality worldwide: Sources, methods and major patterns in GLOBOCAN 2012. Int J Cancer 2015; 136(5):E359-86. doi: 10.1002/ijc.29210.
- Olmez F, Oglak SC, Olmez OF, Akbayır O, Yilmaz E, Akgol S, et al. High expression of CD8 in the tumour microenvironment is associated with PD-1 expression and patient survival in high-grade serous ovarian cancer. Turk J Obstet Gynecol 2022; 19(3):246-256. doi: 10.4274/tjod.galenos.2022. 59558.
- Akgol S, Akturk E, Yıldız Ozaydın Ipek, Olmez F, Karakas S, Oglak SC, et al. Serous epithelial ovarian cancer: Retrospective analysis of 260 cases. Aegean J Obstet Gynecol 2021; 3(1):19-21.
- Ocal E, Oglak SC. Ileri evre (Evre IIIC ve IV) Epitelial over kanserli hastalarda lenf nodu diseksiyonunun Sagkalıma Etkisi. Muga Sitki Kocman Universitesi Tıp Dergisi 2020; 7(1):40-4.
- Devouassoux-Shisheboran M, Genestie C. Pathobiology of ovarian carcinomas. Chin J Cancer 2015; 34(1):50-5.
- Flaum N, Crosbie EJ, Edmondson RJ, Smith MJ, Evans DG. Epithelial ovarian cancer risk: A review of the current genetic landscape. Clin Genet 2020; 97(1):54-63. doi: 10.1111/cge.13566.
- Zhang Z, Huang K, Gu C, Zhao L, Wang N, Wang X, et al. Molecular subtyping of serous ovarian cancer based on multi- omics data. Sci Rep 2016; 6:26001. doi: 10.1038/srep26001.
- Prat J, D'Angelo E, Espinosa I. Ovarian carcinomas: At least five different diseases with distinct histological features and molecular genetics. Hum Pathol 2018; 80:11-27. doi: 10. 1016/j.humpath.2018.06.018.
- Leskela S, Romero I, Cristobal E, Pérez-Mies B, Rosa-Rosa JM, Gutierrez-Pecharroman A, et al. Mismatch repair deficiency in ovarian carcinoma: Frequency, causes, and consequences. Am J Surg Pathol 2020; 44(5):649-56. doi: 10.1097/PAS.0000000000001432.
- Vieira ML, Santini L, Diniz AL, Munhoz Cde F. Microsatellite markers: What they mean and why they are so useful. Genet Mol Biol 2016; 39(3):312-28. doi: 10. 1590/1678-4685-GMB-2016-0027.
- Deshpande M, Romanski PA, Rosenwaks Z, Gerhardt J. Gynecological cancers caused by deficient mismatch repair and microsatellite ınstability. Cancers (Basel) 2020; 12(11): 3319. doi: 10.3390/cancers12113319.
- Vanderwalde A, Spetzler D, Xiao N, Gatalica Z, Marshall J. Microsatellite instability status determined by next-generation sequencing and compared with PD-L1 and tumour mutational burden in 11,348 patients. Cancer Med 2018; 7(3):746-56. doi: 10.1002/cam4.1372.
- Le DT, Durham JN, Smith KN, Wang H, Bartlett BR, Aulakh LK, et al. Mismatch repair deficiency predicts response of solid tumour s to PD-1 blockade. Science 2017; 357 (6349):409-13. doi: 10.1126/science.aan6733.
- Lee JH, Cragun D, Thompson Z, Coppola D, Nicosia SV, Akbari M, et al. Association between IHC and MSI testing to identify mismatch repair-deficient patients with ovarian cancer. Genet Test Mol Biomarkers 2014; 18(4): 229- 35. doi: 10.1089/gtmb.2013.0393.
- Shilpa V, Bhagat R, Premalata CS, Pallavi VR, Krishnamoorthy L. Microsatellite instability, promoter methylation and protein expression of the DNA mismatch repair genes in epithelial ovarian cancer. Genomics 2014; 104(4):257-63. doi: 10.1016/j.ygeno.2014.08.016.
- Xiao X, Dong D, He W, Song L, Wang Q, Yue J, et al. Mismatch repair deficiency is associated with MSI phenotype, increased tumour -infiltrating lymphocytes and PD-L1 expression in immune cells in ovarian cancer. Gynecol Oncol 2018; 149(1):146-54. doi: 10.1016/j.ygyno.2018. 02.009.
- Buisseret L, Garaud S, de Wind A, Van den Eynden G, Boisson A, Solinas C, et al. Tumour -infiltrating lymphocyte composition, organisation and PD-1/ PD-L1 expression are linked in breast cancer. Oncoimmunol 2016; 6(1): e1257452. doi: 10.1080/2162402X.2016.1257452.
- Helder-Woolderink JM, Blok EA, Vasen HF, Hollema H, Mourits MJ, De Bock GH. Ovarian cancer in Lynch syndrome; a systematic review. Eur J Cancer 2016; 55:65-73. doi: 10.1016/j.ejca.2015.12.005.
- Ryan NAJ, Evans DG, Green K, Crosbie EJ. Pathological features and clinical behavior of Lynch syndrome-associated ovarian cancer. Gynecol Oncol 2017; 144(3):491-5. doi: 10.1016/j.ygyno.2017.01.005.
- Aktas D, Gultekin M, Kabacam S, Alikasifoglu M, Turan AT, Tulunay G, et al. Identification of point mutations and large rearrangements in the BRCA1 gene in 667 Turkish unselected ovarian cancer patients. Gynecol Oncol 2010; 119(1):131-5. doi: 10.1016/j.ygyno.2010.05.018.
- Gorodnova T, Sokolenko A, Ni V, Ivantsov A, Kotiv K, Petrik S, et al. BRCA1-associated and sporadic ovarian carcinomas: Outcomes of primary cytoreductive surgery or neoadjuvant chemotherapy. Int J Gynecol Cancer 2019; 29(4): 779-86. doi: 10.1136/ijgc-2018-000175.
- Bonadona V, Bonaïti B, Olschwang S, Grandjouan S, Huiart L, Longy M, et al. French cancer genetics network. Cancer risks associated with germline mutations in MLH1, MSH2, and MSH6 genes in Lynch syndrome. JAMA 2011; 305 (22):2304-10. doi: 10.1001/jama.2011.743.
- Okazaki T, Chikuma S, Iwai Y, Fagarasan S, Honjo T. A rheostat for immune responses: the unique properties of PD-1 and their advantages for clinical application. Nat Immunol 2013; 14(12):1212-8. doi: 10.1038/ni.2762.
- Riley JL. PD-1 signaling in primary T cells. Immunol Rev 2009; 229(1):114-25. doi: 10.1111/j.1600- 065X.2009. 00767.x.
- Webb JR, Milne K, Kroeger DR, Nelson BH. PD-L1 expression is associated with tumour -infiltrating T cells and favorable prognosis in high-grade serous ovarian cancer. Gynecol Oncol 2016; 141(2):293-302. doi: 10.1016/j.ygyno.2016. 03.008.