Bioinformatics Analysis Screened and Identified Key Genes as Potential Biomarkers for Progression of Lung Cancer
By Ying Chen1, Xing-Kai Wang2, Yan Wang3, Jun-Wei Zong4, Shou-Yu Wang4, Xian-Yao Wan5Affiliations
doi: 10.29271/jcpsp.2022.06.712ABSTRACT
Objective: To screen and identify key genes as potential biomarkers of lung cancer using bioinformatics analysis.
Study Design: Observational study.
Place and Duration of Study: Department of Critical Care Medicine, the First Affiliated Hospital of Dalian Medical University, Dalian, Liaoning Province, China, from August 2018 to April 2021.
Methodology: Independent microarray datasets (GSE85841 and GSE118370) were downloaded from the Gene Expression Omnibus (GEO) database and the differentially expressed genes (DEGs) were screened using GEO2R. Cytohubba was employed to identify the hub genes. Cellular component analysis, hierarchical clustering, and survival analyses of hub genes were performed via BiNGO, UCSC, and cBioPorta. A series of analyses of FGF2 and PIK3R1 were conducted using Oncomine.
Results: A total of 463 DEGs were identified and 11 hub genes were determined. BDNF, FGF2, JAK2, NCAM1, CAV1, TJP1, and PIK3R1 may affect the survival probability and life expectancy of lung cancer patients, but the p-values were not statistically significant. FGF2 and PIK3R1 had the highest node degrees, 40 and 32 respectively. The expression of FGF2 and PIK3R1 were significantly lower in the 4 lung cancer data sets compared with non-lung cancer tissues. And the low expression of FGF2 and PIK3R1 is related to tumor grades, family history of cancer, multiple tumors present, and prior therapy of lung cancer.
Conclusion: Evaluation of FGF2 and PIK3R1 as potential biomarkers can contribute to the subsequent theoretical analysis of potential molecular mechanisms and development of lung cancer, so that the diagnosis of lung cancer may be more accurate, and it is possible to provide therapeutic and prognostic medicine targets.
Key Words: Lung neoplasms, Differentially expressed genes, Bioinformatical analysis, Microarray analysis, biomarkers.
INTRODUCTION
Lung cancer is still the leading cause of death among all cancers worldwide. It is roughly classified as a small cell (SCLC) and non-small cell lung cancer (NSCLC), accounting for approximately 15% and 85% of all lung cancers, respectively.1
A growing body of evidence indicates that mutation and abnormal expression of genes, including CIZ1, IL-6, CRP, IL-8, Oct4, and FGFRL1, as well as mutations of tumor-suppressor genes, are involved in metastasis, carcinogenesis, and progression of lung cancer. A variant of CIZ1 has been found to be a molecular surface biomarker of tumor cells in early circulating lung cancer cells.2 According to NCI-MD case-control study, elevated levels of IL-6, CRP, and IL-8 suggest the possibility of lung cancer and contribute to the diagnosis, and were verified in the NCI prostate, lung, colorectal, and ovarian (PLCO) cancer screening test.3 Oct4 is expressed in cancer cells and promotes the polarisation of M2 macrophages by up-regulating the secretion of M-CSF, leading to the occurrence and metastasis of tumors.4 The silencing of FGFRL1 with low expression enhanced the ability of lung cancer cells to metastasize, while over-expression inhibited metastasis.5
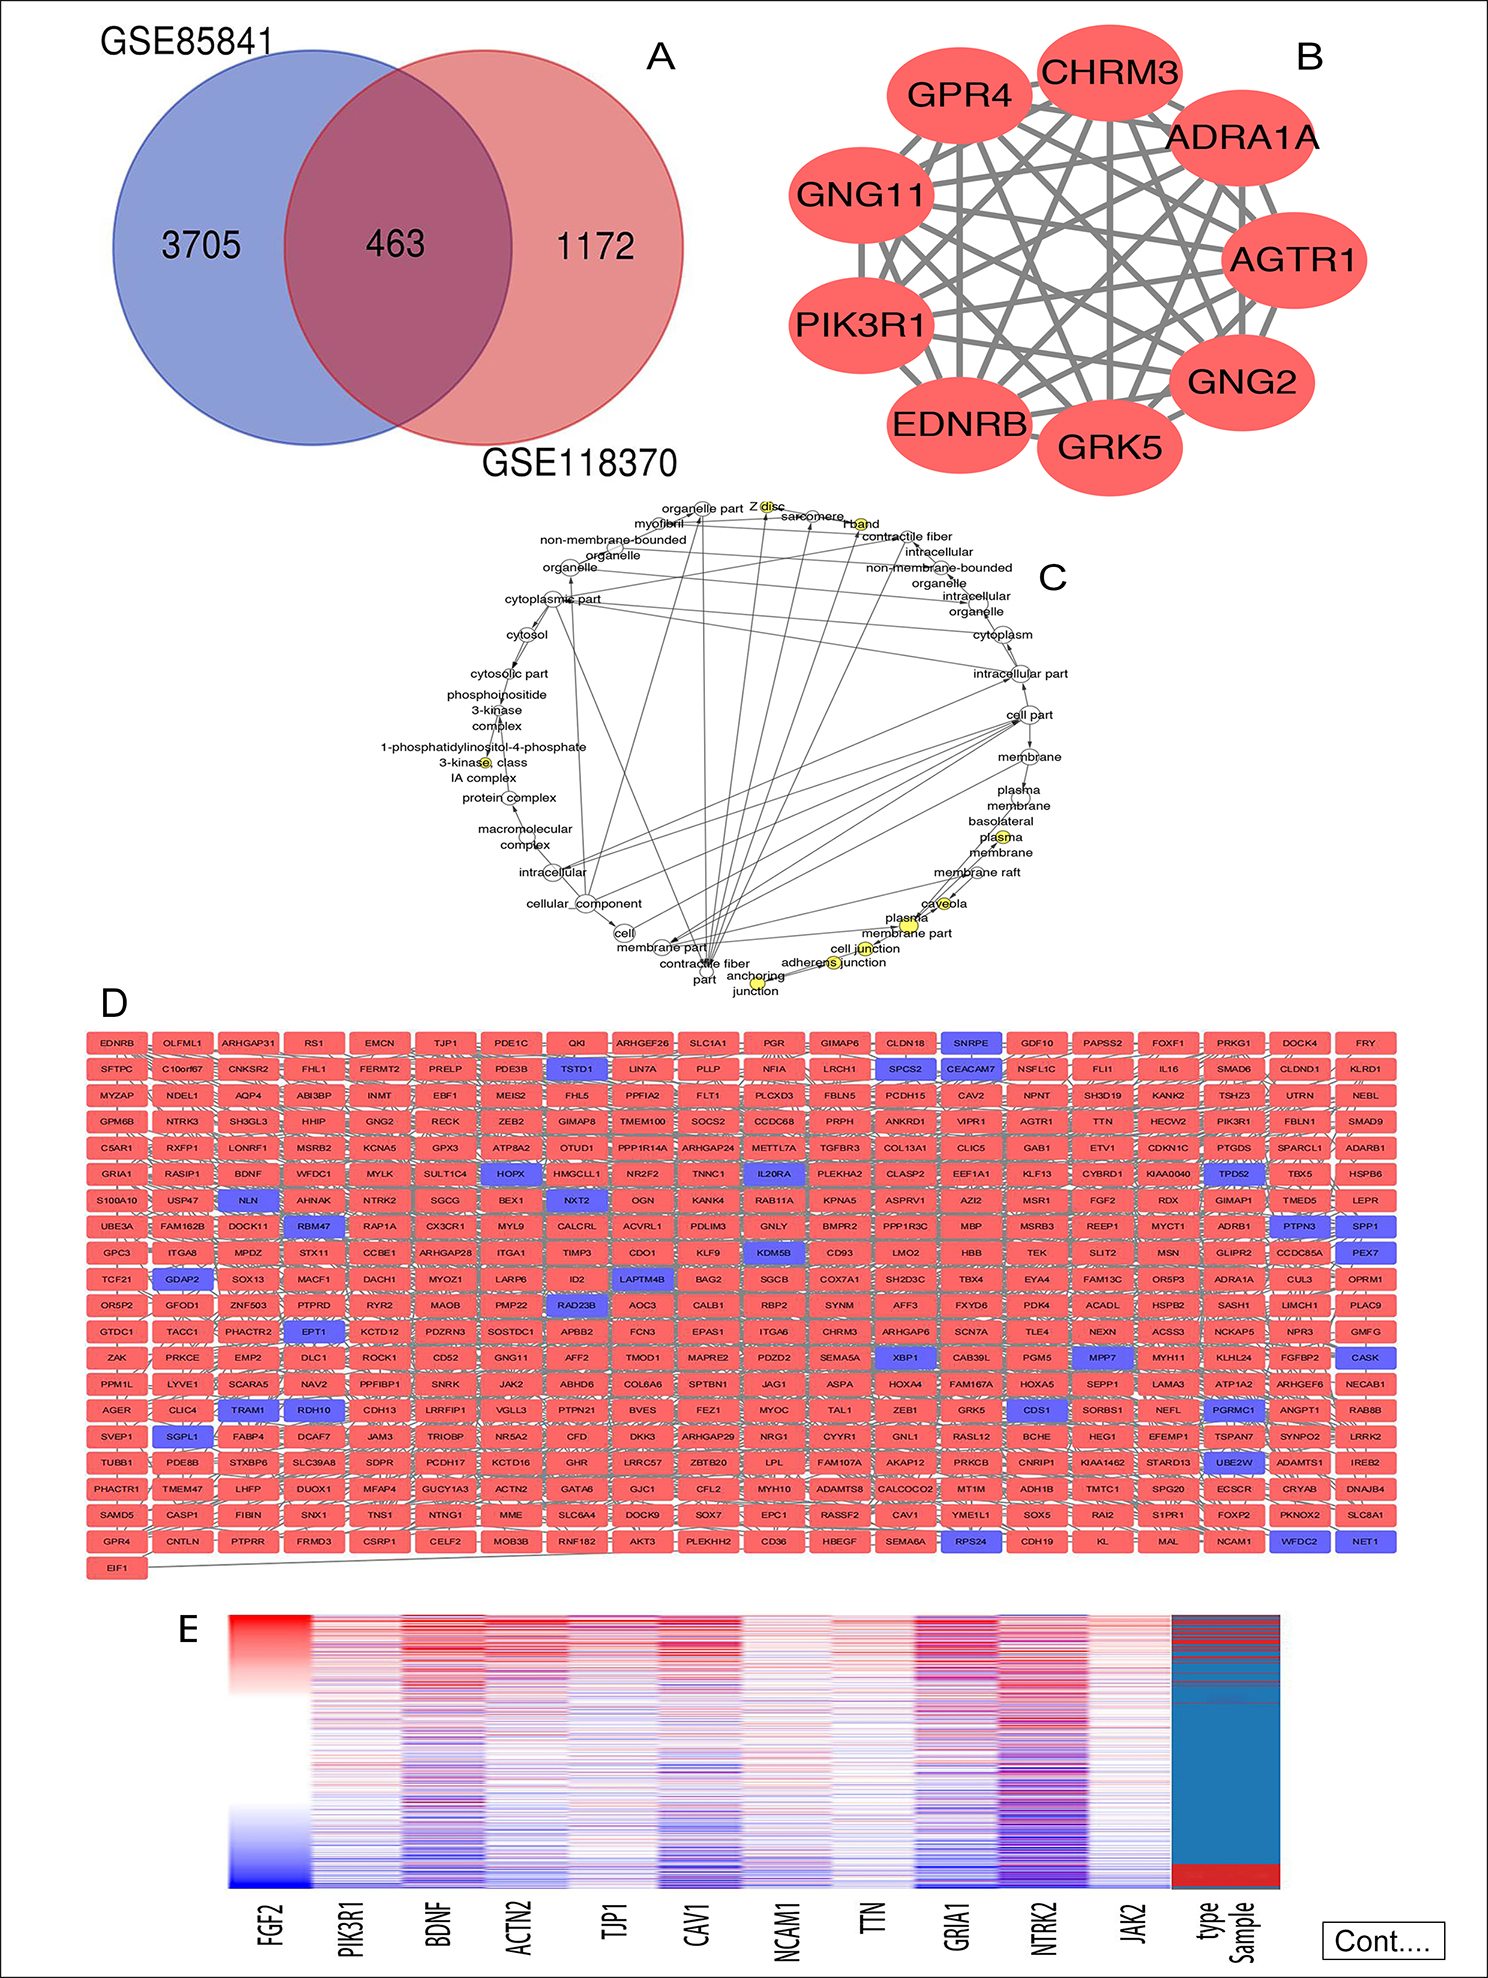
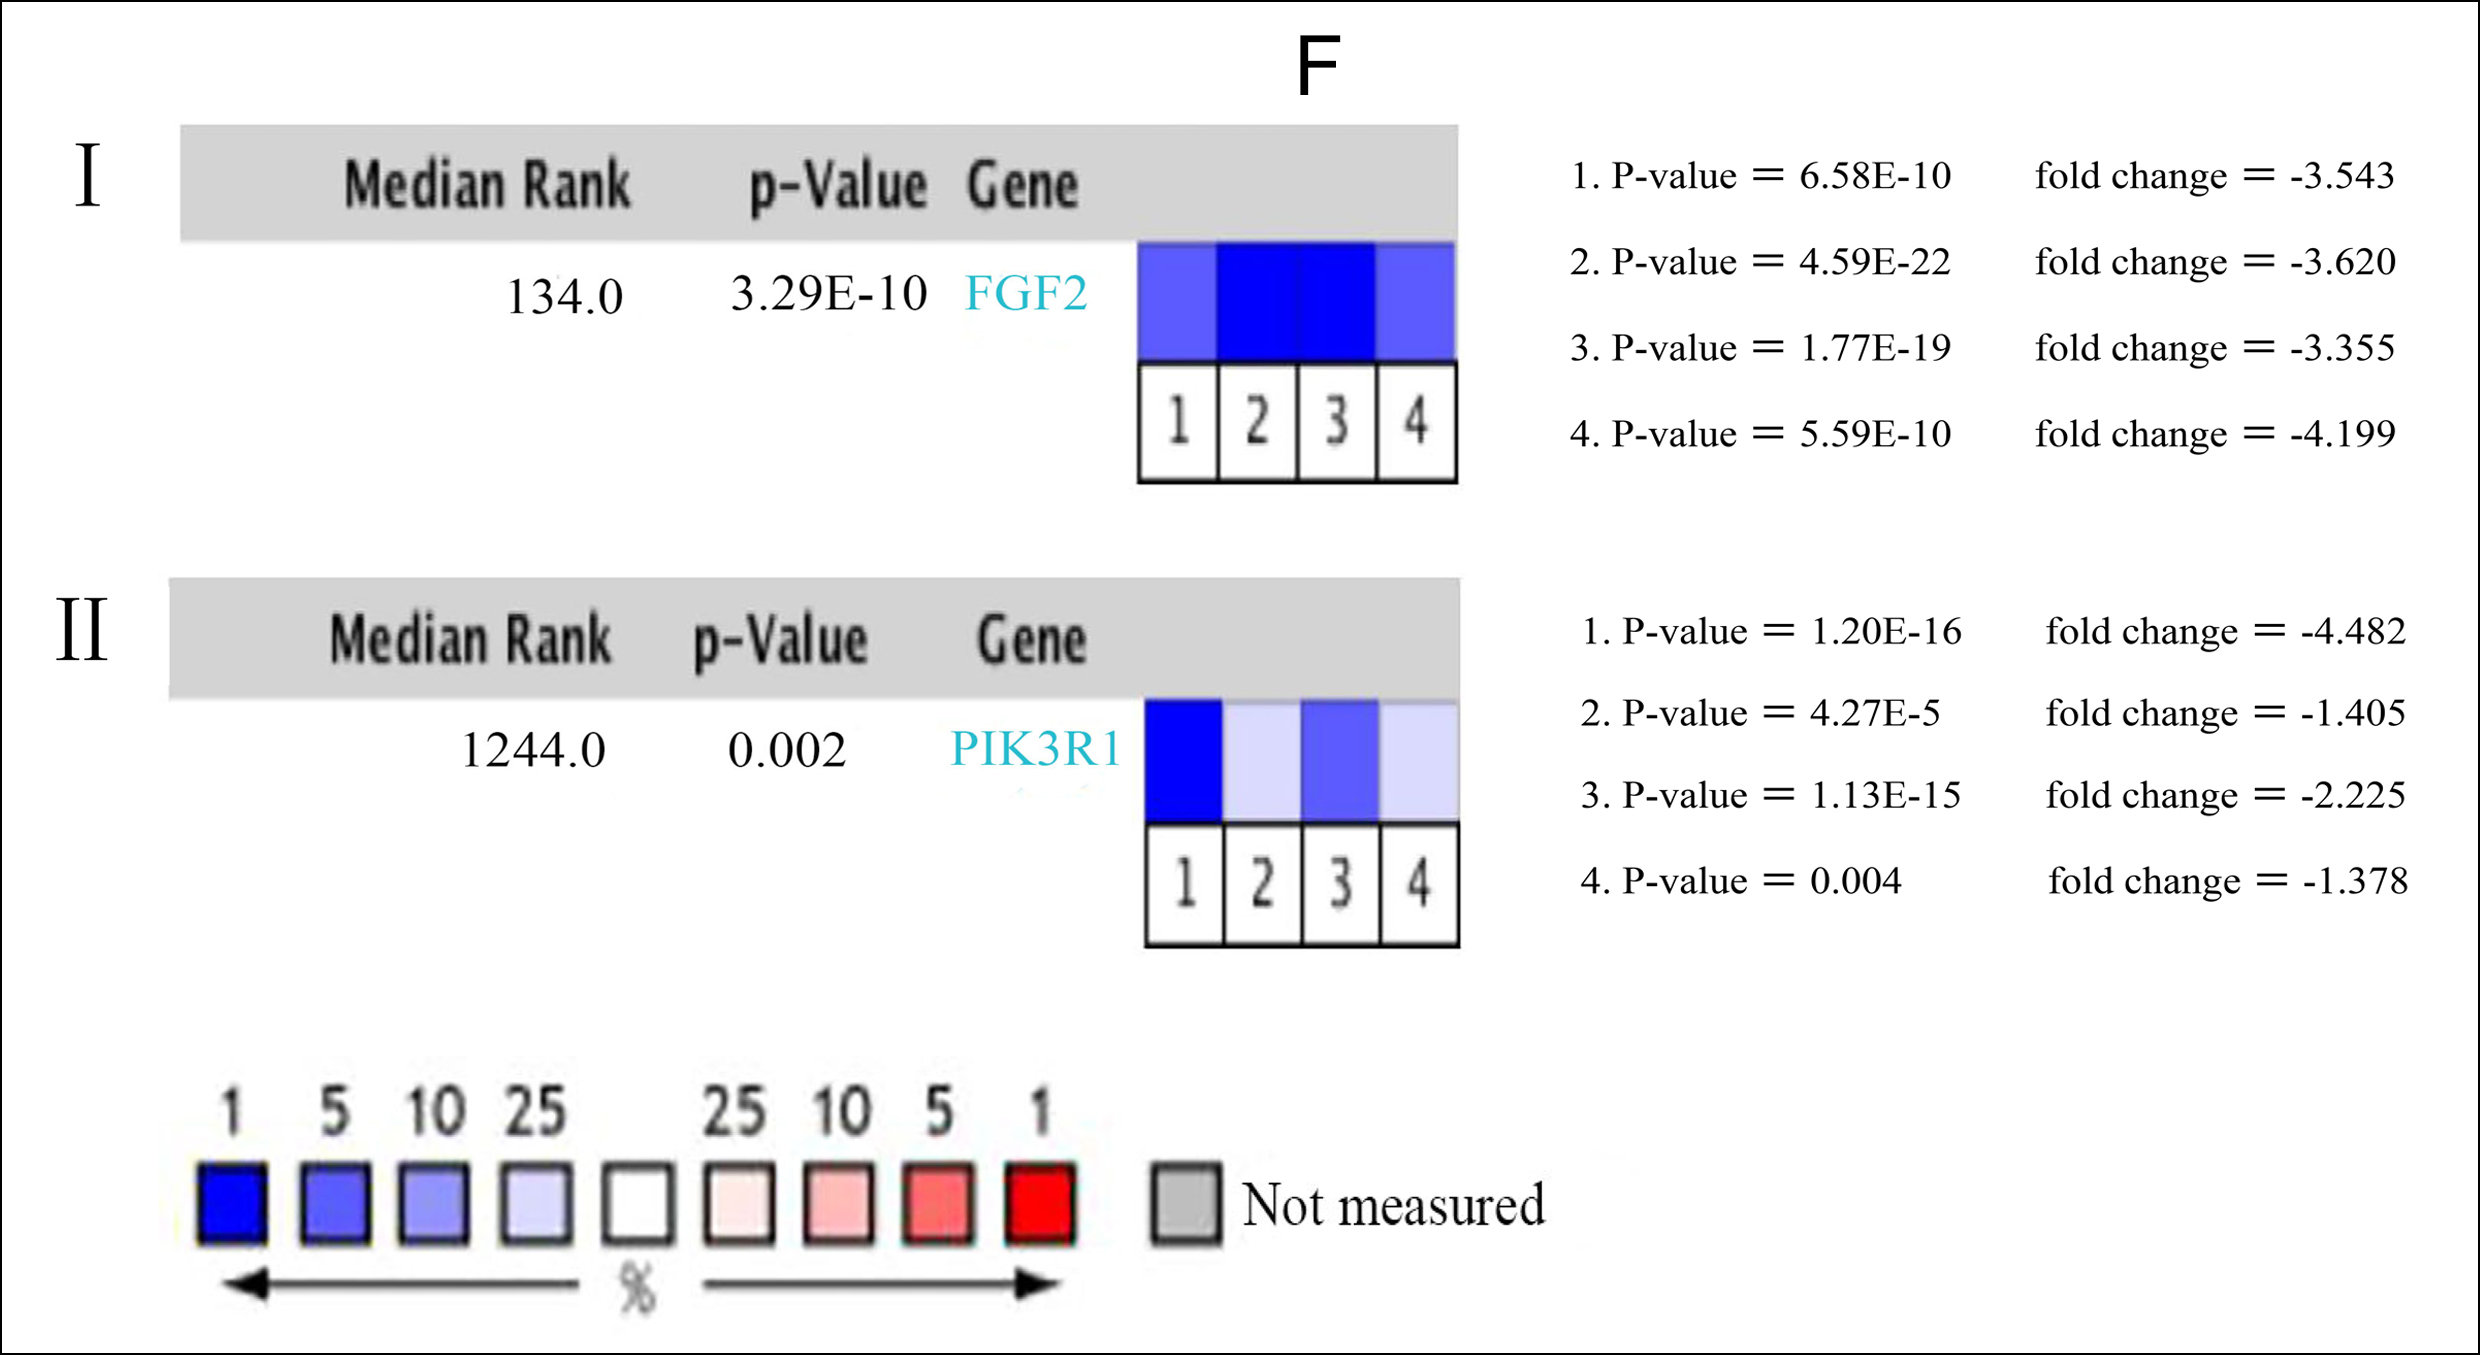 Figure 1: (A) Venn diagram: DEGs were elite with a |logFC| (fold change) ≥ one and adj. P-value <0.05 among the informational RNA expression identification sets GSE85841 and GSE118370. The two datasets showed associate overlap of 463 genes. (B) The most significant module of DEGs: The most significant module was obtained from PPI network with 9 nodes and 35 edges. (C) Using BiNGO constructed the cellular component analysis of hub genes. The nodes color depth refers to the P-value after the body is corrected. The nodes size refers to the numbers of genes that are involved in the ontologies. P < 0.01was considered statistically significant. (D) Mapping the PPI network of DEGs via Cytoscape. (E) Hierarchical clustering of 11 hub genes was built employing UCSC. Different colors represent different samples. The pink bar are non-cancerous samples and the blue bar are HCC samples. Up-regulation of genes is marked in red; down-regulation of genes is blue. (F) Compare the lung cancer tissues of FGF2 (Ⅰ) and PIK3R1 (Ⅱ) with normal tissues through Oncomine analysis. The heat map shows the comparison of FGF2 and PIK3R1 genes in clinical lung cancer samples and normal tissues. 1. Lung adenocarcinoma vs. Normal, Beer Lung, Nat Med, 2002. 2. Lung adenocarcinoma vs. Normal, Hou Lung, PLoS One, 2010. 3. 3. Lung adenocarcinoma vs. Normal, Okayama Lung, Cancer Res, 2012. 4. Lung adenocarcinoma vs. Normal, Su Lung, BMC Genomics, 2007.
Even though the presence of these abnormal expression genes can be used as biomarkers for the diagnosis of lung cancer, the 5-year survival rate of lung carcinoma is still very low, and its prognosis is dismal. The reason for this result is mainly due to the lack of early sensitivity and specific biomarkers, leading to the advanced stage of lung cancer at the time of diagnosis. Therefore, it is essential to understand the clearly theoretical molecular mechanism of lung cancer metastasis, carcinogenesis, progression, and recurrence, so as to detect lung cancer early and establish a higher efficient diagnosis and treatment tactics to reduce mortality. In recent studies, microarrays based on high-throughput platforms have been widely used to explore and identify promising biomarkers for disease diagnosis and prognosis at the genome level, especially in cancer.6 This article uses the GEO public database to screen the DEGs between lung cancer samples and normal samples. Analyse DEGs through DAVID database and Cytoscape and other software, excavate key genes and discuss.
The rationale of this study was to have a deeper understanding of the occurrence and development of lung cancer by screening potential biomarkers of lung cancer through bioinformatics analysis, and further experiments were conducted to verify the potential biomarkers and prove that they can be used as molecular therapeutic targets to design corresponding therapeutic agents and play an anti-tumor role, so as to help in early diagnosis and treatment of lung cancer. The objective of the study was to screen and identify key genes as potential biomarkers of lung cancer using bioinformatics analysis.
METHODOLOGY
Two gene expression datasets [GSE118370, and GSE85841] were mined on GEO (http://www.ncbi.nlm.nih.gov/geo). The selection criteria were human species and the research type being Expression profiling by an array. The GSE85841 data set was downloaded from the GPL20115 platform, Agilent-067406 Human blood count lncRNA + template RNA microarray V4.0 (Probe name version) platform, and this database consists of two sets of samples, including eight lung adenocarcinoma tissue samples and eight non-tumor samples. The GSE118370 data set was provided by the GPL570 [HG-U133_Plus_2]. Affymetrix Human ordination U133 Plus 2.0 Array platform, and this database contains 6 lung adenocarcinoma tissue samples and 6 non-tumor samples.
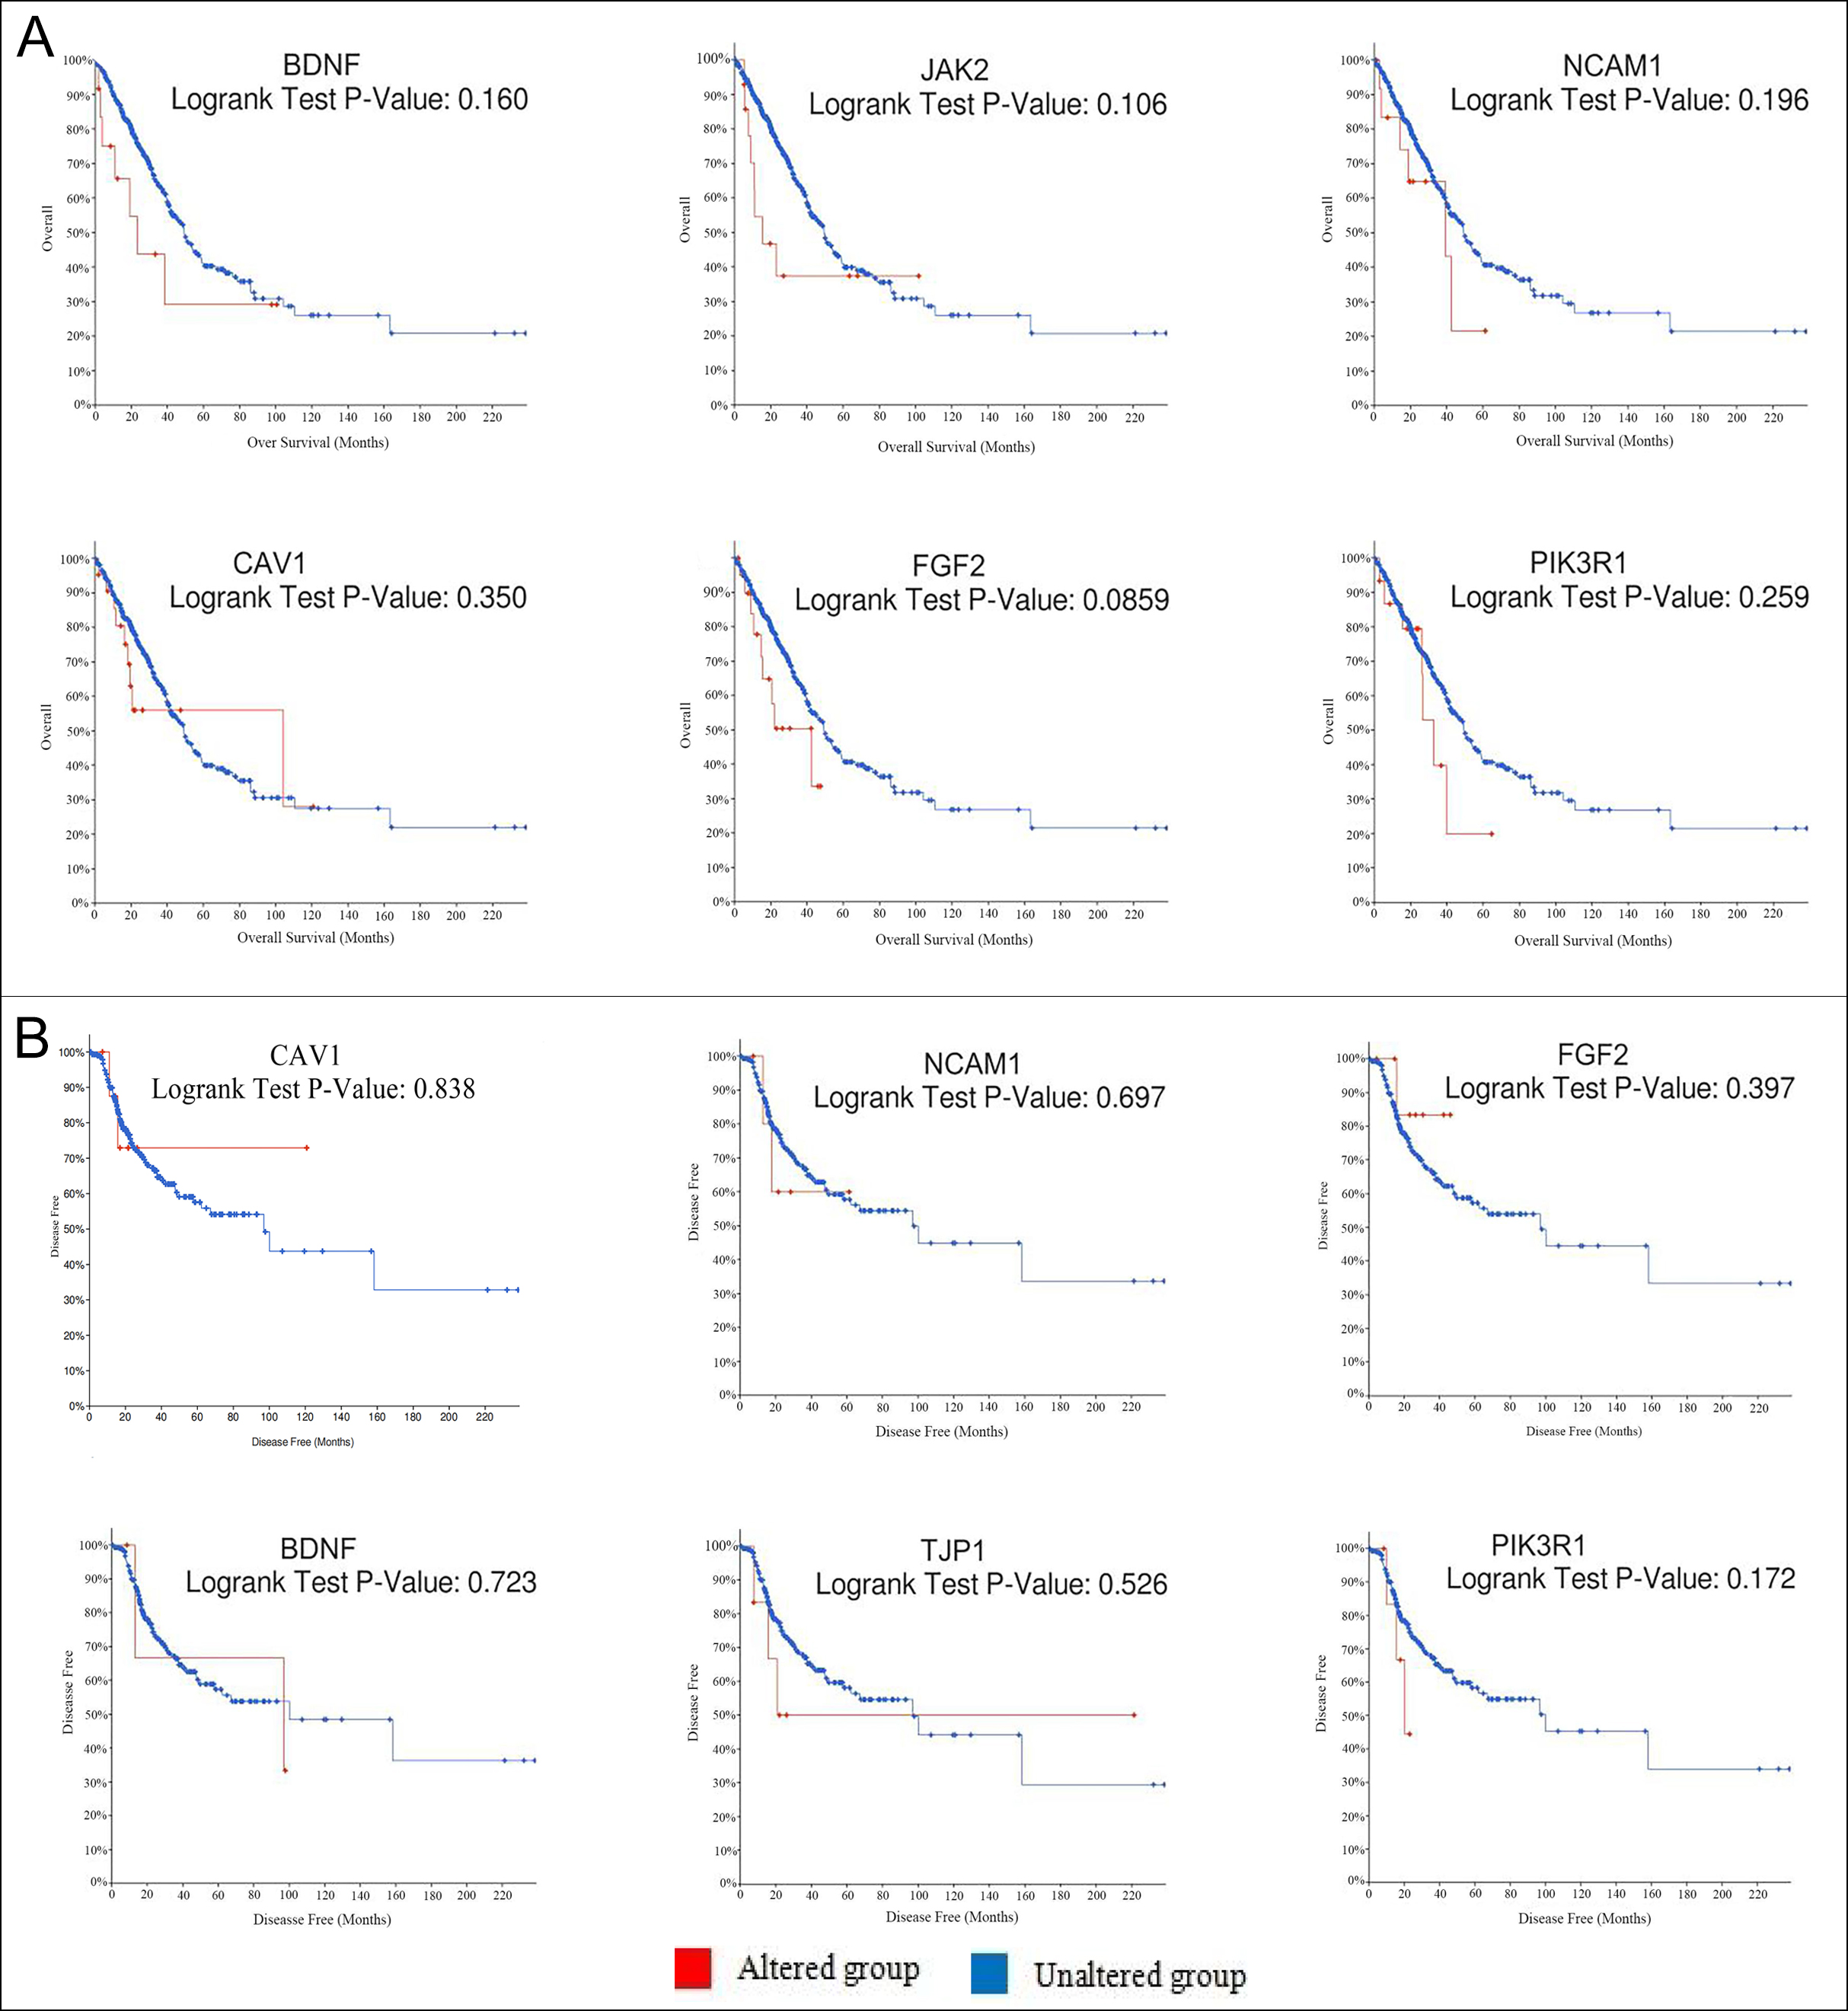 Figure 2: Using cBioPortal to plot the overall survival rate (A) and disease-free survival rate (B) curves of hub genes respectively. Logrank P<0.05 takes statistical significance into consideration.
The DEGs between lung cancer tissue and normal tissue samples were screened by exploring GEO2R (http://www.ncbi.nlm.nih.gov/geo/geo2r) which permits users to check 2 or additional sets of samples from the GEO series so as to identify genes that are expressed differently beneath completely different experimental conditions. The adjusted p-values were applied to control a balance between the discovery of statistically significant genes and limitations of false positives. Genes that satisfied the conditions of |logFC| (fold change) ≥1 and adj. p-value <0.05 were determined to be statistically significant DEGs.
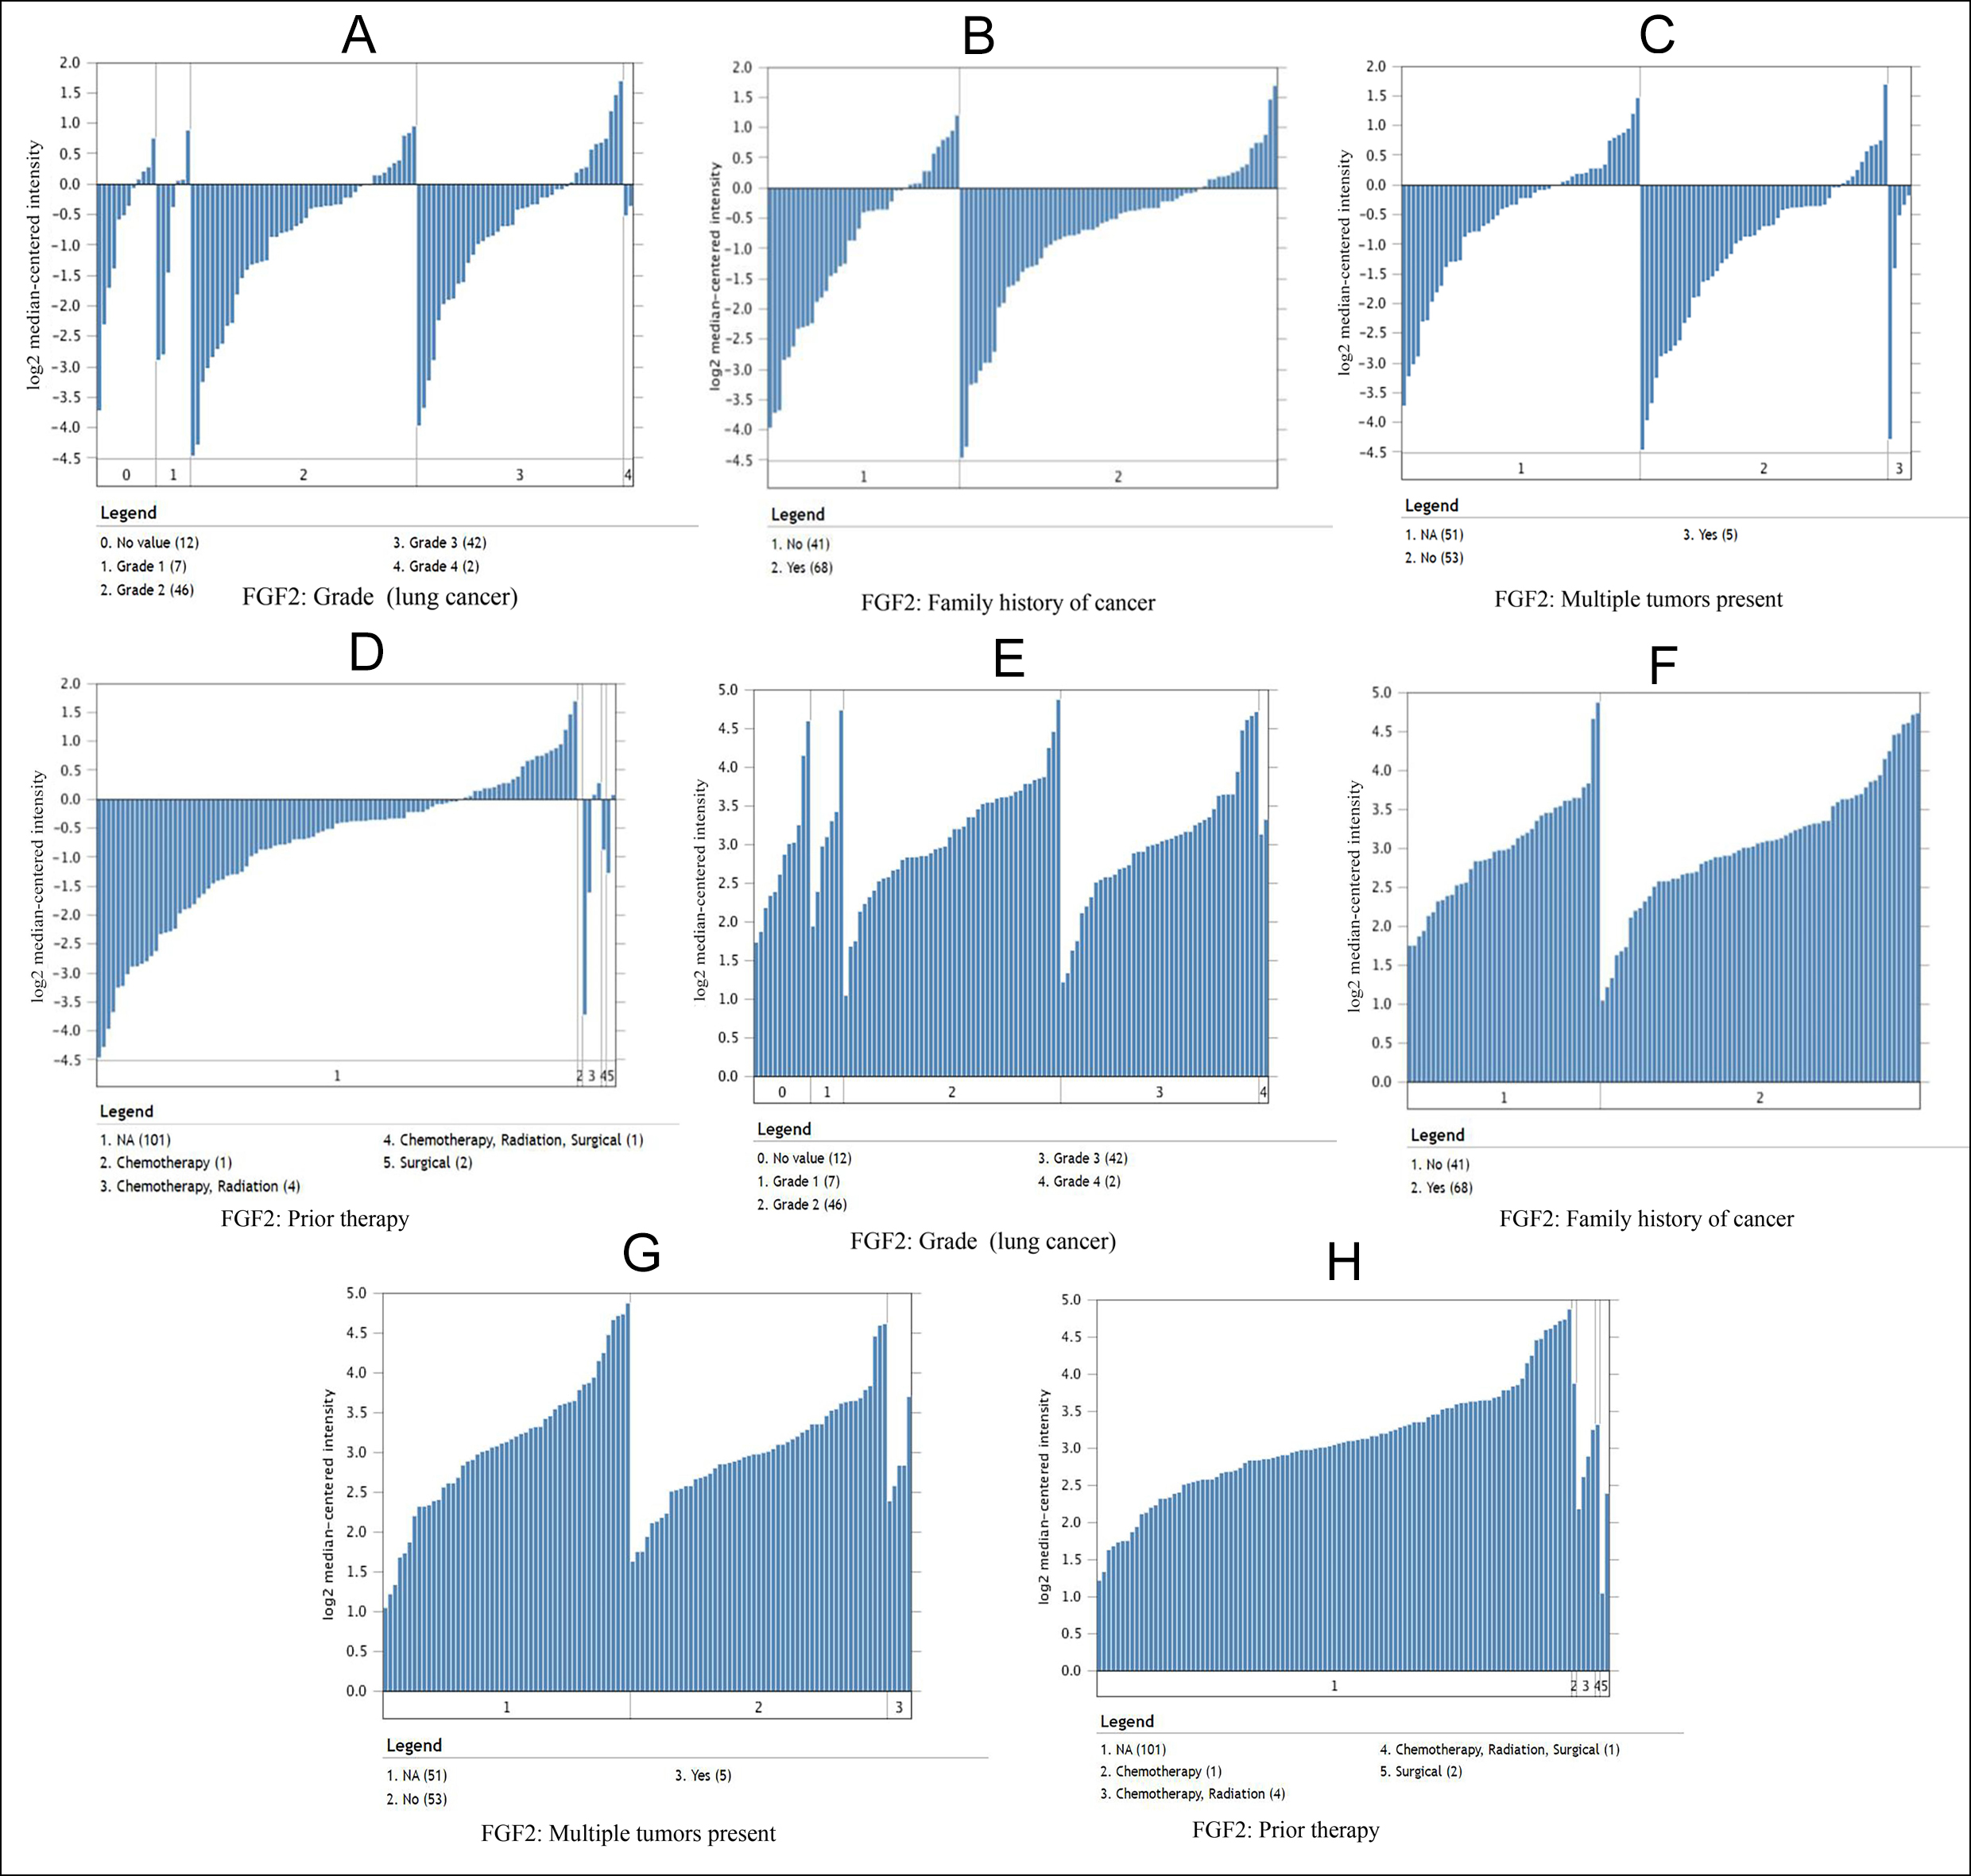 Figure 3: In the Bittner Lung dataset, the relationship between the expression of FGF2 and PIK3R1 and tumor grades, family history of cancer, multiple tumors present and prior therapy. (A-D) Comparison of FGF2 template RNA expression in lung cancer and normal liver tissues. (E-H) PIK3R1 template RNA expression in lung cancer samples.
The function and pathway of DEGs were analyzed via the GO and KEGG enrichment analysis, performed by using the DAVID (Database for Annotation, Visualisation, and Integrated Discovery, http://david.ncifcrf.gov) online tool. In the enrichment analysis results, p <0.05 was considered statistically significant.
Predicted Protein-Protein (PPI) networks were produced using STRING (Search Tool for the Retrieval of Interacting Genes, http://string-db.org) (version 11.5) and the interaction score >0.4 takes statistical significance into consideration. In order to visualise molecular interaction networks, the protein interaction data from STRING database were input into the Cytoscape software (version 3.8.2, www.cytoscape.org). Subsequently, the most significant module within the PPI networks was analysed using the Cytoscape’s plug-in Molecular Complex Detection (MCODE), and the criteria for selection were as below: degree cut-off=2, node score cut-off=0.2, k-score=2, and max depth=10. At the same time, genes in this model were also analysed for GO and KEGG enrichment.
Table I: Pathway and function enrichment analysis of DEGs via GO and KEGG in lung cancer.|
Term |
Description |
Count in gene set |
p-value |
|
BP GO:0043547 |
Positive regulation of GTPase activity |
35 |
1.31E-6 |
|
GO:0007155 |
Cell adhesion |
30 |
3.12E-6 |
|
GO:0007165 |
Signal transduction |
44 |
0.00420 |
|
GO:0045944 |
Positive regulation of transcription from RNA polymerase II promoter |
36 |
0.0158 |
|
CC GO:0005886 |
Plasma membrane |
140 |
1.06E-5 |
|
GO:0005737 |
Cytoplasm |
156 |
0.00197 |
|
GO:0005829 |
Cytosol |
102 |
0.00764 |
|
GO:0070062 |
Extracellular exo some |
87 |
0.01285 |
|
MF GO:0003779 |
Actin binding |
20 |
4.71E-5 |
|
GO:0005515 |
Protein binding |
249 |
1.58E-4 |
|
GO:0005509 |
Calcium ion binding |
31 |
0.00248 |
|
GO:0042803 |
Protein homodimerisation activity |
29 |
0.0109 |
|
Hsa04510 |
Focal adhesion |
17 |
6.81E-5 |
|
Hsa04022 |
cGMP-PKG signaling pathway |
14 |
1.89E-4 |
|
Hsa05205 |
Proteoglycans in cancer |
14 |
0.00177 |
|
Hsa04810 |
Regulation of actin cytoskeleton |
14 |
0.00273 |
|
Hsa04080 |
Neuro active ligand-receptor interaction |
14 |
0.0249 |
|
Hsa04151 |
PI3K-Akt signaling pathway |
16 |
0.0305 |
|
GO: Gene ontology; KEGG: Kyoto encyclopedia of genes and genomes; DEGs: Differentially expressed genes; lung cancer. BP:Biological processes; CC: Cell component; MF: Molecular function. |
|||
|
PathwayID |
Pathway description |
Count in gene set |
FDR |
|
GO:0007186 |
G-protein coupled receptor signaling pathway |
6 |
0.00341 |
|
GO:0007200 |
Phospholipase C-activating G-protein coupled receptor signaling pathway |
3 |
0.0336 |
|
GO:0005886 |
Plasma membrane |
9 |
1.84E-4 |
|
GO:0005887 |
Integral component of plasma membrane |
5 |
0.0265 |
|
GO:0031965 |
Nuclear membrane |
3 |
0.0377 |
|
Hsa04725 |
Cholinergic synapse |
4 |
0.0116 |
|
Hsa05200 |
Pathways in cancer |
5 |
0.0134 |
|
Hsa04020 |
Calcium signaling pathway |
4 |
0.0134 |
|
Hsa04062 |
Chemokine signaling pathway |
4 |
0.0134 |
|
Hsa04080 |
Neuroactive ligand-receptor interaction |
4 |
0.0341 |
|
GO: Gene ontology; KEGG: Kyoto encyclopedia of genes and genomes; DEGs: Differentially expressed genes; FDR: False discovery rate. |
|||
CytoHubba and BiNGO plugins in Cytoscape were used to screen the genes with degrees ≥ 20 and for the cellular component analysis of hub genes, respectively. UCSC Cancer Genomics Browser (http:// genome-cancer.ucsc.edu) was used to construct the hierarchical clustering of hub genes. The overall survival analyses were performed using Kaplan-Meier curve in the cBio Portal. Oncomine, an online database (http://www.oncomine.com), used the Bittner Lung Dataset to analyse the association of expression level of hub genes with tumor grades, family history of cancer, multiple tumors present, and prior therapy.
RESULTS
The 463 DEGs were identified in total between 3,705 in GSE85841 and 1,172 in GSE118370, consisting of 427 up-regulated genes and 36 down-regulated genes, as demonstrated in the Venn diagram (Figure 1A). The outcomes of GO and KEGG enrichment analyses demonstrated that the functions and pathways enriched by GO and KEGG are mainly associated with cancer (Table I).
The PPI network of DEGs (Figure 1D) included 401 nodes and 1077 edges. Then, the outcomes of GO and KEGG enrichment analysis about genes involved in the most significant module (Figure 1B) obviously demonstrated that genes were evidently enriched in pathways related to cancer (Table II).
Eleven genes were screened as hub genes with node degrees ≥ 20, including FGF2, PIK3R1, BDNF, ACTN2, TJP1, CAV1, NCAM1, TTN, GRIA1, NTRK2, and JAK2. The full names, other names, and functions of these hub genes are exhibited in Table III. The Figure 1C showed the cellular component analysis about the hub genes. The hub genes mainly distinguish the liver cancer samples from the noncancerous samples via Hierarchical clustering (Figure 1E). Lung cancer patients with BDNF, CAV1, FGF2, JAK2, NCAM1, and PIK3R1 changes showed poor overall survival (Figure 2A). In addition, lung cancer sick patients with NCAM1, PIK3R1, and TJP1 changes displayed poor disease-free survival (Figure 2B).
In order of node degree from these genes, the first two genes were FGF2 and PIK3R1, with node degrees 40 and 32 respectively. According to the figures above, the overall survival rate of lung cancer patients associated with the FGF2 genome alteration decreased, but the disease-free survival rate did not decrease. Yet these graphical results based on p-values were not considered statistically significant, p=0.0859 for overall survival and 0.397 for disease-free survival respectively.
Table III: Full names, other names and functions of 11 hub genes with degrees ≥ 20.|
No. |
Gene symbol |
Full name |
Also known as |
Function |
|
1 |
FGF2 |
Fibroblast growth factor 2 |
BFGF;FGFB; FGF-2; HBGF-2 |
FGF2 Plays an important role in the regulation of cell survival, cell division, cell differentiation and cell migration. |
|
2 |
PIK3R1 |
Phosphoinositide-3-kinase regulatory subunit 1 |
p85; AGM7; GRB1; IMD36;p85-ALPHA |
PIK3R1 plays an important role in the metabolic actions of insulin, and a mutation in this gene has beenassociated with insulin resistance. |
|
3 |
BDNF |
Brainderivedneurotrophic factor |
ANON2; BULN2 |
BDNF is an important signaling molecule that activates signaling cascades downstream of NTRK2. |
|
4 |
ACTN2 |
Actinin alpha 2 |
MPD6;CMH23; CMD1AA;MYOCOZ |
ACTN2 is thought to anchor actin to a variety of intracellular structures. This is a bundling protein. |
|
5 |
TJP1 |
Tight junction protein 1 |
ZO-1 |
TJP1, TJP2, and TJP3 are closely related scaffolding proteins that linktight junction (TJ) transmembrane proteins such as claudins, junctional adhesion molecules, and occludin to the actin cytoskeleton. |
|
6 |
CAV1 |
Caveolin 1
|
CGL3;PPH3; SCL3; LCCNS;VIP21; MSTP085 |
CAV1 May act as a scaffolding protein within caveolar membranes. |
|
7 |
NCAM1 |
Neural cell adhesion molecule 1 |
CD56;NCAM;MSK39 |
NCAM1 is a cell adhesion molecule involved in neuron-neuron adhesion, neurite fasciculation, outgrowth of neurites, etc. |
|
8 |
TTN |
Titin |
TMD; CMH9; CMD1G;CMPD4; EOMFC; HMERF; MYLK5; SALMY; LGMD2J;LGMDR10 |
Byproviding connections at the level of individual microfilaments, TTN contributes to the fine balance of forces between the two halves of the sarcomere. |
|
9 |
GRIA1 |
Glutamate ionotropic receptor AMPA type subunit 1 |
GLUH1;GLUR1; GLURA;GluA1; HBGR1 |
GRIA1 acts as an excitatory neurotransmitter at many synapses in the central nervous system. |
|
10 |
NTRK2 |
Neurotrophic receptor tyrosine kinase 2 |
OBHD;TRKB;DEE58; trk-B;EIEE58; GP145-TrkB |
Receptor tyrosine kinase involved in the development and the maturation of the central and the peripheral nervous systems through regulation of neuron survival, proliferation, migration, differentiation, and synapse formation and plasticity |
|
11 |
JAK2 |
Janus kinase 2 |
JTK10 |
Following ligand-binding to cell surface receptors, phosphorylates specific tyrosine residues on the cytoplasmic tails of the receptor, creating docking sites for STATs proteins. |
Moreover, it can be seen from the image that the PIK3R1 genome change leads to poor disease-free and overall survival. Similarly, their p-values were not statistically significant p=0.259 for overall survival and 0.172 for disease-free survival (Figure 2A, B). The reason for this result may be caused by the small number of samples and the heterogeneity of the tumor, which needs further discussion. Through the Oncomine analysis results of noncancerous tissues and lung cancer tissues, we can clearly see that the expression of FGF2 and PIK3R1 was significantly lower in different lung cancer data sets (Figure 1F). In the Bittner Lung dataset, lower template RNA levels of FGF2 and PIK3R1 were related to tumor grades, family history of cancer, multiple tumors present, and prior therapy (Figure 3A-H).
DISCUSSION
With the continuous improvement in treatment methodologies, treatment outcome of lung cancer has improved significantly, but the death rate of lung cancer in China and the world is still the highest.7 Early and accurate detection of lung cancer can effectively treat and reduce cancer-related deaths, thus, the confirmation and identification of biomarkers that may be applied to the early diagnosis, prognosis, and treatment of many diseases is crucial. In order to measure gene expression in lung cancer, Microarray technology is widely applied at present, which is a high-throughput tool and assists us to explore biomarkers that are widely applicable to almost all diseases. The KEGG pathway enrichment results indicate that the DEGs are primarily associated with the PI3K-Akt signaling pathway, cGMP-PKG signaling pathway, and the regulation of actin cytoskeleton. According to previous studies, components of the PI3K/Akt signaling pathway are frequently changed among patients with cancer, and this pathway is also considered to be at the top of many signal transduction pathways that are easily activated in the development and progression of cancer.8,9 Recent studies have found that cGMP-PKG signaling pathway can cause high proliferation and metastasis of tumor cells.10 Numerous researches have shown that the actin cytoskeleton is related to a variety of physiological and pathological functions, such as cell migration, differentiation, and tumor metastasis.11 Cancer patients often show morphological and molecular alterations in the actin cytoskeleton. The GO enrichment outcomes revealed that DEGs were enriched in positive regulation of GTPase activity, calcium ion binding, and extracellular exosome. Mutations in GTPases can cause a number of human diseases, such as Ras-related GTPases in human cancer. Recent research has shown that abnormal Ca2+-signaling and loss of [Ca2+]i homeostasis conduce to the tumor progression in several different cancers, and certain anti-cancer drugs reportedly inhibit pro-survival signals and activate pro-apoptotic signals by regulating Ca2+ signal-dependent mechanisms.12 Tumors usually cause exosomes to rise, and the aggregation of tumor antigens in exosomes is involved in cancer cells. Therefore, these analyses are of great meaning for studying the molecular mechanism of lung cancer.
According to the hierarchical clustering for hub genes, the outcomes demonstrated that these hub genes distinguished lung cancer samples from normal samples, and may be potential diagnostic biomarkers. FGF2 and PIK3R1 have the highest node degrees with 40 and 32, they could be closely related to the occurrence of lung cancer. According to previous reports, patients with malignant tumors have been documented with high expression of FGF2 and FGF2 acts on tumor cells through paracrine and autocrine. From recent studies, it has been found that FGF2 aptamers can prevent the growth of lung cancer cells, so aptamers can be used as preclinical evidence for cancer treatment.13 These results are very similar to the results of this study, which is the reason to believe that FGF2 has a huge impact on the pathogenesis of lung cancer. Though FGF2 signaling is well understood, its cellular function and molecular mechanisms are not fully understood. It was found that up-regulation of FGF2 is closely related to poor prognosis. Therefore, more in-depth studies on FGF2 need to be strengthened to prove that it is highly correlated to lung cancer.
Differential expression of PIK3R1 has been reported to affect tumor progression and metastasis. PI3K is composed of a catalytic and a regulatory subunit encoded by the PIK3CA/B/D/G and PIK3R1/2 genes, respectively, being PIK3CA and PIK3R1 the most predominantly mutated in cancer. 14 Studies have suggested that in line with the proposed tumor-suppressive roles of p85α, PIK3R1 copy number loss is often detected in multiple tumor types including cancers of prostate, ovary, lung, and breast.15 According to the Cancer Genome Atlas (TCGA) database, heterozygous deletion and homozygous deletion of PIK3R1 occur most frequently in ovarian cancer. However, the relationship between PIK3R1 and lung cancer needs further investigation. As shown by the survival curve analysis, alterations in FGF2 in patients with lung cancer only cause a decrease in overall survival, while changes in PIK3R1 lead to a decrease in both overall survival and disease-free survival. However, the p-values of these data are not statistically significant. This result may be due to the limited number of samples and the heterogeneity of tumors with light, so a large number of sample data is needed to verify this result.
As can be seen from onconmine analysis, the low expression of FGF2 and PIK3R1 was associated with tumor grades, family history of cancer, multiple tumors, and previous treatment, which proved that FGF2 and PIK3R1 played a key role in the carcinogenesis or process of lung cancer. Many reports have stated that BDNF gene expression promotes or accelerates the proliferation, migration, and invasion of non-small cell lung cancer cells, and miR-147 can inhibit tumor development by inhibiting BDNF expression.16 TJP1 is considered a tumor suppressor, based on previous article research, the expression and localisation of TJP1 are related to the pathogenesis of pancreatic cancer, colorectal cancer, melanoma, and non-small cell lung cancer (NSCLC).
CAV1 is closely related to breast cancer, lung cancer, cervical cancer, gastric cancer, glioma, liver cancer and prostate cancer, and affects the progression of these cancers.17 However, recent research has found that CAV1 plays a different role in different cancers, and it is believed to promote tumor development in lung cancer. Furthermore, CAV1 is closely associated with drug resistance in lung cancer.
According to the latest research in 2021, Mir-324-3p has a profound impact on the occurrence and development of lung cancer through ALX4/NCAM1/MAPK axis.18 Interaction between Mir-324-3p and ALX4 up-regulated the expression of NCAM1 and activated the MAPK pathway. TTN-AS1 or ZNF503 is associated with the inhibition of proliferation, migration, invasion, and EMT of small cell lung cancer cells.19 Therefore, TTN-AS1 may be hypothesised as a potential drug therapeutic target for lung cancer. According to previous reports, NTRK2 expression has been shown to promote the development of multiple cancers, for example, glioblastoma, neuroblastoma, lung carcinoma, and breast cancer.20 The mechanism of JAK2 in lung cancer is that JAK2 downstream signal is inhibited by TG10129 to increase the radiosensitivity of lung cancer.21 According to the survival analysis curve above, alterations in BDNF and NCAM1 of lung cancer displayed a descent in overall and disease-free survival. The reason for this result may be caused by the small number of samples and the heterogeneity of the tumor, which needs further discussion. The alteration in TJP1 showed worse disease-free survival, but the changes in JAK2 showed worse overall survival. These results are basically consistent with the above analysis, so it can be considered that these genes are associated with the incidence of lung cancer to a certain extent. Literature showed that a well-connected network among lung cancer and hub genes ACTN2 and GRIA1 has not been widely reported. ACTN2 gene mainly appeared in the myocardium, skeletal muscle, and brain. The role of ACTN2 in cancer cells has rarely been reported.22 From the observation of the survival analysis curve, there was no significant curvilinear relationship between ACTN2 changes in lung cancer and disease-free survival. And it was found that GRIA1 and GRIA2 were expressed in oligodendrocytes and malignant cells.23 According to reports, GRIA1 and GRIN2A gene mutations are widely considered to be related to schizophrenia and have genome-wide significance. However, some results are far from the standard, and further studies in molecular biology or cell experiments are necessary.
CONCLUSION
FGF2 and PIK3R1 with the highest node degrees were considered as the most likely potential biomarkers in hub genes associated with lung cancer. FGF2 and PIK3R1 as potential biomarkers of lung cancer may provide insights into the molecular determinants of lung cancer progression and provide novel biomarkers for early and accurate diagnosis and therapy of lung cancer patients with a favorable prognosis.
ETHICAL APPROVAL:
This study was approved by the Ethics committee of First Affiliated Hospital of Dalian Medical University (Ethical Approval No. YJ-KY-FB-2022-02).
PATIENTS’ CONSENT:
Informed consent was obtained from all individual participants included in the study.
COMPETING INTEREST:
The authors declared no competing interest.
AUTHORS’ CONTRIBUTION:
YC: Collected and analysed data, wrote the manuscript.
XKW: Collected data.
YW: Analysed data.
JWZ: Searched literature.
SYW, XYW: Designed study, agreed to be accountable for all aspects of the work.All authors approved the final version of the manuscript to be published.
REFERENCES
- Blandin Knight S, Crosbie PA, Balata H, Chudziak J, Hussell T, Dive C. Progress and prospects of early detection in lung cancer. Open Biol 2017; 7(9):170070. doi: 10.1098/rsob. 170070.
- Xiao J, Moshahid Khan M, Vemula S, Tian J, LeDoux MS. Consequences of Cre-mediated deletion of Ciz1 Exon 5 in Mice. FEBS Lett 2018; 592(18): 3101-10.
- Robles AI, Harris CC. Integration of multiple “Omic” biomarkers: A precision medicine strategy for lung cancer. Lung Cancer 2017; 107:50-8. doi: 10.1016/j.lungcan.2016. 06.003.
- Chia-Sing L, Ai-Li S, Bing-Hua S, Tsui-Shan H, Chung-Teng W, Yu-Chu S, et al. Oct4 promotes M2 macrophage polarisation through up regulation of macrophage colony-stimulating factor in lung cancer. J Hematol Oncol 2020; 13(1):62. doi: 10.1186/s13045-020-00887-1.
- Wang L, He J, Hu H, Tu L, Sun Z, Liu Y, et al. Lung CSC-derived exosomal miR-210-3p contributes to a pro-metastatic phenotype in lung cancer by targeting FGFRL1. J Cell Mol Med 2020; 24(11):6324-39. doi: 10.1111/jcmm. 15274.
- Hu C, Meiners S, Lukas C, Stathopoulos GT, Chen J. Role of exosomal microRNAs in lung cancer biology and clinical applications. Cell Prolif 2020; 53(6):e12828. doi: 10.1111/cpr.12828.
- Li Y, Tian X, Gao L, Jiang X, Fu R, Zhang T, et al. Clinical significance of circulating tumor cells and tumor markers in the diagnosis of lung cancer. Cancer Med 2019; 8(8): 3782-92. doi: 10.1002/cam4.2286.
- Long ZW, Wu JH, Hong C, Wang YN, Zhou Y. MiR-374b promotes proliferation and inhibits apoptosis of human GIST cells by inhibiting PTEN through activation of the PI3K/Akt pathway. Mol Cells 2018; 41(6):532-544. doi: 10.14348/ molcells.2018.2211.
- Slattery ML, Mullany LE, Sakoda LC, Wolff RK, Stevens JR, Samowitz WS, et al. The PI3K/AKT signaling pathway: Associations of miRNAs with dysregulated gene expression in colorectal cancer. Mol Carcinog 2018; 57(2):243-61. doi: 10.1002/mc.22752.
- Lv Y, Wang X, Li X, Xu G, Bai Y, Wu J, et al. Nucleotide de novosynthesis increases breast cancer stemness and metastasis via cGMP-PKG-MAPK signaling pathway. PLoS Biol 2020; 18(11):e3000872. doi: 10.1371/journal.pbio. 3000872.
- Yu M, Yuan X, Lu C, Le S, Kawamura R, Efremov AK, et al. mDia1 senses both force and torque during F-actin filament polymerisation. Nat Commun 2017; 8(1):1650. doi: 10.1038/s41467-017-01745-4.
- Varghesev E, Samuel SM, Sadiq Z, Kubatka P, Liskova A, Benacka J, et al. Anti-cancer agents in proliferation and cell death: The calcium connection. Int J Mol Sci 2019; 20(12):3017. doi: 10.3390/ijms20123017.
- Hamamoto J, Yasuda H, Nonaka Y, Fujiwara M, Nakamura Y, Soejima K, et al. The FGF2 aptamer inhibits the growth of FGF2-FGFR pathway driven lung cancer cells. Biophys Res Commun 2018; 503(3):1330-4.
- Gris-Oliver A, Palafox M, Monserrat L, Brasó-Maristany F, Òdena A, Sánchez-Guixé M. Genetic alterations inthe PI3K/AKT pathway and baseline AKT activity define AKT inhibitor sensitivity in breast cancer patient-derived xenografts. Clin Cancer Res 2020; 26(14):3720-3731. doi: 10.1158/1078-0432.CCR-19-3324.
- Li X, Mak VCY, Zhou Y, Wang C, Wong ESY, Sharma R, et al. Deregulated Gab2 phosphorylation mediates aberrant AKT and STAT3 signaling upon PIK3R1 loss in ovarian cancer. Nat Commun 2019; 10:716.
- Li F, Wang X, Yang L. MicroRNA-147 targets BDNF to inhibit cell proliferation, migration and invasion in non-small cell lung cancer. Oncol Lett 2020; 20(2):1931-7. doi: 10.3892/ol.2020.11715.
- Wang N, Yang B, Zhang X, Wang S, Zheng Y, Li X, et al. network pharmacology-based validation of caveolin-1 as a key mediator of Ai Du Qing Inhibition of drug resistance in breast cancer. Front Pharmaco 2018; l9:1106.
- Song T, Zhou H, Wei X, Meng Y, Guo Q. Down regulation of microRNA-324-3p inhibits lung cancer by blocking the NCAM1-MAPK axis through ALX4. Cancer Gene Ther 2021; 28(5):455-70. doi: 10.1038/s41417-020-00231-2.
- Qi G, Li L. LncRNA TTN-AS1 promotes progression of non-small cell lung cancer via regulating miR-491-5p/ZNF503 Axis. Onco Targets Ther 2020; 13:6361-71. doi: 10. 2147/OTT.S238890.
- Wang X, Prager BC, Wu Q, Kim LJY, Gimple RC, Shi Y, et al. Reciprocal signaling between glioblastoma stem cells and differentiated tumor cells promotes malignant progression. Cell Stem Cell 2018; 22(4):514-28.e5. doi: 10. 1016/j. stem.2018.03.011.
- Hua Y, Wang W, Zheng X, Yang L, Wu H, Hu Z, et al. NVP-BSK805, an inhibitor of JAK2 Kinase, significantly enhances the radio sensitivity of esophageal squamous cell carcinoma in vitro and in vivo. Drug Des Devel Ther 2020; 14:745-55. doi: 10.2147/DDDT.S203048.
- Xie GF, Zhao LD, Chen Q, Tang DX, Chen QY, Lu HF, et al. high actn1is associated with poor prognosis, and actn1 silencing suppresses cell proliferation and metastasis in oral squamous cell carcinoma. Drug Des Devel Ther 2020; 14:1717-27. doi: 10.2147/DDDT.S244516.
- Huang S, Song Z, Zhang T, He X, Huang K, Zhang Q, et al. Identification of immune cell infiltration and immune-related genes in the tumor microenvironment of glioblastomas. Front Immunol 2020; 11:585034.