ECG Intervals on Acute Carbon Monoxide Poisoning
By Gokhan YilmazAffiliations
doi: 10.29271/jcpsp.2021.06.668ABSTRACT
Objective: To evaluate the usability of electrocardiography (ECG) intervals in the diagnosis and treatment monitoring of acute carbon monoxide (CO) poisoning.
Study Design: An observational study.
Place and Duration of Study: Department of Emergency Medicine, Kayseri City Hospital, Turkey, from November 2018 to May 2019.
Methodology: Each of 80 patients for study and control groups were prospectively included. For study group, pre- and post-treatment ECG intervals (P-wave and QRS complex periods, PP, PR, RR, QT, and QTc intervals) and carboxyhemoglobin (COHb) levels of the patients were evaluated. For control group, ECG intervals and COHb levels of the patients during admission to the Emergency Department were evaluated.
Results: As a result of the statistical analysis in which measurements of the study group and control group were compared, a statistically significant difference was found in the following values: pre-treatment group COHb level (p<0.001), PR interval (p=0.046), PP interval (p<0.001), QT interval (p<0.001), QTC interval (p=0.016), RR interval (p<0.001), and post-treatment group COHb level (p<0.001), PR interval (p=0.009), PP interval (p=0.041), QTC interval (p=0.010), and RR interval (p=0.036). QT interval values in the post-treatment group were similar to those of the control group (p=0.342). In the ROC analysis where the diagnostic performance of ECG intervals was evaluated, the area under the curve (AUC) scale was between 0.29 and 0.62.
Conclusion: ECG intervals do not provide as much benefit as COHb measurement in the diagnosis of acute CO poisoning. However, the QT interval is a useful ECG interval in the treatment monitoring of acute CO poisoning.
Key Words: Acute carbonmonoxide poisoning, ECG interval, QT interval, Emergency Department.
INTRODUCTION
Acute carbonmonoxide (CO) poisoning is a type of poisoning that can be fatal in humans due to the neurotoxic and cardiotoxic effects of CO gas.1 In recent years, studies have been conducted to enlighten the cardiac damage mechanism that plays a major role in mortality in acute CO poisoning and to evaluate the cardiac effects of this intoxication.2-4 These studies demonstrated that the risk of arrhythmia increases and electrocardiographic changes are observed in the heart as a result of many biochemical processes resulting in tissue hypoxia in acute CO poisoning.2,3 It was observed that the prolonged p-wave dispersion and prolonged QTc interval were associated with arrhythmia in acute CO poisoning.3,4
Electrocardiography (ECG) is a useful diagnostic and monitoring tool utilised by clinicians in diagnosing cardiac diseases and determining the cardiac status.5
The investigation of electrocardiographic changes in types of poisoning with cardiac effects is a new field. It has generated interest in recent years, whether or not ECG parameters could be used in both diagnosis 6 and monitoring7,8 in these types of poisoning.
The aim of this study was to investigate whether ECG intervals can be used in the diagnosis and treatment monitoring of acute CO poisoning.
METHODOLOGY
This observational study was prospectively conducted in the Emergency Department of Kayseri City Hospital, Turkey, from November 2018 to May 2019, after the approval of the local Ethics Committee. The study was not randomised, and was conducted as a blinded study. The patients, who presented with a history of CO contact between the above-mentioned dates and showed clinical symptoms of acute CO poisoning had a carboxyhemoglobin (COHb) level > 10% at the time of admission and were discharged from the Emergency Department after treatment, were determined as the study group. As the control group, patients who were admitted to the Emergency Department on the same dates having no history of CO contact, but having clinical symptoms similar to the study group, with a COHb level below 10% at the time of admission and those who were discharged from the emergency service, were selected.
Inclusion criteria were patients with a history of CO exposure and clinical signs of CO poisoning; COHb level >10%; patients over the age of 18; patients with mild and moderate CO poisoning.
Exclusion Criteria were patient under the age of 18 years; pregnancy; patients with high troponin levels; patients with a history of cardiac disease (previous coronary angiography, coronary artery disease, Brugada syndrome, prolonged QT syndrome, and WPW syndrome in the background, etc.; patients with a history of taking drugs for the treatment of arrhythmia (use of beta-blockers, calcium channel blockers, digital, etc); patients with a history of disease-causing electrolyte disorder (chronic renal failure, adrenal pathologies); patients with acute CO poisoning whose COHb level could not be reduced below 10% after treatment; patients required hyperbaric oxygen therapy (HBOT); patients with severe CO poisoning.
The individuals in the study group were monitored when they were first admitted to the Emergency Department. Within the first 10 minutes of admission to the Emergency Department, electrocardiography scans of patients were performed with the 12-lead electrocardiography (ECG) device (GE© Mac 2000 ECG Machine, Milwaukee, WI, USA). Intravenous vascular access was concurrently provided and blood was drawn from the patients with the blood gas device (Radiometer© ABL90 FLEX analyzer, Istanbul, Turkey) to measure COHb levels. Normobaric oxygen therapy (NBOT) with 15 L/min 100% oxygen was administered to the patients in the study group for 4-6 hours with a diffuser mask. After the treatment, ECG was performed for the patients and blood tests were repeated to measure COHb in the blood gas. The data obtained during the first 10 minutes at the time of admission to the Emergency Department were registered as the "Pre-treatment group" and the data obtained after NBOT were registered as the "Post-treatment group." A single measurement was performed in the control group. ECG was performed during the first 10 minutes of admission to the Emergency Department for the people in the control group and blood was drawn for measuring COHb in the blood gas.
Demographic characteristics, ECG intervals, and COHb values of the study and control groups were recorded. ECG parameters were evaluated; the P wave duration, PR interval, QRS duration, PP interval, RR interval, QT interval,and corrected QT (QTc) interval calculated with the Bazett formula. These parameters were calculated by a cardiologist blinded to the study. Pre- and post-treatment ECG intervals (P-wave duration, PR interval, QRS duration, QT and QTc intervals, PP and RR intervals) and pre-and post-treatment COHb values were recorded in the study group. ECG intervals at the time of admission to the Emergency Department and COHb levels were recorded in the data form in the control group.
The data obtained within the scope of the study were initially checked for extreme values and incorrect data entries were controlled. The acceptance value for the type I error in analysis was 5%; in other words, p was considered to be ≤ 0.05, and in terms of sensitivity to smaller error probabilities, p values were specified by considering significance levels of p ≤0.01 in reporting. Categorical data were expressed as number and percentage, while quantitative data as mean ± S.D. In the analysis performed, the paired sample t-test was used for the comparison of the ECG intervals for the study group with repeated measurement scores, and the independent sample t-test was used for the comparison of the study group and the control group. Electrocardiographic evaluation of acute carbon monoxide poisoning in the Emergency Department was performed by using receiver operating characteristic (ROC) curve analysis. The differentiation threshold values for the relevant intervals were calculated using the Youden Index. The analysis for the study were performed with the SPSS pack 25 statistics software.
RESULTS
The study was conducted on 160 patients, 80 patients in the control group and 80 patients in the study group. Fifty patients (62.5%) in both the study group and control group were females. The mean age of the study group was 35.90 ±14.59 years; and the mean age of the control group was 37.14 ± 10.03 years.
When the ECG intervals of the study group with repeated measurement scores were compared, a statistically significant difference was observed between pre-treatment and post-treatment ECG intervals in all values except for the PR interval. While a significant decrease was observed in the CO P-wave duration, QRS duration, and QTC interval values in the post-treatment group, a significant increase was observed in the PP interval, QT interval, and RR interval values in the post-treatment group (all p<0.05, Table I).
Table I: Descriptive statistics and comparison results regarding pre- and post-treatment ECG intervals of the study group.
|
Variables |
Pre-treatment group |
Post-treatment group |
P-value |
|
Mean ±S.D. |
Mean ±S.D. |
||
|
COHb level (%) |
20.11±5.79 |
6.47±2.06 |
<0.001*** |
|
P-wave duration (msec) |
94.40±14.90 |
88.95±15.66 |
0.001** |
|
QRS duration (msec) |
85.55±12.65 |
83±9.31 |
0.008** |
|
PR interval (msec) |
150.15±24.23 |
152.25±24.31 |
0.123 |
|
PP interval (msec) |
723.14±140.11 |
856.93±144.01 |
<0.001*** |
|
QT interval (msec) |
364.77±27.14 |
388.17±26.21 |
<0.001*** |
|
QTc interval (msec) |
435.05±25.45 |
416.24±22.92 |
<0.001*** |
|
RR interval (msec) |
720.43±133.56 |
857.23±144.40 |
<0.001*** |
|
Note: ** = p <0.05; ** = p <0.01; *** = p <0.001 ** Mean: Average, S.D.: Standard Deviation, %: Percentage, msec: Milliseconds. |
|||
As the measurements obtained for the control group and pre-treatment values of the study group were reviewed, a statistically significant difference was found in the following values: Cohb level (p<0.001), PR interval (p =0.046), PP interval (p<0.001), QT interval (p<0.001), QTC interval (p =0.016), and RR interval (p<0.001). As the post-treatment ECG intervals obtained for the study group and values related to the control group were reviewed, a statistically significant difference was observed in the following values: COHb level (p<0.001), PR interval (p =0.009), PP interval (p =0.041), QTC interval (p =0.010), and RR interval (p =0.036). QT interval values in the post-treatment group were similar to those of the control group (p =0.342, Table II).
Table II: Descriptive statistics regarding ECG intervals of the control group and results of comparison with the study group.
|
Variables |
Control group ECG intervals |
Results of comparison with the study group |
|
|
Mean ± S.D. |
Pre-teatment (p value) |
Post-treatment (p value) |
|
|
COHb level (%) |
2.29±1.62 |
<0.001*** |
<0.001*** |
|
P-wave duration (msec) |
92±14.10 |
0.296 |
0.197 |
|
QRS duration (msec) |
84.01±8.62 |
0.370 |
0.476 |
|
PR interval (msec) |
143.55±16.61 |
0.046* |
0.009** |
|
PP interval (msec) |
815±110.58 |
<0.001*** |
0.041* |
|
QT interval (msec) |
384.15±27.18 |
<0.001*** |
0.342 |
|
QTc interval (msec) |
425.71±23.04 |
0.016* |
0.010* |
|
RR interval (msec) |
814.33±110.31 |
<0.001*** |
0.036* |
|
Note: * * = p <0.05; ** = p <0.01; *** = p <0.001 ** Mean: Average, S.D: Standard Deviation, %: Percentage, msec: Milliseconds. |
|||
Table III: ROC analysis results regarding the diagnostic performance of the pre-treatment ECG intervals.
|
ECG intervals |
AUC (95% CI) |
P value |
Cut off |
Sensitivity (%) |
Specificity (%) |
|
P-wave duration |
0.54 (0.45-0.63) |
0.335 |
|
|
|
|
QRS duration |
0.51 (0.42-0.60) |
0.772 |
|
|
|
|
PR interval |
0.57 (0.48-0.65) |
0.150 |
|
|
|
|
PP interval |
0.29 (0.21-0.37) |
<0.001*** |
677.5 |
56.3 |
7.5 |
|
QT interval |
0.31 (0.23-0.39) |
<0.001*** |
369 |
42.5 |
26.2 |
|
QTC interval |
0.62 (0.53-0.70) |
0.010** |
440.5 |
47.5 |
78.7 |
|
RR interval |
0.29 (0.21-0.37) |
<0.001*** |
677 |
55 |
7.5 |
|
Note: * = p < 0.05; ** = p < 0.01; *** = p < 0.001, CI: Confidence Interval. |
|||||
Measurements with a significance level between ECG intervals included in the ROC curve analysis in order to determine the differentiation power of electrocardiography as a diagnostic tool in acute carbon monoxide poisoning were PP interval (p<0.001), QT interval (p<0.001), QTC interval (p=0.010), and RR interval (p<0.001, Table III).
According to the ROC curve analysis data, while PP interval was the ECG interval with the highest sensitivity (56.3%), it was observed that the QTc interval was the ECG interval with the highest specificity (78.7%). The optimum cut-off value for the PP interval was 677.5 and the specificity was 7.5%. The optimum cut-off value for the QTc interval was 440.5 and the sensitivity was 47.5%. Considering those values that have been obtained, it was observed that the ECG intervals had a weak differentiation power (0.5< area under the curve (AUC) <0.7) in determining acute carbon monoxide poisoning, and the AUC scale in ROC curve analysis for all ECG intervals was between 0.29 and 0.62 (Figure 1).
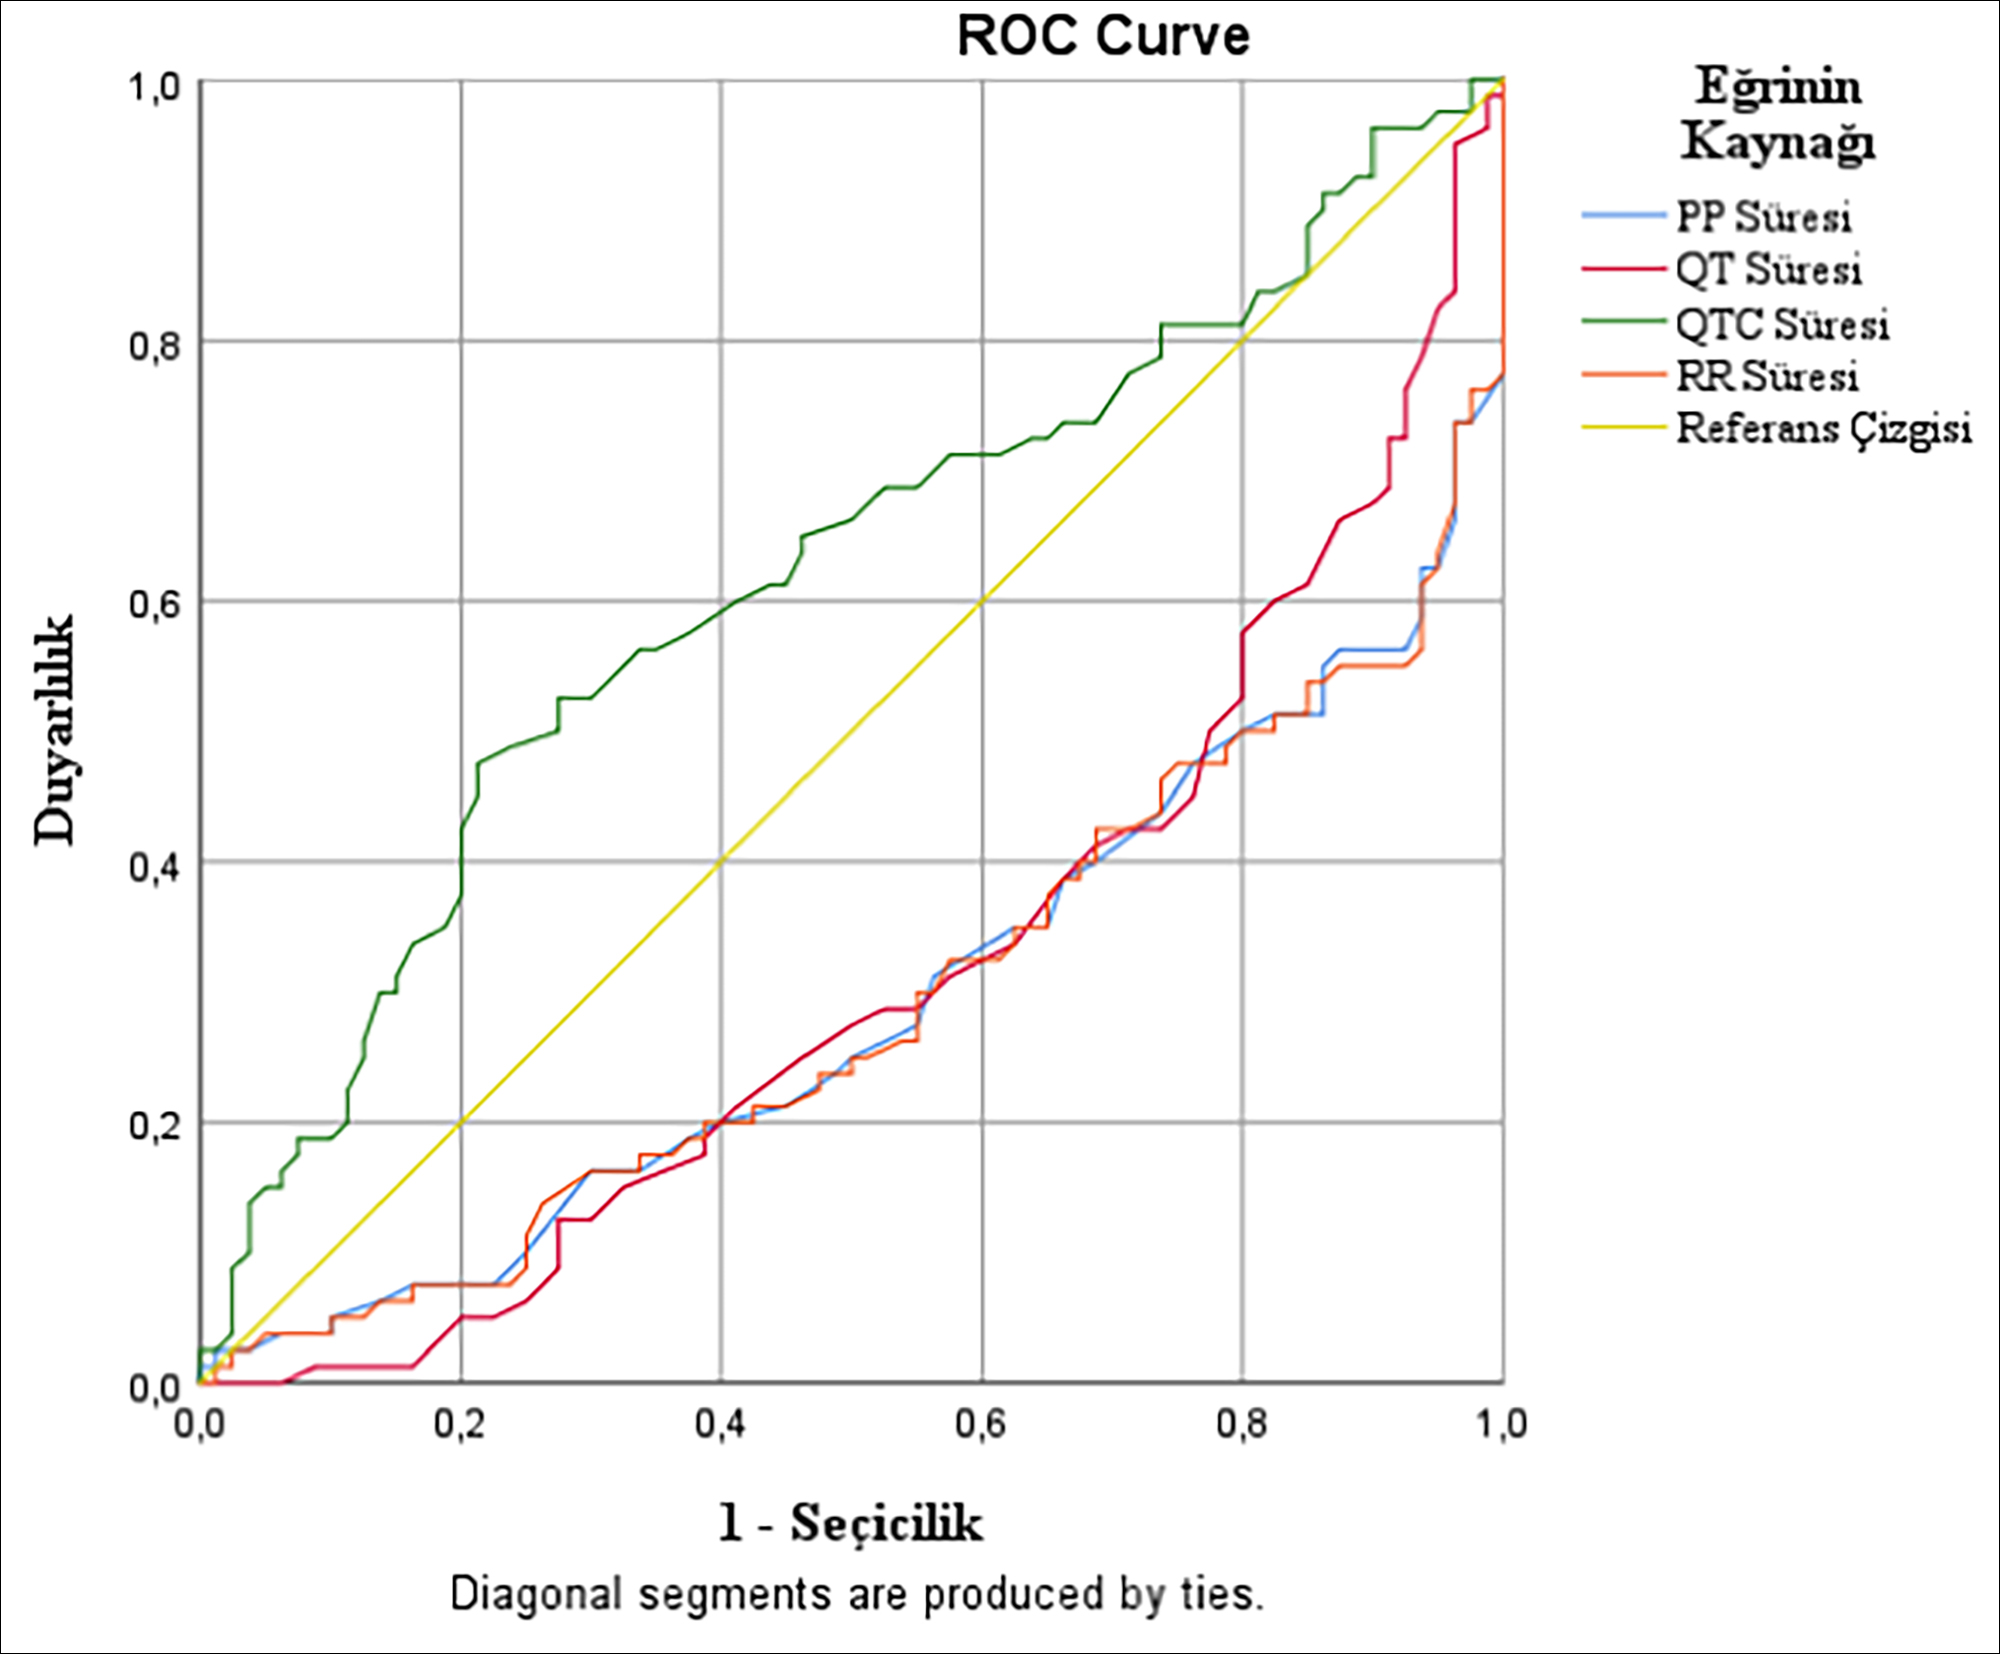 Figure 1. The ROC curve analysis graph of diagnostic performances of the pre-treatment ECG intervals.
DISCUSSION
In acute CO poisoning cases, intracellular calcium increases due to the inhibition of oxidative phosphorylation and decreases ATP use; and the resulting hyperadrenergic state leads to an increase in the risk of arrhythmia; and this mechanism plays a role in the basis of ECG changes.9,10 As the literature was reviewed, the authors did not find a study where ECG intervals were investigated in the evaluation of the diagnosis and treatment response of patients with acute CO poisoning who were admitted to the emergency department due to acute CO poisoning and discharged from the Emergency Department. In this study, it was aimed to investigate whether ECG intervals would be useful in the diagnosis and treatment monitoring of acute CO poisoning.
It was found that the pre-treatment PR and QTc intervals of the study group were longer than that of the control group, and the PP, RR and QT intervals were shorter than the control group. Some previous studies found that acute CO poisonings were associated with prolonged QTc and QT dispersions4,11 and prolonged p-wave dispersions.4 This might be due to the direct hypoxic effect of CO gas on the myocardium, inhomogeneous atrial conduction and impaired ventricular repolarization.11,12 The reason for the prolongation in the pre-treatment PR and QT intervals of the study group, identified in this study, can be explained with this hypothesis stated in the literature. Additionally, many chemical mechanisms triggered by hypoxia in acute CO poisoning cause an increase in the contractility of the heart and tachycardia.1 The shortening of the PP, RR and QTc intervals, which are ECG intervals related to cardiac beat count, may be the result of tachycardia caused by the CO gas. The evaluation of these ECG intervals, whose pre-treatment group values differed with the control group, by ROC analysis demonstrated that PP, RR, QT, and QTc intervals can be used in the diagnosis of acute CO poisoning. However, our study showed that these ECG intervals can detect approximately 50% of patients with acute CO poisoning.
In this study, it was determined that the pre- and post-treatment PR intervals of the study group were significantly higher than the control group, but do not provide diagnostic benefit in the ROC analysis. In addition, the pre- and post-treatment values of the PR interval were similar in the study group. This situation may be explained by the slow AV node and sensory purkinje conduction in the early period of acute CO poisoning and NBOT therapy not affecting this conduction pathway. All these results demonstrated that the PR interval is not a useful ECG interval in the diagnosis and treatment monitoring of acute CO poisoning.
In this study, it was observed that the measurements of the control group and the study group were similar in terms of p-wave durations and QRS complex periods. The negative effect of CO gas on the myocardial oxygen receptors in competition with oxygen and preventing the reuptake of oxygen by the myocardium on the diastolic system which support the heart 13,14 and systolic dysfunction taking place in the late and prolonged periods15 in CO poisoning may be the cause of this situation. In this study, it was observed that these two ECG intervals did not provide any benefit in the diagnosis and treatment follow-up of acute carbon monoxide poisoning.
While it was stated in a previous study that there was prolongation in the QT interval, which was also associated with syncope in acute CO poisoning,16 it was found in two studies in the literature4,17 that there was no change in the QT intervals in acute CO poisoning cases. In this study, it was found that the pre-treatment QT intervals of the study group were shorter than the control group, but demonstrated similar results with the post-treatment control group. Considering the variation in the study group between pre-treatment and post-treatment QT intervals, it can be argued that the QT interval is an ECG interval that may be beneficial for clinicians during treatment monitoring in acute CO poisoning and during discharge. Furthermore, it was observed in this study that PP, RR, QTc and PR intervals in the control group differ from the post-treatment group. The reason for this situation may be that the excessive saturation of the myocardium with oxygen with NBOT treatment causes a decrease more than expected in the cardiac contractility and a decrease more than normal in the cardiac beat in the patient. Therefore, these ECG intervals other than the QT interval in the early period of acute CO poisoning may be misleading in treatment monitoring.
There were some limitations in this study. First, the long-term effects and mortality of acute CO poisoning could not be evaluated since the diagnosis and treatment process was evaluated in the Emergency Department and the discharged population. Moreover, since these patients were not followed up after discharge, it could not be determined how the ECG intervals would change after discharge. Secondly, since NBOT was administered to all patients in the study group and patients who received HBOT were excluded, treatment efficacy analysis could not be performed in acute CO poisoning. Therefore, it could not be determined how the ECG intervals were affected in the population with HBOT indication and in those who received HBOT therapy. Another limitation in this study is that the author did not evaluate other ECG changes and ECG findings associated with arrhythmia.
CONCLUSION
ECG intervals (PP, RR, QT, and QTc intervals) could detect approximately half of the patients with acute CO poisoning, and therefore ECG intervals did not provide as much benefit as COHb measurement in the diagnosis of acute CO poisoning. The QT interval would benefit clinicians in the post-treatment monitoring of patients with acute CO poisoning discharged from the Emergency Department. Clinicians should follow QT intervals closely together with clinical improvement and decrease in COHb value, while deciding about discharge. Multi-site studies with larger samples are needed on this subject matter.
ETHICAL APPROVAL:
This study was approved by the Ethical Committee of Erciyes University School of Medicine.
PATIENTS’ CONSENT:
Written informed consents were obtained from study participants.
CONFLICT OF INTEREST:
The author declared no conflict of interest.
AUTHOR’S CONTRIBUTION:
GY: Conception of the work, data collection, methodology, software, writing and editing.
REFERENCES
- Rose JJ, Wang L, Xu Q, McTiernan CF, Shiva S, Tejero J, et al. Carbon monoxide poisoning: pathogenesis, management, and future directions of therapy. Am J Respir Crit Care Med 2017; 195(5):596-606. doi: 10.1164/rccm. 201606-1275CI.
- Garg J, Krishnamoorthy P, Palaniswamy C, Khera S, Ahmad H, Jain D, et al. Cardiovascular abnormalities in carbon monoxide poisoning. Am J Ther 2018; 25(3):e339-48. doi: 10.1097/MJT.0000000000000016.
- Marchewka J, Gawlik I, Dębski G, Popiołek L, Marchewka W, Hydzik P. Cardiological aspects of carbon monoxide poisoning. Folia Med Cracov 2017; 57(1):75-85.
- Hancı V, Ayoğlu H, Yurtlu S, Yıldırım N, Okyay D, Erdoğan G, et al. Effects of acute carbon monoxide poisoning on the P-wave and QT interval dispersions. Anadolu Kardiyol Derg 2011; 11(1):48-52. doi: 10.5152/akd.2011.009.
- Sbrollini A, De Jongh MC, Ter Haar CC, Treskes RW, Man S, Burattini L, et al. Serial electrocardiography to detect newly emerging or aggravating cardiac pathology: a deep-learning approach. Biomed Eng Online 2019; 8(1):15. doi: 10.1186/s12938-019-0630-9.
- Yurumez Y, Yavuz Y, Saglam H, Durukan P, Ozkan S, Akdur O, et al. Electro-cardiographic findings of acute organo-phosphate poisoning. J Emerg Med 2009; 36(1):39-42. doi: 10.1016/j.jemermed.2007.08.063.
- Sheibani M, Zamani N, Hassanian-Moghaddam H. Electrocardiographic findings in mortalities due to pure methadone toxicity. Cardiovasc Toxicol 2019; 19(1):62-71. doi: 10.1007/s12012-018-9474-y.
- Mehta N, Vannozzi R. Lithium-induced electrocardiographic changes: A complete review. Clin Cardiol 2017; 40(12):1363-7. doi: 10.1002/clc.22822.
- Andre L, Boissie`re J, Reboul C, Perrier R, Zalvidea S, Meyer G, et al. Carbon monoxide pollution promotes cardiac remodeling and ventricular arrhythmia in healthy rats. Am J Respir Crit Care Med 2010; 181:587-95.
- Kinoshita H, Türkan H, Vucinic S, Naqvi S, Bedair R, Rezaee R, et al. Carbon monoxide poisoning. Toxicol Rep 2020; 7:169-173. doi: 10.1016/j.toxrep.2020.01.005.
- Yelken B, Tanriverdi B, Cetinbaş F, Memiş D, Süt N. The assessment of QT intervals in acute carbon monoxide poisoning. Anadolu Kardiyol Derg 2009; 9(5):397-400. PMID: 19819791.
- Gozubuyuk AA, Dag H, Kacar A, Karakurt Y, Arica V. Epidemiology, pathophysiology, clinical evaluation, and treatment of carbon monoxide poisoning in child, infant, and fetus. North Clin Istanb 2017; 4(1):100-7. doi:10.14744/nci.2017.49368.
- Einzig S, Nicoloff DM, Lucas RV Jr. Myocardial perfusion abnormalities in carbon monoxide poisoned dogs. Can J Physiol Pharmacol 1980; 58(4):396-405. doi: 10.1139/ y80-067.
- Dziewierz A, Ciszowski K, Gawlikowski T, Rakowski T, Kleczyński P, Surdacki A, et al. Primary angioplasty in patient with ST segment elevation myocardial infarction in the setting of intentional carbon monoxide poisoning. J Emerg Med 2013; 45:831-4.
- Alvarez Villela M, Wever-Pinzon O, Parikh M, Deru K, Muhlestein JB, Anderson JL, et al. Patterns of cardiac dysfunction after carbon monoxide poisoning. Undersea Hyperb Med 2020 Third- Quarter; 47(3):477-485. PMID: 32931676.
- Onvlee-Dekker IM, De Vries AC, Ten Harkel AD. Carbon monoxide poisoning mimicking long-QT induced syncope. Arch Dis Child 2007; 92: 244-5.
- Gurkan Y, Canatay H, Toprak A, Ural E, Toker K. Carbon monoxide poisoning - a cause of increased QT dispersion. Acta Anaesthesiol Scand 2002; 46:180-3.