A Comparative Analysis of Superoxide Dismutase 1 Level in Diabetics with and without Neuropathy
By Kanwal Huma, Khadija Mehboob, Amir Rashid, Asifa MajeedAffiliations
doi: 10.29271/jcpsp.2021.07.765ABSTRACT
Objective: To compare superoxide dismutase 1 (SOD1) levels in diabetes mellitus patients with and without neuropathy.
Study Design: Cross-sectional comparative study.
Place and Duration of Study: Multidisciplinary Lab-1 of the Department of Biochemistry and Molecular Biology, Army Medical College, in cooperation with Pak-Emirates Military Hospital, Rawalpindi, Pakistan, from January 2020 to January 2021.
Methodology: Eighty-four subjects were enrolled through non-probability purposive sampling technique. They were further divided into three groups. Patients with diabetic neuropathy were labelled as the group Ι, and patients with diabetes mellitus without neuropathy were included in group ΙΙ. While group ΙΙΙ was comprised of healthy individuals and taken as control. Biochemical parameters included fasting blood glucose levels and HbA1c. Superoxide dismutase-1 levels were measured by enzyme-linked immunosorbent assay (ELISA). Data were evaluated by SPSS version 22.0 and presented in percentage and mean ± standard deviation (SD). Independent sample t-test and one–way ANOVA followed by the post-hoc Tukey test were used for group comparison.
Results: Mean level of SOD1 was significantly higher in group Ι as compared to group ΙΙ and ΙΙΙ (p<0.001). Statistically significant difference was observed among groups Ι and ΙΙ (p=0.002), Ι and ΙΙΙ (p<0.001), and ΙΙ and ΙΙΙ (p=0.017). Mean levels of SOD1 were also significantly increased with poor glycemic control (p<0.001).
Conclusion: SOD1 level was considerably high in patients with diabetes mellitus with neuropathy in comparison to diabetics without neuropathy and healthy individuals.
Key Words: Diabetes mellitus, Diabetic neuropathy, ELISA, Superoxide dismutase 1(SOD1).
INTRODUCTION
Diabetic neuropathy is a microvascular complication of diabetes mellitus (DM). It affects approximately 30% to 90% of patients with DM in the world.1 Diabetic peripheral neuropathy (DPN), is the most common type of diabetic neuropathy.2 Oxidative stress is the main mechanism involved in the pathogenesis of DPN. It is caused by an imbalance between the generation of oxidative substances and antioxidants of the body.3
The first line enzyme to neutralise superoxide-free radicle in the chain of an antioxidant system is superoxide dismutase (SOD). It catalyses the generation of molecular oxygen and hydrogen peroxide from superoxide-free radical. Various isozymes of SOD are existing in mammals, which are products of distinct genes.4
Cytosolic and extracellular SOD enzyme is Cu-Zn and referred to as SOD1, and SOD3, respectively; while mitochondrial SOD is Mn-Zn and referred to as SOD2.5 Many studies have narrated the conflicting behaviour of intracellular and plasma SOD activity in patients with DM and its complications.6 Among various isoforms of SOD, the current study focused on the analysis of SOD1 levels. The present study aimed to compare SOD1 levels in patients with DM with and without neuropathy.
METHODOLOGY
This comparative cross-sectional study took place at Multidisciplinary Lab-1, Department of Biochemistry and Molecular Biology, Army Medical College, in coordination with Pak-Emirates Military Hospital, Rawalpindi, from January 2020 to January 2021. The research was carried out after the formal approval from the Ethical Review Committee of Army Medical College, Rawalpindi.
A total of 84 subjects had participated in this study. World Health Organization (WHO) calculator was used to calculate the sample size, based on reference prevalence 6.9%7 with 95% confidence interval and 5% error. The study participants were enrolled through non-probability purposive sampling technique. They were split into three groups. In the group Ι, 28 patients with diabetic neuropathy were included. Group ΙΙ contained 28 diabetics without neuropathy, and group ΙΙΙ comprised of 28 healthy individuals and taken as controls. The inclusion criteria of this study were diagnosed diabetics (with and without neuropathy) of both genders between the age group 30-70 years. The subjects with non-diabetic neuropathy, lower limb amputation, evidence of peripheral arterial disease, foot edema, and lumbosacral pathology were excluded from this study.
Diabetics with and without peripheral neuropathy were diagnosed by the medical specialist, based on history and clinical examinations by using diabetic neuropathy symptom (DNS) score and modified neuropathy disability score (MNDS). DNS score included unsteadiness in walking, numbness, burning, aching pain or tenderness, and prickling sensations on legs and feet. The maximum score was 4 and the minimum was 0 points. Points 1-4 referred presence of peripheral neuropathy. While, modified MNDS included neuropathic signs that were decreased or absent ankle reflexes, reduced or absent distal vibration perception by using a 128-Hz tuning fork, temperature perception on the dorsum of foot and pin-prick sensations. The maximum score was 10. The score with 3-5 points considered mild, 6-8 points moderate, and 9-10 with severe neuropathic deficits.
The written and informed consent was taken from each participant prior to the collection of data. Clinical data along with demographic details were gathered through a structured questionnaire. A fasting venous sample of 5ml was drawn from subjects under aseptic measures. From which, 3ml is collected in serum separator vacutainers for estimation of superoxide dismutase levels and 2ml for fasting blood glucose (FBG) and glycated hemoglobin (HbA1c) levels. Serum SOD1 levels were measured using human SOD1 (soluble, superoxide dismutase 1) ELISA Kit, catalog No. E-EL-H1113 (Elabscience®). While HbA1c was assessed by ADVIA chemistry enzymatic hemoglobin A1c assay.
Data were evaluated by using Statistical Package for Social Sciences (SPSS), version 22.0. Qualitative variables were expressed as percentages, while quantitative variables were assessed as mean and standard deviation (± SD). For group comparison, independent sample t-test and one–way ANOVA, followed by a post-hoc Tukey test were used. Pearson correlation was used to correlate SOD1 with FBG, HbA1c and duration of diabetes mellitus. Results with a p-value of ≤0.05 were considered statistically significant.
RESULTS
Eighty-four subjects of both genders [males 53 (63.1%) and females 31 (36.9%)] were included in this study. The mean age of group Ι was 52.93 ± 10.26 years, group ΙΙ was 51.32 ± 9.92 years, and group ΙΙΙ was 48.00 ± 10.67 years. These results were statistically non-significant (p=0.194). Body mass index (BMI) mean values ±SD of group Ι, ΙΙ, and ΙΙΙ were 25.10 ± 2.70, 25.76 ± 3.69, and 24.84± 2.68, respectively. These results were also statistically non-significant (p=0.508). Compared to group ΙΙ (3.60 ± 2.56 years), the mean duration of diabetes mellitus was greater in group Ι (6.08±4.48 years), and was statistically significant (p=0.015).
FBG levels were more in group Ι (10.66± 4.55) as compared to group ΙΙ (9.59± 3.63) and group ΙΙΙ (5.18± 0.50) with p-value <0.001. As well, HbA1c was also highest in group Ι (8.64 ± 2.63) as compared to group ΙΙ (7.70± 1.79) and group ΙΙΙ (5.16± 0.50) with p-value <0.001.
Mean values of SOD1 are shown in figure Ι and a comparison of p-values of SOD1, FBG, and HbA1c by post-hoc Tukey test are given in Table Ι. SOD1 levels are significantly higher in group Ι in comparison to other groups. Table ΙΙ showed SOD1 levels with glycemic control and duration of diabetes. SOD1 levels were significantly increased with poor glycemic control.
SOD1 had positive and significant correlation with HbA1c (r=0.476, p<0.001), FBG (r=0.432, p<0.001), and positive non-significant correlation with duration of diabetes mellitus (r=0.215, p=0.111).
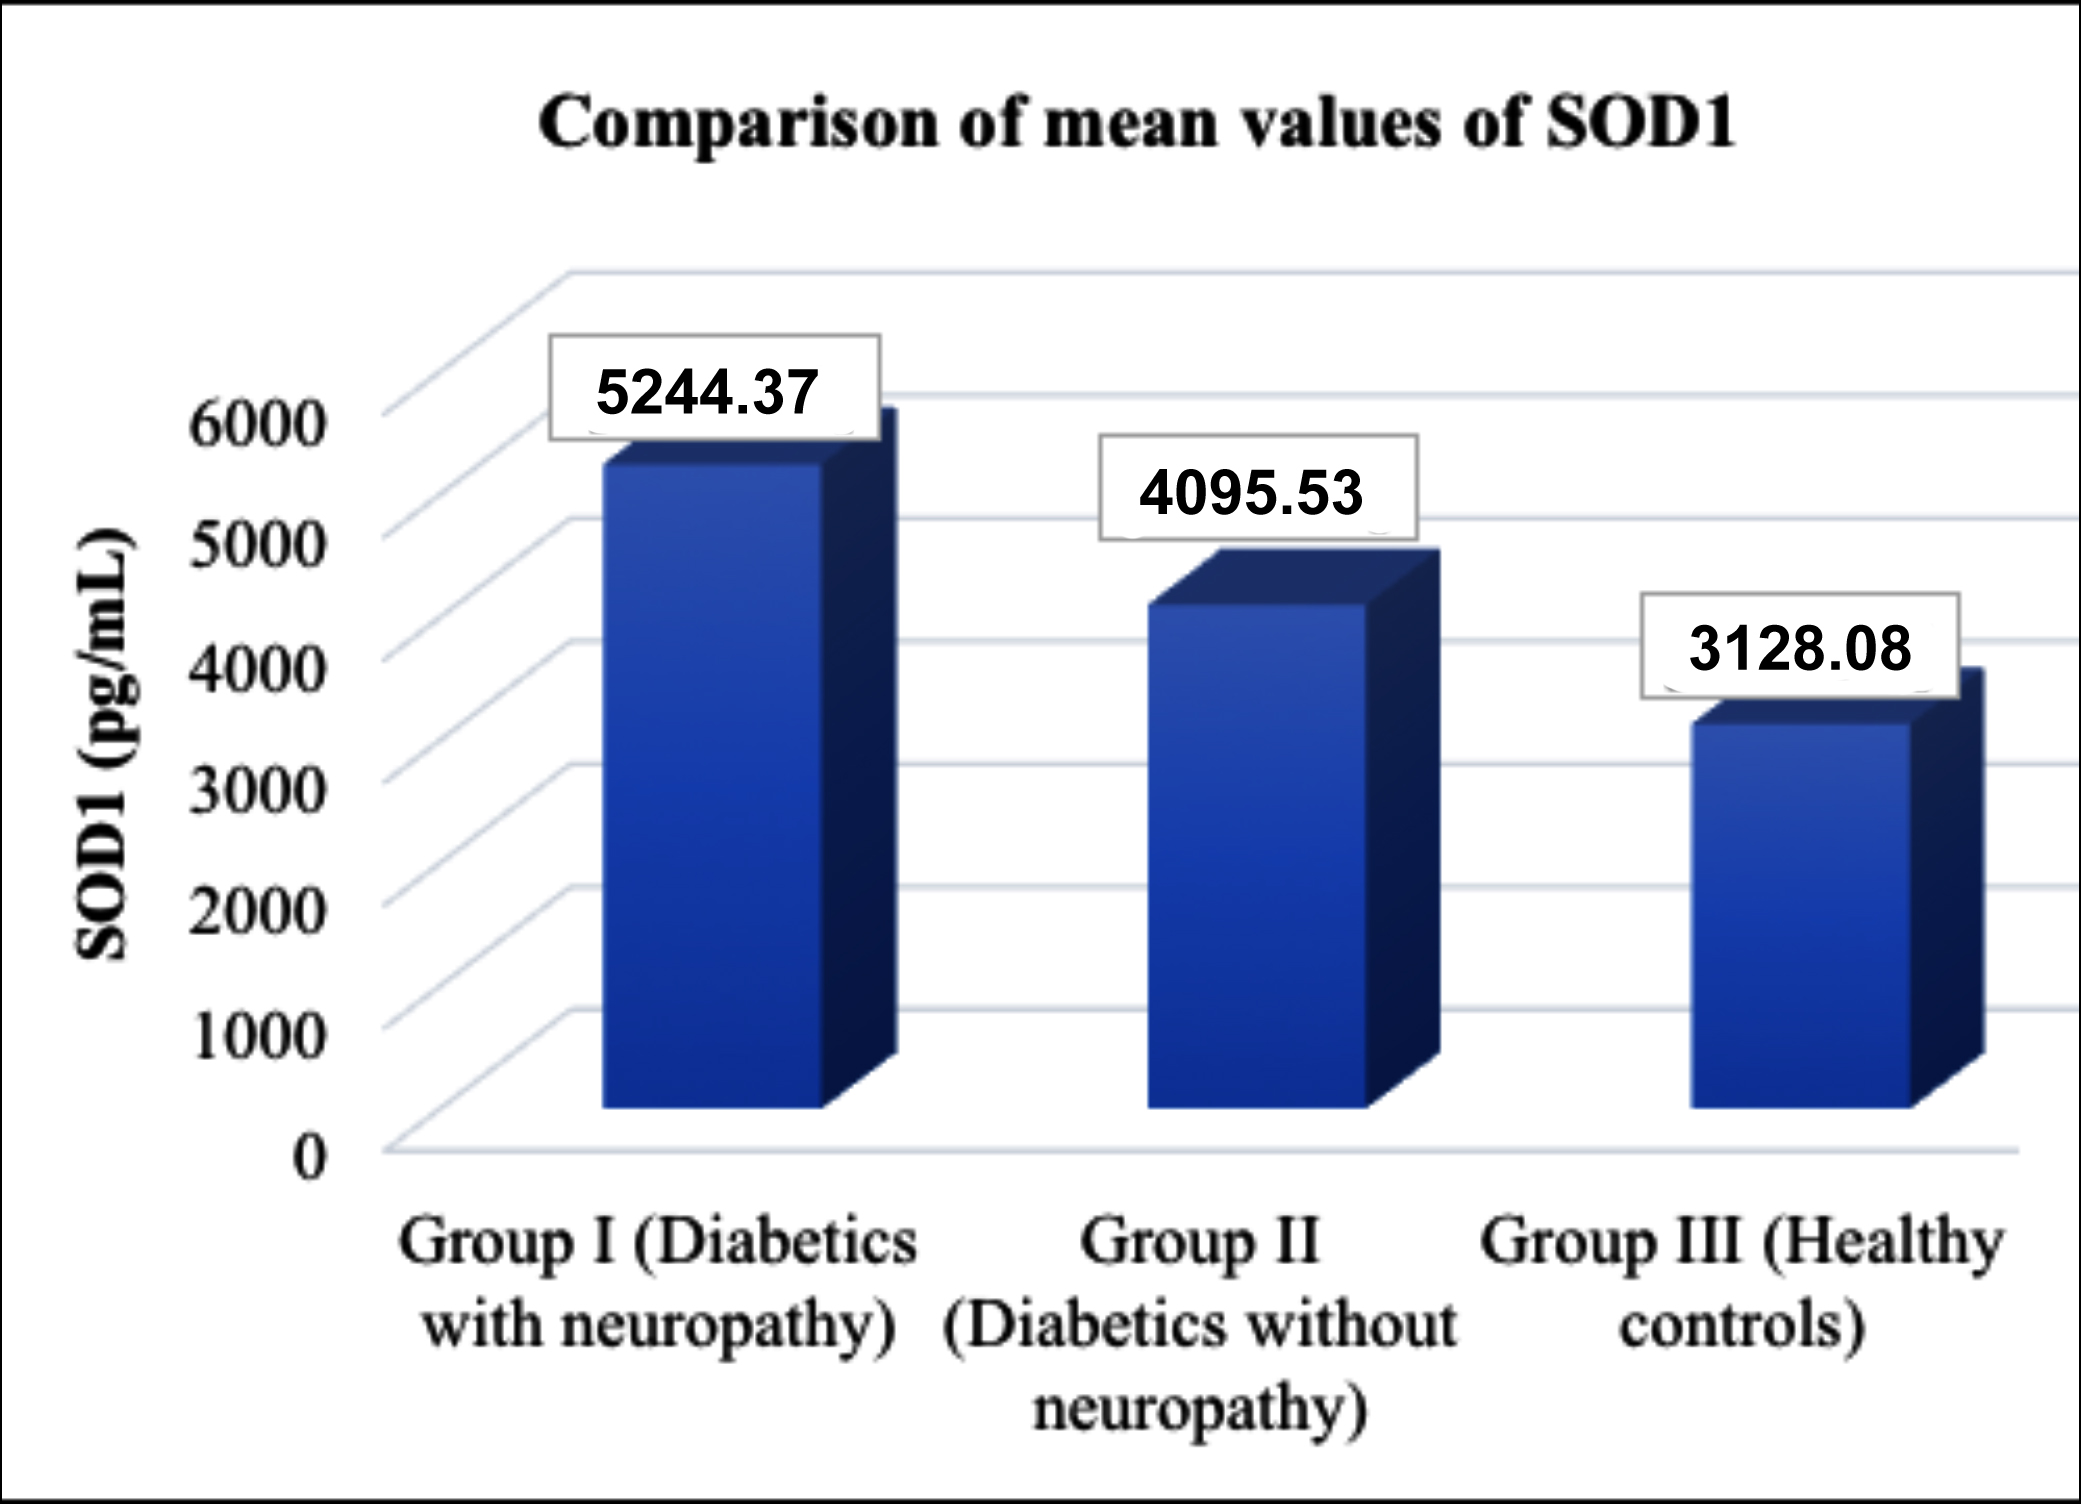 Figure 1: A column chart showing mean values of SOD1 (superoxide dismutase1) in the three groups (p-value <0.001).
Table Ι: Comparisons between the groups by ANOVA, followed by post-hock Tukey test.
|
|
Group Ι Vs |
Group ΙΙ Vs |
|
|
Group ΙΙ |
Group ΙΙΙ |
Group ΙΙΙ |
|
|
SOD1 |
0.002* |
<0.001* |
0.017* |
|
HbA1c |
0.151 |
<0.001* |
<0.001* |
|
FBG |
0.465 |
<0.001* |
<0.001* |
|
Group I (diabetics with neuropathy), group II (diabetics without neuropathy), group III (healthy controls), SOD1 (superoxide dismutase 1), HbA1c (glycated hemoglobin), FBG (fasting blood glucose) *Shows statistically significant result (p ≤0.05). |
|||
Table ΙΙ: SOD1 levels depending on glycemic control and duration of diabetes.
|
Parameters |
|
SOD 1 (pg/mL) Mean ± SD |
p-value |
|
Glycemic control |
HbA1c <7% |
3676.65 ± 1469.20 |
<0.001* |
|
HbA1c 7-9% |
4849.14± 1216.72 |
||
|
HbA1c >9% |
5103.01± 1076.32 |
||
|
Duration of Diabetes |
<5 years |
4446.70± 1294.26 |
0.234 |
|
5-10 years |
4875.02± 1260.89 |
||
|
>10 years |
5430.605 ± 864.48 |
||
|
*Shows significant result (p ≤0.05). |
|||
DISCUSSION
Diabetic peripheral neuropathy is one of the primary causes of morbidity and mortality in patients with type II DM. As it progresses, it leads to non-traumatic limb amputations through foot ulceration and gangrene; and thus, deteriorates the quality of life of patients and causes a socio-economic burden.8
The present study reported that FBG and HbA1c levels were significantly elevated in patients with diabetic neuropathy in comparison to other groups. There was no significant difference observed in glycemic control parameters between diabetics with neuropathy in comparison to diabetics without neuropathy. These findings are in agreement with findings reported by Li et al.9 Increased blood glucose levels and glycation of hemoglobin supported the fact that hyperglycemia was the major factor involved in the pathogenesis of diabetic neuropathy and it activated the various biochemical pathways, which caused the overproduction of oxidants, like superoxide anion and hydroxyl radicals.10
Diabetes mellitus and its complications are linked with increased oxidative stress, but the reports about the antioxidant defence system of the body are not conclusive. So, the present study compared the SOD1 levels in patients with diabetic neuropathy, diabetics without neuropathy, and healthy subjects. This study reported the statistically significant increased levels of SOD1 in patients with diabetic neuropathy in comparison to diabetics without neuropathy and healthy controls. These findings are comparable with the study carried out by Ganjifrockwala et al. They reported significantly increased levels of Cu-Zn superoxide dismutase in patients with diabetic retinopathy in comparison to diabetics without retinopathy and control group.11 In another study, Lodovici et al., reported the increased SOD levels in patients with DM with complications in comparison to those without complications.12 While, Tavares et al., reported increased activity of SOD1 in type ΙΙ diabetics as compared with pre-diabetics and control group.13
Contrary to the present study, many studies reported that the SOD levels were decreased in diabetic neuropathy patients in comparison to the control group. They explained their findings with the hypothesis that increased peroxidation led to the consumption of antioxidants of the body,14,15 and glycosylation of SOD caused inactivation of this enzyme.16
Superoxide dismutase is the first-line defense against reactive oxygen species (ROS) production because it is involved in the direct elimination of ROS. In the present study, the findings of elevated serum SOD1 levels in diabetics with neuropathy in comparison to diabetics without neuropathy and controls, reflected the compensatory mechanisms in response to increased oxidative stress in DN group. This increased levels of the antioxidant enzyme caused increased cellular capacity to fight against ROS, thereby restricting the damage caused by free radicles. Another study reported that oxidative stress and inflammation induced by hyperglycemia led to increased SOD production by leukocytes and monocytes.17
Bitel et al., reported that expression of SOD1 is induced by oxidative stress and caused increased SOD1 accumulation in diabetic myocytes.18 Ninic et al., reported significantly increased normalised Cu/Zn SOD mRNAs in patients with oxidative stress in comparison to controls. Chronic oxidative stress and inflammation caused increase induction of SOD isoenzymes genes due to superoxide anion, which is positive modulators of the transcriptional process of antioxidative enzymes.19
Verma et al., reported decreased SOD levels with poor glycemic control.20 Jimenez-Osorio et al. reported the elevation of SOD levels with poorly controlled glycemia and their findings are in agreement with the findings of current study.21 This elevation in SOD levels represented high oxidative stress in diabetics with poor glycemic control. Zarei et al., reported a direct correlation of SOD with HbA1c; and this is in accordance with the findings of the current study, which further augment the result of the study as SOD1 increased with poor glycemic control.22 Other studies reported a significant negative association of SOD with HbA1c.23 Another study reported the significantly positive correlation of fasting blood sugar levels with SOD;24 and this is in agreement with the findings of the current study. This study also reported no significant change in SOD levels with prolonged duration of diabetes; and these findings are in concordance with the findings reported by Verma et al.20
There may be two reasons for increased SOD in patients with diabetic neuropathy:
First, hyperglycemia-induced metabolic pathways caused the production of more free radicles like superoxide anion and caused induction of the SOD1 gene, which lead to increased production of SOD levels to counteract this oxidative stress. Second, there may be genetic variations that can alter the functionality and activity of this enzyme, according to the variation in genetic makeup of the population.
Small sample size and limited funds were the limitations of this study. More studies can be performed in the future on a bigger sample size with all isoforms of SOD along with other antioxidants, to evaluate oxidative stress in patients with DN. To understand the relationship between disrupting antioxidant defence systems, genetic polymorphism and DN development, further studies are required.
CONCLUSION
SOD1 levels were higher in patients with diabetic neuropathy in comparison to diabetics without neuropathy and healthy controls. The elevation of SOD1 levels suggested the compensatory response to increased oxidative stress in patients with diabetic neuropathy as compared to those without neuropathy; and can be considered as an oxidative stress biomarker.
DISCLOSURE:
It is a thesis-based article.
ETHICAL APPROVAL:
Ethical Review Committee of Army Medical College, Rawalpindi, Pakistan had approved the conduction of this study. (Approval letter No. ERC/ID/79, dated 13/11/2020).
PATIENTS’ CONSENT:
Written and informed consent was obtained from every study participant prior to the collection of data.
FUNDING:
The present study was funded by a research fund programme for postgraduate trainees, National University of Medical Sciences (NUMS), Rawalpindi.
CONFLICT OF INTEREST:
The authors declared no conflict of interest.
AUTHORS’ CONTRIBUTION:
KH: Manuscript writing, collection, analysis and interpretation of data.
KM: Contribution to design of the work, final approval of the version to be published.
AR, AM: Critical review.
REFERENCES
- Dewanjee S, Das S, Das AK, Bhattacharjee N, Dihingia A, Dua TK, et al. Molecular mechanism of diabetic neuropathy and its pharmacotherapeutic targets. Eur J Pharmacol 2018; 833:472-523. doi: 10.1016/j.ejphar.2018.06.034.
- Pop-Busui R, Boulton AJ, Feldman EL, Bril V, Freeman R, Malik RA, et al. Diabetic neuropathy: A position statement by the american diabetes association. Diab Care 2017; 40(1):136-54. doi: 10.2337/dc16-2042.
- Li QR, Wang Z, Zhou W, Fan SR, Ma R, Xue L, et al. Epalrestat protects against diabetic peripheral neuropathy by alleviating oxidative stress and inhibiting polyol pathway. Neural Regen Res 2016; 11(2):345. doi: 10.4103/1673-5374.177745.
- Strom A, Kaul K, Brüggemann J, Ziegler I, Rokitta I, Püttgen S, et al. Lower serum extracellular superoxide dismutase levels are associated with polyneuropathy in recent-onset diabetes. Exp Mol Med 2017; 49(11):e394. doi: 10.1038/ emm.2017.173.
- Pourvali K, Abbasi M, Mottaghi A. Role of superoxide dismutase 2 gene ala16val polymorphism and total antioxidant capacity in diabetes and its complications. Avicenna J Med Biotechnol 2016; 8(2):48.
- Carrillo-Ibarra S, Miranda-Díaz AG, Sifuentes-Franco S, Cardona-Muñoz EG, Rodríguez-Carrizalez AD, Villegas-Rivera G, et al. Effect of statins on oxidative DNA damage in diabetic polyneuropathy. J Circ Biomark 2018; 7:1849454418804099. doi: 10.1177/1849454418804099.
- Bukhsh A, Khan TM, Nawaz MS, Ahmed HS, Chan KG, Goh BH. Association of diabetes knowledge with glycemic control and self-care practices among pakistani people with type 2 diabetes mellitus. Diab Metab Syndr Obes 2019; 12:1409. doi: 10.2147/DMSO.S209711.
- Su JB, Zhao LH, Zhang XL, Cai HL, Huang HY, Xu F, et al. Hba1c variability and diabetic peripheral neuropathy in type 2 diabetic patients. Cardiovasc Diabetol 2018; 17(1):47. doi: 10.1186/s12933-018-0693-0.
- Li Q, Zhong Y, Zhang T, Zhang R, Zhang Q, Zheng H, et al. Quantitative analysis of corneal nerve fibers in type 2 diabetics with and without diabetic peripheral neuropathy: Comparison of manual and automated assessments. Diab Res Clin Pract 2019; 151:33-38. doi: 10.1016/j.diabres. 2019.03.039.
- Madi M, Babu S, Kumari S, Shetty S, Achalli S, Madiyal A, et al. Status of serum and salivary levels of superoxide dismutase in type 2 diabetes mellitus with oral manifestations: A case control study. Ethiop J Health Sci 2016; 26(6):523-32. doi: 10.4314/ejhs.v26i6.4.
- Ganjifrockwala F, Joseph J, George G. Serum total superoxide dismutase enzyme activity in type 2 diabetic patients with retinopathy in mthatha region of the eastern cape province of south africa. Biomed Res 2017; 28(2):532-38.
- Lodovici M, Bigagli E, Luceri C, Mannucci E, Rotella CM, Raimondi L. Gender-related drug effect on several markers of oxidation stress in diabetes patients with and without complications. Eur J Pharmacol 2015; 766:86-90. doi: 10.1016/j.ejphar.2015.09.041.
- Tavares AM, Silva JH, de Oliveira Bensusan C, Ferreira ACF, de Lima Matos LP, e Souza KLDA, et al. Altered superoxide dismutase-1 activity and intercellular adhesion molecule 1 (Icam-1) levels in patients with type 2 diabetes mellitus. PLoS One 2019; 14(5). doi: 10.1371/journal. pone.0216256.
- Abohassan A, Al-Barshomy S, Al-kobaty S. Study of malondialdehyde as oxidative stress and superoxide dismutase as enzymatic antioxidant in type 2 diabetes mellitus patients with and without peripheral neuritis. Int J Adv Res 2016; 4:788-93.
- Kasznicki J, Sliwinska A, Kosmalski M, Merecz A, Majsterek I, Drzewoski J. Genetic polymorphisms (Pro197leu of Gpx1,+ 35a/C of Sod1,− 262c/T of Cat), the level of antioxidant proteins (Gpx1, Sod1, Cat) and the risk of distal symmetric polyneuropathy in polish patients with type 2 diabetes mellitus. Adv Med Sci 2016; 61(1):123-9. doi: 10.1016/j.advms.2015.10.006.
- Nagarajrao R, Alharbi SA. Relationship between oxidant and antioxidant enzymes status in type 2 diabetic patients with nephropathy in saudi population. Asian J Pharm Clin Res 2018; 11(1):363-8.
- Vichaibun V, Khananurak K, Sophonnithiprasert T. Comparative analysis of plasma total antioxidant capacity in patients with hyperglycemia and hyperglycemia plus dyslipidemia. Diab Metab Synd 2019; 13(1):90-4. doi: 10.1016/j.dsx.2018.08.029.
- Bitel CL, Feng Y, Souayah N, Frederikse PH. Increased expression and local accumulation of the prion protein, alzheimer aβ peptides, superoxide dismutase 1, and nitric oxide synthases 1 & 2 in muscle in a rabbit model of diabetes. BMC Physiol 2010; 10:18. doi: 10.1186/1472- 6793-10-18.
- Ninić A, Sopić M, Munjas J, Spasojević-Kalimanovska V, Kotur-Stevuljević J, Bogavac-Stanojević N, et al. Association between superoxide dismutase isoenzyme gene expression and total antioxidant status in patients with an end-stage renal disease. Balkan Med J 2018; 35(6):431. doi: 10.4274/balkanmedj.2018.0170.
- Verma S, Alam R, Ahmad I, Singla D, Ali K, Hussain ME. Effect of glycemic control and disease duration on cardiac autonomic function and oxidative stress in type 2 diabetes mellitus. J Diabetes Metab Disord 2018; 17(2):149-58. doi: 10.1007/s40200-018-0354-6.
- Jiménez-Osorio AS, Picazo A, González-Reyes S, Barrera-Oviedo D, Rodríguez-Arellano ME, Pedraza-Chaverri J. Nrf2 and redox status in prediabetic and diabetic patients. Int J Mol Sci 2014; 15(11):20290-305. doi: 10.3390/ijms 151120290.
- Zarei M, Farahnak Z, Hosseinzadeh-Attar MJ, Javanbakht MH, Hosseinzadeh P, Derakhshanian H, et al. Lipid peroxidation and antioxidant enzymes activity in controlled and uncontrolled type 2 diabetic patients. ARYA Atheroscle 2016; 12(3):118.
- Astari L, Cahyono H, Widjajanto E. Correlation of interleukin-10, superoxide dismutase (Sod), and malondialdehyde (Mda) levels with Hba1c in pediatric type 1 diabetes mellitus. J Trop Life Sci 2017; 7(3):286-92. doi: 10.11594/jtls.07.03.15
- Ngaski A. Correlation of antioxidants enzymes activity with fasting blood glucose in diabetic patients in sokoto, nigeria. J Adv Med Med Res 2018:1-6. DOI: 10.9734/ JAMMR/2018/38627.